10.1101/gr.127191.111
Access the most recent version at doi:
published online March 28, 2012
Genome Res.
Daniel Marbach, Sushmita Roy, Ferhat Ay, et al.
integrative inference of transcriptional networks
by
Drosophila melanogaster
Predictive regulatory models in
Material
Supplemental
http://genome.cshlp.org/content/suppl/2012/03/23/gr.127191.111.DC1.html
P<P
Published online March 28, 2012 in advance of the print journal.
License
Commons
Creative
.
http://creativecommons.org/licenses/by-nc/3.0/
described at
as
a Creative Commons License (Attribution-NonCommercial 3.0 Unported License),
). After six months, it is available under
http://genome.cshlp.org/site/misc/terms.xhtml
for the first six months after the full-issue publication date (see
This article is distributed exclusively by Cold Spring Harbor Laboratory Press
service
Email alerting
click here
top right corner of the article or
Receive free email alerts when new articles cite this article - sign up in the box at the
object identifier (DOIs) and date of initial publication.
by PubMed from initial publication. Citations to Advance online articles must include the digital
publication). Advance online articles are citable and establish publication priority; they are indexed
appeared in the paper journal (edited, typeset versions may be posted when available prior to final
Advance online articles have been peer reviewed and accepted for publication but have not yet
http://genome.cshlp.org/subscriptions
go to:
Genome Research
To subscribe to
Predictive regulatory models in
Drosophila melanogaster
by integrative inference of transcriptional networks
Daniel Marbach,
1,2,7Sushmita Roy,
1,2,3,7Ferhat Ay,
1,2,4,5Patrick E. Meyer,
1,2,6Rogerio Candeias,
1,2Tamer Kahveci,
5Christopher A. Bristow,
1,2and Manolis Kellis
1,2,8 1Computer Science and Artificial Intelligence Laboratory (CSAIL), Massachusetts Institute of Technology (MIT), Cambridge,
Massachusetts 02139, USA;
2Broad Institute of MIT and Harvard, Cambridge, Massachusetts 02140, USA;
3Biostatistics and Medical
Informatics, University of Wisconsin, Madison, Wisconsin 53706, USA;
4Department of Genome Sciences, University of Washington,
Seattle, Washington 98195, USA;
5Computer and Information Science and Engineering, University of Florida, Gainesville, Florida
32611, USA;
6Machine Learning Group, Faculte´ des Sciences, FNRS, Universite´ Libre de Bruxelles, Brussels 1050, Belgium
Gaining insights on gene regulation from large-scale functional data sets is a grand challenge in systems biology. In this
article, we develop and apply methods for transcriptional regulatory network inference from diverse functional genomics
data sets and demonstrate their value for gene function and gene expression prediction. We formulate the network
inference problem in a machine-learning framework and use both supervised and unsupervised methods to predict
regulatory edges by integrating transcription factor (TF) binding, evolutionarily conserved sequence motifs, gene
ex-pression, and chromatin modification data sets as input features. Applying these methods to
Drosophila melanogaster,
we
predict
~
300,000 regulatory edges in a network of
~
600 TFs and 12,000 target genes. We validate our predictions using
known regulatory interactions, gene functional annotations, tissue-specific expression, protein–protein interactions, and
three-dimensional maps of chromosome conformation. We use the inferred network to identify putative functions for
hundreds of previously uncharacterized genes, including many in nervous system development, which are independently
confirmed based on their tissue-specific expression patterns. Last, we use the regulatory network to predict target gene
expression levels as a function of TF expression, and find significantly higher predictive power for integrative networks
than for motif or ChIP-based networks. Our work reveals the complementarity between physical evidence of regulatory
interactions (TF binding, motif conservation) and functional evidence (coordinated expression or chromatin patterns) and
demonstrates the power of data integration for network inference and studies of gene regulation at the systems level.
[Supplemental material is available for this article.]
Transcriptional regulatory networks describe the regulatory pro-gram of individual genes by specifying the transcription factors (TFs) that regulate and determine the context-specific expression of a gene. In multicellular organisms, regulatory networks co-ordinate response to diverse extracellular signals and play a major role in the development and maintenance of living systems. These regulatory programs are often conserved across species, while their differences can form the foundation for morphological changes in animal body plans (Erwin and Davidson 2009). Therefore, regu-latory network inference efforts—both experimental and compu-tational—are critical to predicting cellular response and for un-derstanding the role of gene regulation in development, evolution, and disease.
Reconstructed regulatory networks can be broadly catego-rized intophysical regulatory networksandfunctional regulatory net-works. A physical regulatory network is one where edges represent a physical interaction between a TF and a target as detected in chromatin immunoprecipitation (ChIP) assays or predicted using sequence-based DNA binding models (regulatory motifs). The edges in such a network may not necessarily lead to functional changes in gene expression. In contrast, a functional regulatory network is one where edges between TFs and their targets are
supported by functional changes of downstream gene expression (Capaldi et al. 2008), even if these relationships may be indirect. The reconstruction of high-quality, genome-scale regulatory networks requires integration of both physical and functional evidence.
Substantial progress has been made in the assembly and analysis of regulatory networks in unicellular organisms such as
Escherichia coli and Saccharomyces cerevisiae. For example, Reg-ulonDB provides a literature-curated physical regulatory network forE. coli(Gama-Castro et al. 2008). Integration of the known regulatory interactions with coexpression data and sequence motif–inferred targets have enabled the reconstruction of genome-wide functional regulatory networks forE. coli(Ernst et al. 2008). In
S. cerevisiae, physical regulatory networks have been assembled using ChIP for 203 TFs (Harbison et al. 2004) and conserved reg-ulatory sites (MacIsaac et al. 2006), and a genome-wide compen-dium of physical, metabolic, genetic, and regulatory interactions has been generated using diverse functional data sets (Park et al. 2010).
The fruit flyDrosophila melanogasterprovides an ideal model organism for the inference and study of functional regulatory networks in multicellular organisms. First, >100 yr of genetic experiments have resulted in a rich body of literature about reg-ulatory relationships, which have resulted in small, but high-quality networks of known regulatory interactions such as REDfly (Halfon et al. 2008). Second, comparative sequencing of 12 Dro-sophilaspecies (Drosophila12 Genomes Consortium 2007; Stark et al. 2007) has provided a wealth of sequence information, which can be
7These authors contributed equally to this work. 8Corresponding author.
E-mail [email protected].
used to distinguish regulatory motif instances under purifying evolutionary selection that are thus more likely to be associated with functional edges (Kheradpour et al. 2007). Third,D. mela-nogasterhas been the target of several recent studies mapping the in vivo binding of TFs, providing genome-wide target regions for a growing number of TFs (Zeitlinger et al. 2007; Li et al. 2008, MacArthur et al. 2009; Zinzen et al. 2009). Fourth, the availability of genome-wide data sets measuring mRNA expression levels for all genes across the developmental stages inD. melanogaster en-ables the identification of functional relationships between TFs and their targets.
These rich data sets saw a further dramatic improvement with the launch of theDrosophilaModel Organism Encyclopedia Of DNA Elements (modENCODE) project (Celniker et al. 2009; The modENCODE Consortium et al. 2010). These include high-quality RNAseq time-course data sets measuring genome-wide transcriptional levels during development (Graveley et al. 2010), numerous histone modifications in two cell types (Kharchenko et al. 2011), as well as histone modifications and TF binding across the D. melanogaster developmental stages (Ne`gre et al. 2011). Together, the modENCODE project has assembled one of the most comprehensive collections of functional data sets for a single organism, which can greatly facilitate our ability to an-notate functional elements of an animal genome and understand its regulatory circuitry.
Here, we present a network-based approach for large-scale functional data integration to understand gene regulatory mech-anisms. We constructintegrative regulatory networks, which leverage both physical and functional data sets to identify regulatory re-lationships between TFs and target genes, and use these networks for gene function and gene expression prediction. For the network inference component, we develop a machine-learning framework for inferring regulatory edges between TFs and target genes using both physical and functional data sets as input features. We use both supervised and unsupervised inference approaches, the for-mer trained using the REDfly database (Halfon et al. 2008). We further introduce novel metrics to assess the biological relevance of inferred regulatory connections, based on known regulatory re-lationships, protein–protein interactions (PPIs), gene expression, tissue expression, gene ontology (GO) annotations, and Genome-Wide Chromosome Conformation Capture (Hi-C) contact maps showing three-dimensional contacts between chromosomal seg-ments (Sexton et al. 2012). We use these metrics both to assess the contribution of different types of data sets toward network in-ference and also to compare the overall quality of both integrative networks and single-feature input networks.
We also leverage the integrative networks to gain insights into the regulatory properties ofD. melanogaster. We characterize the topological properties of the resulting networks, evaluate their power for genome-wide prediction of candidate gene functions (GO process annotations), and study whether the expression levels of target genes can be predicted using linear combinations of the expression levels of their regulators, as dictated by the learned regulatory network. In contrast to previous methods for gene ex-pression prediction (Bonneau et al. 2007; Bussemaker et al. 2007; Chikina et al. 2009) and gene function prediction (Zhang et al. 2004; Macskassy and Provost 2005; Sharan et al. 2007; Costello et al. 2009), we take a two-step approach here, in which regulatory networks are first inferred by data integration, and then prediction parameters are learned using the learned network topology. This enables us to learn predictive models using many fewer data sets, once the network topology is fixed.
Our results provide several new insights into gene regulatory networks:
•
We find that the two types of evidence used in regulatory network inference are complementary: Physical information (TF binding, motif conservation) and functional information (coordinated ex-pression and chromatin patterns) show little overlap, while their combination captures known regulatory edges the most accurately.•
We find that while physical information (TF binding, motif conservation) is the most informative feature for network in-ference as benchmarked against the known REDfly network, it alone shows almost no functional enrichments or predictive power for gene expression levels.•
We develop a set of novel validation metrics that can be used to assess the quality of inferred regulatory networks, which go beyond assessment based on known interactions and GO en-richment typical of previous network validation work.•
We provide new functional annotations for hundreds of pre-viously unannotated genes, including several noteworthy ex-amples in nervous system development (NSD) that are independently confirmed by their tissue-specific expression patterns in neuronal precursor tissues.•
We find that a linear regression model of predicting target gene expression level from TF expression level can predict the ex-pression of;17% genes, and these ‘‘predictable’’ gene expres-sion patterns are also more reproducible between different experiments.•
We find that the genomic regions of distal coregulated genes tend to be colocalized in three-dimensional chromosome con-formation capture experiments, confirming that our regula-tory predictions also reveal functional colocalization of genomic segments.•
We make both regulatory networks and the functional pre-dictions available, together with source code for network in-ference and validation, to enable wider applicability of machine-learning methods in regulatory genomics.Overall, the framework introduced here is general and should be applicable in any species. While we demonstrate the in-tegrative approach to network reconstruction using theDrosophila
modENCODE data sets, our approach will be particularly relevant as the human ENCODE project moves from 1% coverage in its pilot phase (The ENCODE Project Consortium 2007) to genome-wide coverage (The ENCODE Project Consortium 2011), which should enable functional comparisons between flies, worms, and mammals.
Results
Integrative inference of regulatory networks
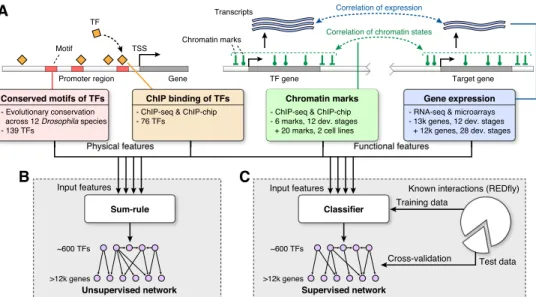
To reconstruct the integrative regulatory network ofD. melanogaster, we used a machine-learning framework to combine both func-tional and physical regulatory interactions (Fig. 1). The physical TF–DNA regulatory interactions consist of (1) evolutionarily con-served instances of TF binding site motifs across 12Drosophila
genomes (Kheradpour et al. 2007; Stark et al. 2007) for 139 TFs with known motifs, and (2) experimentally defined TF binding occupancy profiles from ChIP studies for 76 TFs (Zeitlinger et al. 2007; Li et al. 2008; MacArthur et al. 2009; Zinzen et al. 2009; Ne`gre et al. 2011). The functional data sets are summarized in Table 1 and consist of (1) profiles of chromatin modifications and
2
Genome Research
www.genome.org
general transcriptional regulators in two cell types and across the developmental time-course (Kharchenko et al. 2011; Ne`gre et al. 2011), and (2) gene expression profiles across the developmental time-course (Hooper et al. 2007; Ne`gre et al. 2011).
To enable integration across these diverse types of data, we represented each data set as a directed, weighted network, with edges from TFs to target genes and weights proportional to the strength of regulation evidence (see Methods). This resulted in six feature-specific networks, which form the basis for the integrative functional regulatory networks. The two physical feature-specific networks, referred to as themotif regulatory networkandbinding regulatory network, are based on evolutionarily conserved motif instances and TF occupancy data sets, respectively. The weights of the motif network come from the strength of the evolutionary conservation (Kheradpour et al. 2007). The binding network has binary weights, based on the presence of ChIP binding peaks. Both motif instances and ChIP binding peaks are restricted to a window of6500 bp around the transcription start site (TSS) of a target gene. The four functional feature-specific networks are based on two expression and two chromatin profile data sets (Table 1). Weights in the expression- and chromatin-based networks are given by the correlation between TF and target gene expression profiles and chromatin profiles, respectively (see Methods).
We used both an unsupervised and a supervised method to combine the six feature-specific physical and functional net-works to infer an integrative regulatory network (Fig. 1). We es-timated an edge ‘‘weight’’ for each possible TF-target pair, as a function of the six feature-specific weights provided by the in-put networks. For the unsupervised network, we used the average of all the input weights across the six networks (see Fig. 1B; Methods). This approach was chosen for its simplicity, as a base-line for comparison with the supervised network. For the super-vised network, we trained a logistic regression classifier based on known regulatory interactions from the REDfly database, version 2.2 (Halfon et al. 2008), using 10-fold cross-validation (see Fig. 1C; Methods). This resulted in two integrative networks, one supervised and one unsupervised, each showing high coverage and connecting ;600 TFs with over 12,000 target genes (Sup-plemental File 1).
Network overlap and recovery of known
regulatory interactions
To assess how informative individual feature-specific networks are for predicting regulatory edges between TFs and their target genes, we compared their edges with edges from REDfly. Each
Table 1. Number of genes, conditions, and type of measurements for expression and chromatin modification data sets
Data application Type Protocol Conditions No. of genes No. of conditions Reference
Network inference Gene expression RNA-seq Developmental time-course 13,567 11 Ne`gre et al. 2011 Network inference Gene expression Microarray Developmental time-course 11,990 28 Hooper et al. 2007 Network inference Histone marks ChIP-chip Developmental time-course 13,494 12 Ne`gre et al. 2011 Network inference Histone marks ChIP-chip Cell lines 13,494 2 Kharchenko et al. 2011 Validation Gene expression RNA-seq Developmental time-course 13,596 30 Graveley et al. 2010 Validation Gene expression RNA-seq Cell lines 13,596 4 Graveley et al. 2010 Validation Gene expression Microarray Cell lines 14,428 25 Cherbas et al. 2011
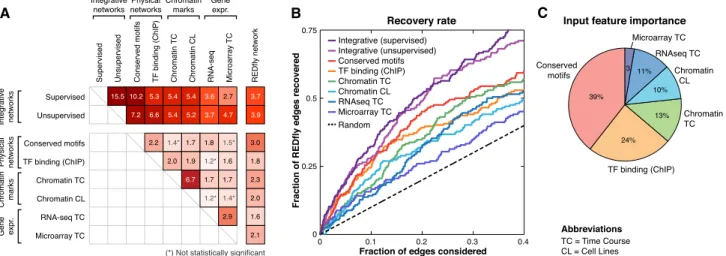
feature-specific network showed significant similarity to the REDfly network, with edges present in each network significantly more likely to also be present in the REDfly network than would be expected by chance (Fig. 2A, rightmost column). Among the feature-specific networks, the network based on evolutionarily conserved motif instances showed the strongest enrichment for REDfly edges (threefold enrichment). Note that the motif network is the only feature-specific network that integrates an evolutionary conservation score, which may explain its high enrichment: Evolutionary conservation is known to be a strong predictor of functional regulatory elements (MacIsaac et al. 2006; Kheradpour et al. 2007). The integrative networks that combine the evidence of all feature-specific networks, however, had the strongest enrichment for REDfly edges (supervised, 3.7-fold; un-supervised, 3.9-fold), demonstrating that integration of diverse features leads to higher recovery of true regulatory relationships. The recovery of REDfly edges by the different feature-specific networks (Fig. 2; Supplemental Fig. 1), as well as the weights assigned to these features by the supervised algorithm (Fig. 2C), show that the evolutionarily conserved motifs were the most informative, followed by TF binding (ChIP), chromatin marks, and expression data.
We next compared the feature-specific networks to each other and to the integrative networks (Fig. 2A). The integrative networks showed the strongest enrichment for the motif net-work, followed by the ChIP binding network and chromatin networks, suggesting that these are the strongest contributors. We found that feature-specific networks were more similar to the integrative networks than to other feature-specific networks, suggesting that our features are complementary and also that our integrative networks have captured their complementary prop-erties. The only exception was a strong pairwise enrichment between the two chromatin networks (6.7-fold vs. 5.2- and 5.4-fold
enrichment for the two integrative networks); a moderate enrich-ment was also found between the two expression data sets (2.9-fold), but this was still smaller than their average similarity to the integrative networks (3.7-fold). Remarkably, the motif-based, chromatin-based, and expression-based feature-specific networks also showed, on average, higher similarity to REDfly edges than to feature-specific networks of different types of evidence (i.e., between expression, chromatin, motifs, and binding), again em-phasizing the power of integrating diverse data types for re-covering true regulatory edges. The only exception was the TF binding–based networks that showed higher similarity to chro-matin networks, likely due to previously reported nonspecific TF binding in regions of accessible chromatin (The modENCODE Consortium et al. 2010).
We also assessed how varying the cutoff for predicting in-teractions in the feature-specific and integrative networks af-fected the recovery of edges in the REDfly network. We found that both integrative networks recovered a higher number of REDfly edges than any feature-specific network (Fig. 2B). For example, the top 100 predictions of our integrative networks recover 20 REDfly edges compared with less than four expected at random. In contrast, only five to 13 are recovered in the top 100 pre-dictions of the feature-specific networks.
In summary, the fact that the REDfly edges were among the highest-scoring predicted edges of the integrative networks con-firms both the importance of integration of different features for regulatory network inference and that our approach is able to do this successfully.
Functional enrichments of regulatory networks
In addition to the recovery of known regulatory relationships, we assessed the biological relevance of the physical and integrative
Figure 2. Comparison of known, predicted, and single-feature networks. (A) Pairwise network comparison based on the enrichment for common in-teractions among feature-specific networks (physical, chromatin, gene expression), the integrative networks (supervised and unsupervised), and the REDfly network. (Black) Enrichment values that are statistically significant (P<0.05, hypergeometric); (gray) enrichment values not statistically significant. Enrichment of each feature-specific network with REDfly tends to be stronger than its enrichment to other feature-specific networks of different types (between physical, chromatin, expression), suggesting that these features are capturing complementary sets of interactions. Integrative networks show the strongest enrichment for known edges. (B) Recovery of known REDfly edges at different thresholds for both integrative and feature-specific networks. (Curves) The fraction of the 204 REDfly edges recovered versus the fraction of predicted interactions considered (the expected number of edges recovered by chance [random; dashed line] iskP/T, wherekis the number of edges considered,Pis the number of REDfly edges, andTis the total number of possible edges). Integrative networks reach significantly higher recovery rates than single-feature networks, highlighting the importance of data integration. (C) Relative importance of the different input features in the supervised integrative network evaluated as the percentage contribution to the increase in scores of the top 10,000 edges (see Methods). Evolutionarily conserved motifs are the strongest contributor, followed by TF binding data (ChIP), chromatin marks, and expression data.
Marbach et al.
4
Genome Research
networks based on the tendency of genes targeted by similar TFs (coregulated targets) to exhibit similar functional properties. For each network, we measured the enrichment of coregulated genes in five independent data sets: (1) GO functional annotations, (2) tissue-specific gene expression patterns, (3) an independent ex-pression time-course that was not used for network inference, (4) PPI networks, and (5) contact maps of three-dimensional chro-mosome conformation. We also computed these measures for the REDfly network, both to validate our evaluation methodology and to compare the performance of our networks to the gold-standard, but much lower-coverage curated, network.
First, we evaluated whether pairs of genes targeted by com-mon regulators show similar GO annotations, reasoning that coregulated genes may participate in similar processes or have similar functions. We extracted pairs of target genes that share
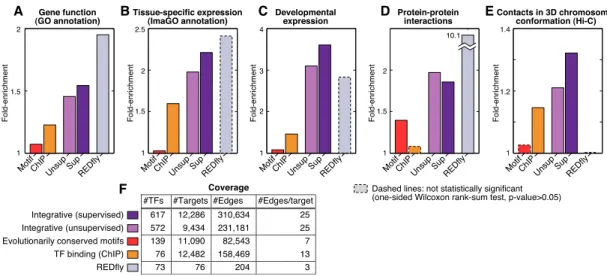
>50% of their regulators and computed enrichment for common GO terms (as well as correspondingP-values; see Methods). As expected, the REDfly network showed the highest fold enrichment for cotargeted genes to show similar GO terms (approximately twofold vs. randomized networks), which confirms the relevance of this metric (Fig. 3A). The two integrative networks were also significantly enriched (;1.5-fold), while including;10-fold more TFs and;100-fold more targets than REDfly. In contrast, the motif and binding networks show relatively lower enrichment (1.07- and 1.23-fold, respectively). These enrichments in the independent GO data sets support the functional relevance of the integrative networks.
Second, we reasoned that coregulated genes might be local-ized to similar tissues. To assess this, we used the Image Gene Ontology (ImaGO) of 145 distinct tissue terms (Tomancak et al. 2007), which describes the spatial pattern of gene expression based on in situ hybridization on whole-mount embryos. We computed the enrichment of ImaGO annotations among pairs of genes having>50% of their regulators in common (see Methods). Al-though the REDfly network reaches the highest fold enrichment (2.4-fold vs. randomized networks), it did not pass the significance
test due to its small size (Fig. 3B). The two integrative networks had similar, high enrichment (about twofold), while the motif and binding networks had none or weak enrichment, suggesting that our integrative networks are highly relevant for determining tis-sue-specific expression.
Third, we reasoned that coregulated genes may be more likely to be expressed at similar developmental stages. We computed the average coexpression level of genes with>50% common TFs across a 30-time-point RNA-seq developmental time-course (Graveley et al. 2010), which was not used as an input feature for the network construction. The strongest enrichment was again observed in the two integrative networks and REDfly (about threefold) (Fig. 3C), although for the small REDfly network the enrichment is not sta-tistically significant. In contrast, physical networks showed weak enrichment (<1.5-fold) that was not significant, confirming the relevance of our integrative networks for determining de-velopmental expression.
Fourth, we reasoned that physically interacting genes should tend to be coregulated, as has been previously observed in yeast (Yeger-Lotem et al. 2004). Thus, we evaluated the overrepre-sentation of PPIs for genes that are coregulated, using a set of high-confidence PPIs from the literature (Pacifico et al. 2006; see Methods). Indeed, the REDfly network showed strong enrichment for PPIs among coregulated genes (10-fold) (Fig. 3D). The two integrative networks were also significantly enriched (;1.9-fold), while the physical networks showed weak or no enrichment, again supporting the functional relevance of the inferred integrative networks.
Fifth, we evaluated whether the regulatory information cap-tured in our networks relates to three-dimensional chromosome organization in the nucleus. By using chromosome conformation capture followed by high-throughput sequencing (Hi-C), a recent study has produced high-resolution contact maps of fly embryonic chromosomes, revealing that chromosomes are organized hierar-chically in a functional manner (Sexton et al. 2012). We used the resulting data sets to evaluate whether the genomic regions of
distal coregulated genes are enriched for nuclear colocalization in the Hi-C contact map (see Methods). Indeed, we found that both the supervised and unsupervised integrative networks are signifi-cantly enriched for nuclear colocalization of coregulated genes (1.3- and 1.2-fold, respectively) (Fig 3E). In contrast, the motif network and binding networks show none or weak enrichment, and the REDfly did not contain any coregulated genes within colocalized regions.
Taken together, the observed enrichments in all five data sets considered strongly confirm the biological significance of the in-tegrative networks.
Structural properties of regulatory network
We next analyzed the structural properties of the integrative networks. We found that the number of targets for each TF (out-degree) exhibited a scale-free distribution expected for biological networks and similar to those previously observed in E. coli
(Bala´zsi et al. 2005) andS. cerevisiae(Supplemental Fig. 2; Guelzim et al. 2002; Stewart et al. 2009). There are large variations in the number of targets per TF, with some TFs targeting several thou-sand genes (e.g.,;6000 targets for Myb) and many others only few genes (Supplemental Files 3,4). The integrative networks also showed high clustering coefficients and small characteristic path lengths (Supplemental Fig. 3) characteristic of small-world net-works (Jeong et al. 2000; Ravasz and Baraba´si 2003; Potapov et al. 2005; Lancichinetti et al. 2010). The genome-scale nature of our regulatory network also enabled us to study the distribution of the number of TFs for each target, which is difficult in TF-centric approaches such as ChIP-seq and ChIP-chip, which analyze only a few TFs at a time. We found that the number of TFs for each target (in-degree) also obeyed a scale-free distribution consistent withE. coliandS. cerevisiae. Most genes are targeted by few reg-ulators (50% have#10 regulators), while a handful of genes are heavily targeted by hundreds of regulators (e.g., 180 regulators for predicted zinc-finger regulator CG15514). The heavily targeted genes are enriched in a range of GO biological processes related to gene regulation, including cell cycle, regulation of gene expres-sion, and regulation of metabolic processes (Supplemental File 5). This suggests regulatory feedback and signal integration, as the most heavily targeted genes are themselves regulators. Indeed, these networks were also enriched for feed-forward and feedback loops and other motifs suggesting extensive cooperation and combinatorial control (Supplemental Fig. 4B; Supplemental Note 1), as well as high interconnections with miRNAs (Supplemental Fig. 4A).
Prediction of candidate functions for genes lacking
functional annotations
As a demonstration of the utility of the regulatory information captured in the inferred networks, we sought to predict likely GO process terms for previously uncharacterized genes using a ‘‘guilt-by-association’’ approach (Macskassy and Provost 2005). In this approach, GO process categories of unannotated genes are pre-dicted based on the GO categories of other genes with similar functional properties. However, while previous approaches had only used expression evidence (Zhang et al. 2004), protein in-teraction networks (Sharan et al. 2007), or genetic inin-teractions (Costello et al. 2009), we combined regulatory information and expression information to leverage the ‘‘coregulation’’ infor-mation captured by our regulatory networks (see Methods).
To combine coexpression with coregulation, we first grouped genes into 34 similarly expressed clusters using a Gaussian mixture model, where each gene was probabilistically assigned to a cluster based on the similarity of its expression profile with the average expression profile of the cluster. We also defined a regulatory similarity score for every pair of genes based on the proportion of regulators that they have in common. We then computed a score for a given query gene to be a member of a GO process category, based on its regulatory similarity to all genes in that category, weighed by the probability of belonging to the same expression cluster as the query gene (see Methods).
We used this approach to predict candidate functions for genes with no previous GO process annotations, as well as addi-tional candidate annotations for genes that are already annotated with a GO process (Supplemental File 7). Only genes that are part of the integrative networks were considered. At any score cutoff, we estimated the false-discovery rate (FDR) of our predictions for a given GO process category (see Methods;Supplemental Fig. 5). At a FDR#0.2, using the unsupervised network, our approach dicts GO process annotations for 23% of the genes with no pre-vious annotation and additional annotations for 15% of genes with previous annotations. Our predictions include both general processes, such as oxidative phosphorylation and regulation of gene expression, as well as specific developmental processes, such as NSD and muscle structure development. Compared to using expression information alone, the combination of network in-formation and coexpression was able to predict more GO process terms, especially for low FDR (Supplemental Fig. 5), suggesting that combined evidence leads to improved predictive power.
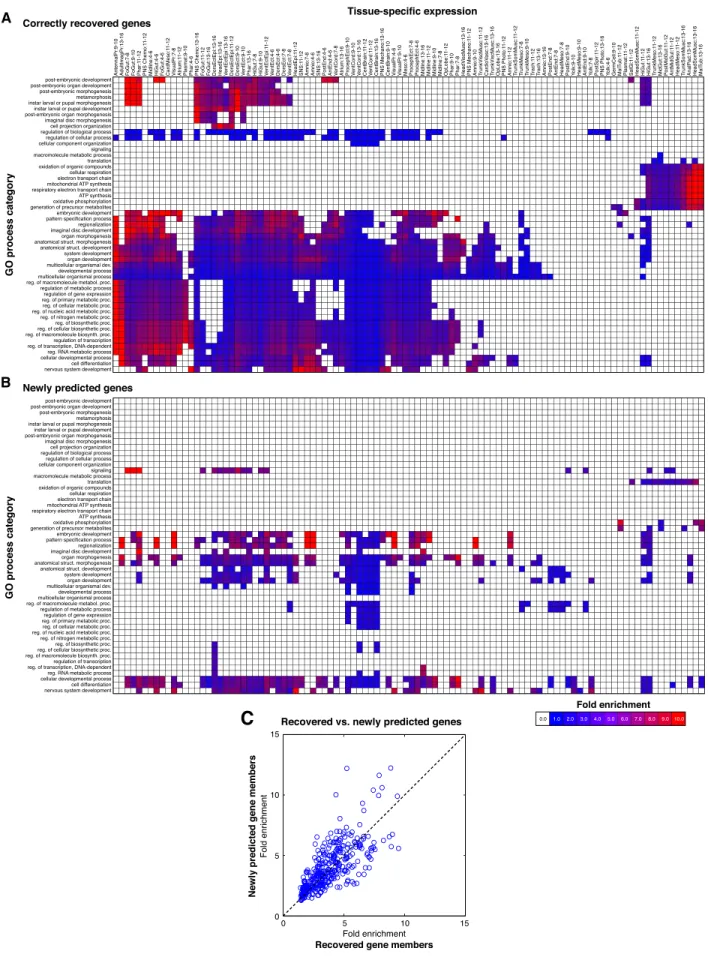
For example, we predicted a function in NSD for 101 genes, which included 42 recovered, known members (true positives) and 59 newly predicted members of NSD. The majority of these genes (80) belong to two main expression clusters (Fig. 4). The first cluster comprises genes that peak in expression at embryo 4–14 h and again in late larval and prepupal stages, as expected for NSD genes (Levine et al. 1995). The second expression cluster comprises genes that peak at the embryonic time points only. Moreover, according to their ImaGO annotation (Tomancak et al. 2007), the newly predicted NSD genes show tissue-specific expression in neural precursor tissues (e.g., central brain, ventral cord, and dor-sal, ventral, and procephalic ectoderm), similar to many known NSD genes, even though this information was not used to make the predictions (Fig. 4C). This suggests that many of the new pre-dictions, including 29 genes that lacked any previous functional annotation, are likely to function in NSD.
Inspired by the NSD enrichments for neural tissues, we sys-tematically compared the tissue-specific expression of newly pre-dicted versus the correctly recovered (known) gene members of a GO process category, as an additional validation of our pre-dictions. For every GO process term, we tested both the set of newly predicted and the set of recovered, known gene members for ImaGO tissue enrichments, which were not used to make the GO process predictions and thus provide an independent source of validation. Indeed, we found that the newly predicted gene members were generally enriched in similar tissues as the re-covered, known gene members of a given GO term (Fig. 5A,B), supporting the biological relevance of our predictions.
For the ImaGO tissues that were enriched in both the novel and the correctly recovered, known gene members of a given GO category, we further compared the fold-enrichment values in the two gene sets. As our method leverages regulatory similarity between unannotated and annotated genes to identify new
Marbach et al.
6
Genome Research
members of a functional category, we should expect that newly predicted members of a functional category are also more likely to be coregulated, and thus we should expect enrichments that are at least as high. In fact, we found that the ImaGO tissue en-richment for the newly predicted members was actually higher, on average, than the corresponding enrichment for the recovered, known members of the same GO term (Fig. 5C; Supplemental File 8). For example, genes newly predicted to function in the pattern specification process showed a 10-fold enrichment for midline tissues, whereas recovered members of this GO category only showed a 4.3-fold enrichment. These results not only confirm that the newly predicted GO process annotations are consistent with tissue-specific behavior of these genes, but they also demonstrate the power of our integrative regulatory networks for function prediction.
Predicting target gene expression level as a function of TF levels
Numerous studies have shown that multiple regulators can act together in additive and combinatorial ways to determine the ex-pression of a downstream target gene (Bussemaker et al. 2007). These studies have typically focused on a small number of high-confidence regulatory edges, which also are frequently coupled
with experimentally determined parameters for activation, re-pression, and cooperation. It is not clear however, how such studies can scale to genome-wide prediction of gene expression across thousands of genes.
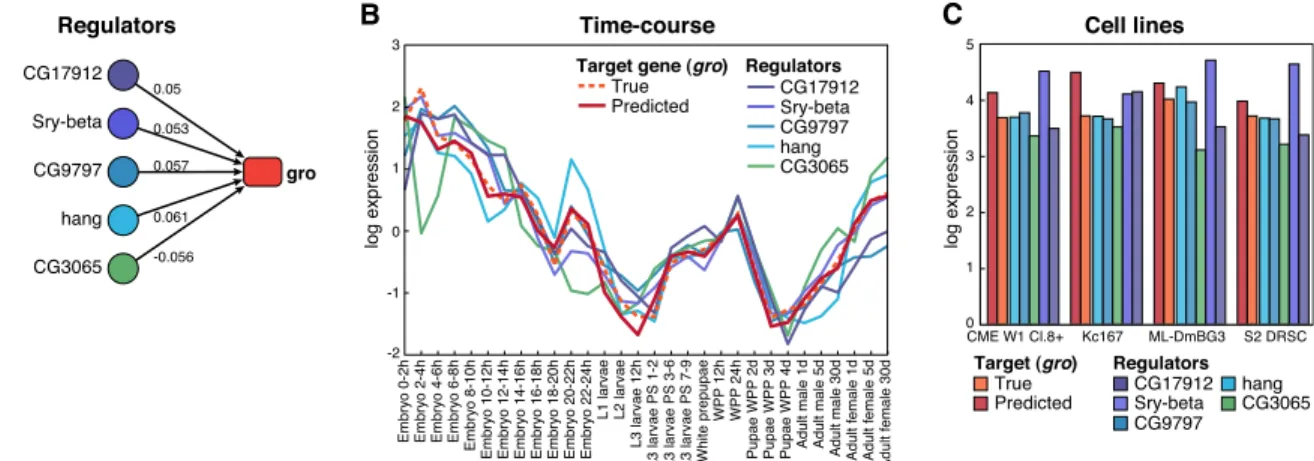
To address this question, we used regulatory relationships captured by the integrative regulatory networks to predict the ex-pression of each target gene as a function of the exex-pression of its predicted regulators. With no access to parameters for regulator activity or motif ‘‘grammars’’ dictating cooperation (Wilczynski and Furlong 2009), we used a simple regression model to predict the expression level of a target gene as a linear combination of the expression levels of its regulators (see Methods). We used expres-sion levels in a 30 time-point developmental time-course obtained using RNA-seq to learn the regression weights (Graveley et al. 2010), a data set that was specifically not used as an input feature to our network inference algorithm, and assessed predictive perfor-mance using 10-fold cross-validation. By use of this approach, we learned linear models for all target genes that are part of the in-tegrative regulatory networks and have measured expression in the developmental time-course. The learned weights represent an aggregate effect of trans-acting (Boulesteix and Strimmer 2005; Boorsma et al. 2008) and cis-acting effects (Raveh-Sadka et al. 2009), which would be difficult to explicitly model individually
because we do not measure these aspects of regulation. As a rep-resentative example, the regulatory model and expression pre-diction of thegrotarget gene are shown in Figure 6 (for additional examples, see Supplemental Fig. 6 ). We note that 30 time-points would have probably been insufficient to learn predictive ex-pression models de novo, but in this particular case, we have al-ready learned the topology of the network by data integration, and we are only using these 30 time-points to learn edge weight parameters.
To evaluate the predictive power of the integrative networks compared to other networks, we applied the same approach to predict expression using the feature-specific network based on ChIP binding, the feature-specific network based on conserved sequence motifs, and the REDfly network. For each considered network, we compared the average squared error across all genes to the squared error obtained using the same learning scheme on a randomized network (see Methods). For instance, of the 8433 target genes that were in the unsupervised network and had measured expression in the developmental time-course, expres-sion was predicted substantially better for 1988 genes and worse for 787 genes compared to a randomized network, corresponding to a 2.53-fold enrichment for higher accuracy (Supplemental Table 1). Similar results were obtained for the supervised in-tegrative network (2.03-fold enrichment). In contrast, the ChIP-based and motif-ChIP-based physical regulatory networks showed almost no enrichment compared with randomized networks (1.04- and 1.08-fold, respectively), even though they were two of the strongest informers of the integrative network, suggesting that they are informative but not predictive in isolation. Lastly, the REDfly network showed the strongest enrichment compared with random networks (3.9-fold enrichment), but due to its small size the expression of only 76 genes was predicted, emphasizing once more the importance of genome-wide network inference.
For each network, we defined a set of ‘‘predictable’’ genes for which expression prediction errors were consistently lower than random networks (six out of 10 random networks), and a set of ‘‘unpredictable’’ genes for which expression prediction errors were consistently higher in six out of 10 random networks. We found that the integrative networks showed more than 1000 predictable genes, for both the unsupervised network and the supervised
network, while the motif network had fewer than 200 predictable genes and the ChIP network actually showed an excess of un-predictable genes (Supplemental Table 1). These results were also supported by comparison of the squared error distributions be-tween the true and randomized networks, which were significantly different for the integrative networks (t-test,P<0.05), but not for the motif and ChIP networks (Supplemental Fig. 7). At a more stringent threshold of eight out of 10 for predictable genes, the supervised and unsupervised networks still show a fourfold en-richment over motif and ChIP networks (8% and 9% vs.<2% of predictable genes).
Last, we evaluated whether the coefficients learned in the developmental time-course were also relevant for target gene ex-pression prediction in independent conditions, which were not used in model learning and were not represented in any other expression data set. We used two hold-out data sets of four RNA-seq (Graveley et al. 2010) and 25 microarray (Cherbas et al. 2011) cell-line experiments. For each predictable gene, we used the model learned in the time-course experiment to predict its expression in the cell lines. We found that for the integrative networks, over 66% of predictable genes remained predictable in the RNA-seq cell line data sets compared with<52% for the ChIP and motif networks (Fig. 6C; Supplemental Table 1). Additionally, for the integrative networks, over 56% of predictable genes were also predictable in the 25 cell line data sets compared with<42% of unpredictable genes, suggesting that both the coefficients learned and the pre-dictability of genes were relevant in independent conditions.
It is possible that genes that were unpredictable with the linear regression model used here could be less tightly regulated. To test this we evaluated the reproducibility of expression patterns across the developmental time-course of predictable and un-predictable genes. For each set of genes, we quantified the cor-relation of gene expression patterns between the 30-time-point developmental expression data set (Graveley et al. 2010), and the 11-stage time-course data set sampled at longer time intervals (Ne`gre et al. 2011). We found that predictable genes showed a sig-nificantly higher correlation between the two data sets compared with the remaining genes (P-value<13107and 131039in the
unsupervised and supervised networks, respectively) (Supple-mental Fig. 8), suggesting that predictable genes are also more
reproducible. If we assume that more highly reproducible expres-sion corresponds to less noisy and perhaps more precisely regu-lated genes, this suggests that our inability to predict gene expression for some genes may be due to intrinsic variability in their expression levels.
Overall, our results demonstrate the potential of regulatory networks for gene expression prediction. While the simple linear model used here could only predict the expression of a subset of the genes, our results suggest that unpredictable genes may in fact be more noisy or less tightly controlled and that predictable genes remain predictable in new cellular conditions, suggesting that the coefficients learned for many of our genes are biologically relevant. While the results here are encouraging, building predictive models of gene regulation remains an enormously difficult problem. Continued advances will likely benefit from more complex models of gene regulation that potentially incorporate genome sequence in determining the weights and combinatorial relationships be-tween regulators in predicting the expression levels of downstream genes.
Discussion
In this article, we integrated diverse genome-wide data sets gen-erated by the modENCODE consortium using a machine-learning framework to reconstruct genome-wide regulatory networks for the model organismD. melanogaster, and investigated both su-pervised and unsusu-pervised learning paradigms. Our networks can recover many more edges in the curated REDfly network than can physical networks that rely solely on motif or ChIP data. Analysis of input feature importance to the integrative network quality showed that evolutionarily conserved motif instances were the strongest contributor, followed by TF binding and chromatin information, while coexpression information was the weakest contributor. Enrichment of cotargeted genes in common GO functional categories, common developmental and tissue expres-sion, PPIs, and chromosome conformation colocalization further confirmed the biological relevance of the predicted networks. The integrative networks showed comparable enrichments to the manually curated REDfly network for each of the four data sets where its enrichment could be evaluated, while including 10-fold more regulators (;600 vs. 73), 100-fold more targets (;10,000 vs. 76) and 1000-fold more edges (>200k vs. 204). Finally, we used the networks to infer GO process annotations for genes lacking a previous annotation and to predict expression levels of target genes as a function of the expression levels of their upstream regulators. In both prediction tasks, integrative networks strongly outperformed all feature-specific networks and the REDfly network.
Comparison with expression-based functional networks
Traditional network reconstruction approaches are unsupervised in nature where the goal is to infer the edges based on the observed expression of a node. While such approaches have been successful in inferring functional networks (Bonneau et al. 2007; Roy et al. 2009), their success in inferring regulatory networks has been hampered by the difficulty of distinguishing direct from indirect interactions from expression data. These indirect links can arise between cotargeted genes of the same TF or between a TF and a target separated by an intermediate TF (Marbach et al. 2010), as indirect links are likely to have a high score in coexpression driven inference. In contrast, in network inference driven entirely by TF
binding, indirect links are all automatically discarded in the ab-sence of physical evidence of binding. By combining expression information with experimental and computational evidence of TF binding (ChIP and motifs, respectively), integrative networks limit indirect links and recover known REDfly edges much more accu-rately than the purely expression-based networks.
Comparison with network inference based on sequence motifs
and ChIP binding
A canonical way to reconstruct a regulatory network is to identify instances of known TF motifs in the regulatory regions of genes (Kheradpour et al. 2007). The major difficulty with this approach is that we can infer edges only from well-characterized TFs that have a known binding site associated with them. A complementary approach is to perform ChIP assays for TFs of interest, followed by motif discovery on the bound regions of the genome. While these approaches can infer direct, physical edges, they also identify ‘‘nonfunctional’’ edges that do not result in changes in gene ex-pression (Li et al. 2008). In our setting, we had only 139 TFs with known motifs and 76 TFs with ChIP data, which constitutes about a sixth of the TF space we wanted to span. We leveraged motif and ChIP wherever possible, but we relied on expression and chro-matin data to complement the physical evidence. This has the advantage of inferring edges that are both physical and functional and resulted in a global map with similar functional enrichments to the hand-curated REDfly network, while having dramatically higher coverage for TFs, targets, and edges.
Comparison with other integrative approaches
Previous integrative methods for transcriptional network inference were mostly centered on expression-based approaches, either in-tegrating different types of expression data (Greenfield et al. 2010; Gupta et al. 2011) or using an additional data source as a fixed prior for expression-based inference (Bernard and Hartemink 2005). Supervised inference methods were used to integrate known in-teractions from curated databases as training data, but only used expression data as an input feature to predict interactions (Qian et al. 2003; Seok et al. 2010). A notable exception is the method of Ernst et al. (2008), which uses both sequence motifs and expres-sion data as input features. However, this method trains a local classifier for each individual TF and is thus not well suited for higher organisms, where little or no training data are available for the majority of TFs. In contrast, we trained a global classifier to predict regulatory interactions by integrating motif, binding, chromatin, and expression data as input features. Interestingly, our analysis showed that chromatin profiles were more informative than the commonly used expression profiles (Fig. 2C), suggesting that epigenomic data sets represent a hitherto underappreciated data source for functional network inference.
Comparing supervised and unsupervised learning
While there are many computational approaches to infer networks and to integrate data, it is not clear which particular method is useful for the task of regulatory network reconstruction by in-tegrating different data sets. Supervised learning approaches make efficient use of the available interactions, whereas unsupervised learning approaches are unbiased and applicable to organisms lacking sufficient training data. Here, we investigated both super-vised and unsupersuper-vised learning frameworks where each data
Marbach et al.
10
Genome Research
source served as an additional source of regulatory evidence for inferring an edge. Interestingly, we found that the unsupervised approach performed comparably on the REDfly network as did the supervised approach, which was specifically trained on REDfly. This competitiveness of the unsupervised strategy is likely due to the very limited number of known interactions used for training the supervised approach and shows that an unsupervised, in-tegrative network inference approach is a promising direction to pursue for inferring regulatory networks especially for organisms with little or no training data. It also emphasizes the need for continued validation of high-confidence interactions to enlarge the size of gold-standard networks that can be used for training computational methods.
Comparing input features
The value of data integration cannot be overemphasized for the task of regulatory network inference. We used our integrative framework to study the usefulness of different features for regu-latory network inference in the context of REDfly. While motifs were the strongest contributors to recovery of the known REDfly network, we found that chromatin profiles of TFs and their targets were also major contributors, enabling us to infer targets of TFs lacking motifs or ChIP information. Previous work has shown that networks derived from different types of data may be affected by different biases in inference (Marbach et al. 2012). Indeed, the feature-specific networks were complementary to each other, namely, those edges that could be predicted by one feature were not necessarily predictable by the other, further demonstrating the need to integrate complementary data sources. While some feature-specific biases may be inherited by integrative networks, for example, stemming from the selection of TFs that have been experimentally profiled or contain known regulatory motifs, the overlap of the different data sources helps reduce these potential biases and add more confidence to the inferred edges. Overall, integrating different types of data sets is critical for reconstructing a reliable picture of the regulatory network, especially for multi-cellular organisms, which have multiple layers of regulation, and where physical edges are less directly linked to functional edges.
The role of network topology
We found that the integrativeDrosophilanetworks exhibit scale-free degree distributions, high clustering coefficients, short average path lengths, and enrichment for feedback and feed-forward loops. These structural properties have been previously identified in regulatory networks of unicellular organisms such asE. coliandS. cerevisiae, where they have been linked to systems-level properties such as robustness and adaptability (Alon 2007; Tsang et al. 2007). The integrative networks presented here will enable an exploration of the potential role in network dynamics and evolution of such structural properties inDrosophila.
Prediction of gene functions and expression levels
The ultimate test for a regulatory network is the ability to predict attributes of nodes using the network connectivity patterns. Our results demonstrate that integrative regulatory networks can be used to predict biological process annotations and expression levels of target genes. On one hand, integrative networks enable accurate prediction of novel functional annotations for genes based on their ‘‘regulatory neighborhood,’’ resulting in candidate
functional annotations for ;700 previously uncharacterized genes. On the other hand, we leveraged the integrative networks for gene expression prediction, by learning a linear regression model for the expression levels of every target gene based on its set of predicted regulators, demonstrating significantly more accurate predictions than ChIP or motif-based networks. These results demonstrate that integrative networks define ‘‘functional regula-tors’’ relevant in both function and expression prediction. We found that a linear regression function was predictive for;20% of target genes, but we expect that higher-order and combinatorial functions may be prevalent, although they were not tested here. While numerous alternative methods exist to predict gene func-tion (Zhang et al. 2004; Macskassy and Provost 2005; Sharan et al. 2007; Costello et al. 2009) and expression (Bonneau et al. 2007; Bussemaker et al. 2007; Chikina et al. 2009), our goal was to evaluate the predictive power of integrative networks, not to ex-plore the space of possible regulatory functions, which merits further investigation. More complex models of gene regulation (e.g., Boulesteix and Strimmer 2005) may further improve the predictive power of these integrative networks but may require significantly richer training data sets given their increased dimensionality.
Nuclear colocalization of coregulated genes
Our results also have strong implications for the functional hier-archical organization of chromosomes within Drosophilanuclei recently revealed using Hi-C chromosome conformation capture (Sexton et al. 2012). Sexton et al. (2012) reported highly specific chromosomal colocalization hotspots, where the three-dimensional chromosome conformation brings together distal regions driven by functional relationships rather than genomic proximity. The reported hotspots include colocalization of both active and re-pressed domains and several examples of distal functionally related genes. Our integrative regulatory networks show signif-icantly stronger agreement than motif or ChIP networks, sug-gesting a global association between colocalization and co-regulation, which was eluded to in the Sexton et al. (2012) study but not shown for more than a handful of examples. Our results indeed confirm that this is the case, supporting the hypothesis that nuclear colocalization is involved in coregulation.
Overall, our integrative regulatory networks provide an initial summary view of the regulatory interactions of a multicellular organism, which are undoubtedly more complex than what we have captured here. These networks are likely tissue-specific, stage-specific, and modulated by complex environmental interactions. As genome-wide data sets that capture this additional complexity become available by probing chromatin, TF binding and expres-sion levels from specific tissues and in diverse conditions, we ex-pect that the general network inference techniques presented here will continue to provide useful abstractions and help gain new insights into general principles of eukaryotic and animal gene regulation.
Methods
Input data sets
binding motifs collected from the literature (Kheradpour et al. 2007). Due to the short length of motifs, many instances of motifs in a single genome are expected to be coincidental matches that may not be bound in vivo or have no functional regulatory effect. As evolutionary conservation of an instance is an indication of a functional instance, Kheradpour et al. (2007) used a robust phylogenetic framework that accounts for the evolutionary relationships across 12 sequencedDrosophila spe-cies to assign a conservation score to each motif instance mea-sured as 1-FDR and referred to as confidence.
Our second input data set consisted of a compendium of ge-nome-wide TF binding data sets obtained from ChIP-chip and ChIP-seq assays from the modENCODE project and from 14 pre-viously published studies used by the modENCODE Consortium et al. (2010). In total, these data sets include 76 TFs in a range of tissue and cell-line samples.
Our third input data set consisted of genome-wide location data for chromatin marks and chromatin remodeling factors, which was generated by the modENCODE project using ChIP-chip and ChIP-seq. Chromatin profiles were included for six modifica-tions in a developmental time-course of 12 stages (Ne`gre et al. 2011) and for up to 20 modifications in two cell lines (Kharchenko et al. 2011).
Our fourth data set comprised gene expression profiles gen-erated by RNA-seq and DNA microarrays. The RNA-seq data set consists of a developmental time-course across 11 developmental stages (Ne`gre et al. 2011). The microarray data sets consists of a developmental time-course of 28 stages (Hooper et al. 2007).
These data sets cover a total of 14,444 genes, out of which 707 were considered to be potential TFs. This set of potential regulators was predicted using InterProScan (Zdobnov and Apweiler 2001) to search for the presence of DNA binding domains assembled from published TF annotation efforts (Reece-Hoyes et al. 2005; Kummerfeld and Teichmann 2006) and further refined using lit-erature curation (SE Celniker, pers. comm.).
Constructing feature-specific networks
We derived feature-specific networks from each input data set by assigning a weight to each TF-target gene pair. The weights range from 0 to 1, where 0 denotes absence of interaction. If a data set had missing values for a TF-target gene pair; the default value of 0.1 was assigned to this interaction. We derived two physical and four functional (two coexpression and two co-chromatin modification) feature-specific networks from our input data sets. Edges in these feature-specific networks have different implica-tions: In the physical networks, edges describe binding of TFs, whereas in the functional networks, edges indicate a functional, possibly indirect, relationship derived from correlated patterns of activity between TFs and their targets.
The two physical networks, motif regulatory network and
binding regulatory network, are based on the evolutionarily con-served motif instances and the TF binding data sets, respectively. In these two networks, interactions were added if conserved motifs, or ChIP binding of TFs occurred near the TSS of a target gene (in an interval of 500 bp upstream of or downstream from the TSS, using FlyBase 5.12 genome annotation). Weights in the motif regulatory network are defined by the motif conservation score according to the method described by Kheradpour et al. (2007), which ranges from 0.0 (unconserved motif instance) to 0.9 (strongly conserved motif instance). We increased this score by 0.1 and assigned the value of 0.0 in the case where no motif instance was present (absence of interaction). If a gene had sev-eral motif instances of the same TF, we selected the maximum conservation score of these instances. Weights in the binding
regulatory network are binary and were set to 0.05 if there was no ChIP binding peak and to 0.95 if there was at least one ChIP binding peak overlapping with the 1-kb window of the target.
The four functional networks include twocoexpression net-worksand twocomodification networks, based on the two expression and two chromatin mark data sets (Table 1). In the coexpression networks, the weights of the interactions are given by the squared Spearman’s correlation of the TF and target gene expression pro-files. In the comodification networks, weights are given by the squared Spearman’s correlation of the corresponding chromatin profiles (Fig. 1A). Chromatin modifications are commensurate with transcriptional activity (Ernst and Kellis 2010), and analo-gous to correlations in expression profiles, correlations in chro-matin profiles may thus be used to infer functional relationships between TFs and target genes. Chromatin profiles were defined based on the presence of different chromatin modifications (marks) in five regions for every gene: upstream of TSS, 59UTR, coding sequence, 39UTR, and downstream transcription end site (Supplemental Fig. 9).
Unsupervised network inference
The unsupervised method uses a sum rule to compute a weight for each edge, which is the average weight of that edge across the six feature specific networks (Fig. 1B). Out of the;10 M possible in-teractions (707 TFs3 14,444 genes), only the top 2% highest confidence edges were selected to constitute the network from the unsupervised method, which corresponds to a similar number of edges as obtained using the supervised method.
Supervised network inference
The supervised network inference method is based on a logistic regression-based binary classifier, where the class label represents the presence or absence of an edge. The logistic regressor is a gen-eralized linear model that predicts the probability of a class variable by combining the input features within a logistic function (Mitchell 1997). For our problem of network inference, the logistic regressor gives the probabilitywijof an edge between a TF and
a target:
woutputij = 1
1+emij; with
mij=amotifwmotifij +aChIPwijChIP+achromTCwchromTCij +achromCLwchromCLij +aRNAseqwRNAseq
ij +aarrayw array ij
8 <
: ;
ð1Þ
where the input features for the classifier are the weights of that edge in the six feature-specific networks.
The training set was obtained from the REDfly network. The REDfly network has 204 edges, connecting 73 TFs with 76 targets. Thus, the training set consists of 5,548 (73376) TF–target gene pairs, out of which 204 are positives (true interactions). The remaining pairs are considered to benegatives (absent in-teractions).
Learning was performed using 10-fold cross-validation. A challenge in supervised network inference is that the number of negatives and positives is typically not balanced in the training data (there are many more absent than present edges) (Qian et al. 2003). We addressed class imbalance in two ways. First, we used
stratifiedcross-validation, which assures that the ratio of positives to negatives is approximately the same in each fold. Second, we weighted the positive instances in the training set, such that the total weight ofpositivesandnegativesis balanced. Specifically, we fixed the weight ofnegativesat 1 and the weight ofpositivesat
N/P, whereNis the total number ofnegativesandPthe number
Marbach et al.
12
Genome Research
of positives in the training data. This is equivalent to over-sampling the positives, which is a common approach to balance a learning set (Estabrooks et al. 2004). It forces the classifier to better fit the positive class than the negative class, which is a desirable feature, becausenegativesmay correspond to true interactions that are yet uncharacterized and missing in REDfly. For the final model used to predict the complete set of in-teractions (beyond REDfly TFs and genes), we used the average weights obtained over 1000 iterations of 10-fold cross valida-tion. Learning was performed using the Weka library (http:// weka.sourceforge.net). We included all TF–target pairs that are predicted to interact with a probability of 0.6 or higher in the supervised integrative network (;300,000 edges).
Network overlap
Enrichment of common interactions between feature-specific networks and the REDfly network (Fig. 2A) was computed as follows. TFs and genes that are not part of REDfly were removed from the feature-specific networks, and only the 10% highest weight interactions were considered present. Enrichment be-tween two networks was defined as the number of interactions that are present in both networks divided by the number of such interactions expected by chance. The number of common in-teractions expected by chance is given by the mean of the hypergeometric distribution:N13N2/T, whereN1andN2are the
number of interactions in the two networks, andTis the total number of possible interactions. Statistical significance of the observed number of overlapping edges was evaluated at a level of 0.05, using the hypergeometric distribution.
Relative importance of input features
The relative contribution of each input feature for the supervised integrative network (Fig. 2C) was evaluated as the percentage contribution to the increase in scores of the top 10,000 edges as follows: (1) we computed the meanmallover the scoresmij(see
Equation 1) of the complete list of all possible edges; (2) we com-puted the meanmtopover the scores of the top 10,000 edges (i.e.,
the 10,000 highest scores); (3) we computed the difference be-tween the top edges and the complete set of edgesd=mtop–mall;
and (4) we determined the percentage that each input feature contributed to the differenced. For instance, the scoresmijhad an
increased value of d=2.58 for the top 10,000 edges, and the term corresponding to the conserved motifs (amotifwijmotif;Equation 1)
had an increased value ofdmotif=1.08 for these same edges, thus
accounting for 1.08/2.58=42% of the differencedthat separates the top 10,000 edges from the remaining edges. The relative con-tribution of each input feature for theunsupervised integrative network was computed analogously (Supplemental Fig. 10).
Functional enrichment of regulatory networks
GO annotations
For each network, we computed the enrichment of coregulated genes for common GO annotations. We considered a gene pair to be coregulated in the given network if the two genes had
>50% of their regulators in common. More formally, we com-puted the Jaccard similarity coefficient between the set of reg-ulators of the first gene and the set of regreg-ulators of the second gene (the Jaccard coefficient is defined as the size of the in-tersection divided by the size of the union of two sets). We considered gene pairs with a Jaccard coefficient>0.5 to be co-regulated. For each coregulated gene pair, we then measured the
similarity of the set of GO annotations of the first gene and the set of GO annotations of the second gene, again using the Jaccard coefficient. Finally, we took the average of this coefficient over all coregulated gene pairs. The same procedure was done for 100 randomized versions of the network, and enrichment was com-puted as the ratio of the average coefficient of the original net-work to the average of the randomized netnet-works. Randomization was done by permuting the labels of all TFs and permuting the labels of all genes. In other words, the network structure remained identical and only the labels of the nodes were changed. This assures that the observed enrichment is not due to potential bias arising from structural properties of the network. Statistical sig-nificance was assessed at a level of 0.05 using a one-sided Wil-coxon rank-sum test to compare the Jaccard coefficients from the original network with those from the randomized networks (Bonferroni correction was used to account for multiple testing).
ImaGO annotations
The ImaGO database annotates genes with terms describing their spatial localization patterns in tissues (Tomancak et al. 2007). We computed enrichment of coregulated genes for common ImaGO annotations using the same approach as described above for the GO annotations.
Gene expression in the developmental time-course
Enrichment of coregulated genes for coexpression in the devel-opmental time-course (Graveley et al. 2010) was computed anal-ogously to the GO and ImaGO annotations described above. First, coregulated gene pairs were identified as described. For each co-regulated gene pair, we then computed the squared Spearman correlation of the two gene expression profiles. Enrichment com-pared to randomized networks was evaluated as described.
Protein–protein interactions
We considered a set of high-quality PPIs from the literature (Pacifico et al. 2006), where high-throughput yeast two-hybrid data were excluded. Enrichment of coregulated genes for PPIs was computed analogously to enrichment for coexpression and co-annotation. Specifically, we compared the number of PPIs for coregulated gene pairs to the average number of such PPIs in ran-domized networks, using the same definition for coregulation and network randomization.
Chromosome conformation colocalization
We evaluated enrichment of coregulated genes for three-dimensional chromosome conformation colocalization using a high-confidence set of intrachromosomal colocalization hotspots identified by Sexton et al. (2012). Colocalization hotspots were defined as pairs of distal chromosomal regions with at least 2.8-fold (log2>1.5)
enrichment in contact intensity over a background model ac-counting for genomic distance and hierarchical domain folding (Sexton et al. 2012). We derived a gene colocalization network by drawing a weighted edge between every pair of genes that are part of two chromosomal regions identified as a colocalization hot-spot. Edge weights were defined as the log2enrichment in contact