Life Satisfaction in Latin America
Rebecca Weitz-Shapiro
Matthew S.Winters
ABSTRACT
What is the relationship between voting and individual life satisfac-tion in Latin America? While studies of Western Europe suggest that voters are happier than nonvoters, this relationship has not been explored in the younger democracies of the developing world, including those of Latin America. Using multilevel regression models to examine individual-level survey data, this study shows a positive correlation between voting and happiness in the region, noting, however, that the relationship is attenuated in those coun-tries that have enforced compulsory voting. We then explore the causal direction of this relationship: while the existing literature points to voting as a possible determinant of individual happiness, it is also possible that happier individuals are more likely to vote. Three different strategies are used to disentangle this relationship. On balance, the evidence suggests that individual happiness is more likely to be a cause rather than an effect of voting in Latin America.
W
hat is the relationship between political participation and indi-vidual happiness? At first glance, the study of indiindi-vidual satisfac-tion may seem outside the realm of political science.1However, as manyobservers have emphasized, happiness is among the most fundamental characteristics of human life and may arguably be the “ultimate” dependent variable in social science (Helliwell and Putnam 2004, 1435). To the extent that political participation may have a measurable effect on happiness—or, as we also explore in this article, may be a conse-quence of happiness—a study of this relationship actually touches on some of the core concerns of political scientists: what are the causes and consequences of individual political participation?
A growing literature on the political correlates of individual happi-ness reflects the importance of such questions. Drawing mostly on large cross-national surveys from Western Europe, researchers have convinc-ingly established connections between life satisfaction and a range of political acts and conditions. There is evidence that individuals who live in countries that are well governed or democratic or where political freedoms are widespread are happier than those who live elsewhere (Haller and Hadler 2006; Helliwell and Huang 2008; Veenhoven 1995).
In addition, average happiness is lower under corrupt, as opposed to clean, regimes (Tavits 2008). At the individual level, people are happier when the party they support ideologically or voted for in the previous election is in power or forms part of the government (Di Tella and Mac-Culloch 2006; Tavits 2008).
The largest single body of work on politics and happiness has focused on political participation. In a series of papers that exploit the particularities of the Swiss political system, Bruno Frey and his col-leagues find that political participation is strongly positively correlated with self-perceived well-being.2 In a literature known for its inductive,
empirically focused approach, this work is unique for its strong theo-retical component and its argument that political participation can be identified as a cause, not just a correlate, of individual life satisfaction. This article brings the study of participation and happiness to Latin America and carries out the first large-scale empirical analysis of this relationship in the region.3 All of the countries examined here are
democracies, but they have a much shorter democratic tradition than the Western European countries on which this literature’s findings are based. This study therefore allows us to test whether the positive cor-relation between political participation and happiness holds in a part of the world where the act of voting may have different psychological causes and consequences than in Western Europe. On the one hand, we might expect the act of voting to have deep resonance in Latin Amer-ica, where a number of countries have histories of repressive authori-tarian states that limited individual expression and political participation. On the other hand, the pervasiveness of clientelism and vote buying and the low prestige of parties and practices like delegative democracy (O’Donnell 1994) might attenuate either the desire of happier individu-als to participate politically or the positive consequences of participa-tion. Furthermore, Latin America has a higher number of countries with compulsory voting than any other region in the world, thereby afford-ing the opportunity to examine how obligatory votafford-ing may affect the relationship between participation and life satisfaction.
Using data from 18 AmericasBarometer country surveys carried out by the Latin American Public Opinion Project (LAPOP), we find a posi-tive association between voting and life satisfaction. In Latin America, as in Western Europe, voters tend to be happier people. This relationship is weaker in countries with enforced compulsory voting.
In contrast with existing findings from Europe, we do not find any evidence that the act of voting actually increases happiness among Latin American voters. To assess the direction of causality in this relationship, we employ three empirical strategies. We take advantage of a voting dis-continuity due to age restrictions, make use of a two-stage least squares model to address problems of endogeneity, and analyze a set of unique survey questions that ask nonvoters their reasons for not participating. The results of all these analyses suggest that voting has no independent causal effect on individual well-being in Latin America, implying that the association between voting and happiness is due to the fact that hap-pier people are more likely to have voted. Before presenting these results, we first review the theoretical rationale behind the competing causal stories and existing empirical evidence on the topic.
POLITICAL
PARTICIPATION AND
SUBJECTIVE
WELL-BEING
Most of the literature on life satisfaction views individual happiness as the outcome of other individual or group-level characteristics, activities, or actions. In some cases, this emphasis on happiness as a dependent variable is inevitable; characteristics like gender and age certainly pre-cede life satisfaction, and happiness cannot be treated as a cause of these characteristics. Even when other variables of interest, such as mar-riage or civic participation, do not necessarily precede life satisfaction, scholars’ interest in explaining happiness often leads to the use of causal language that suggests that happiness follows from these other charac-teristics, rather than anticipates them.4
Regarding the link between political participation and individual happiness, there are some clear reasons to believe that participation might actually increase happiness.5Political theorists long have stressed
and competent in their lives.6 To the extent that political participation
creates these feelings, it should create procedural utility and thereby increase individual life satisfaction.
Although it may be that political participation has an independent causal effect on happiness, there are also reasons to suspect that life sat-isfaction might affect the decision to participate in politics. All else equal, a person who is satisfied with his or her life might be more likely to vote than his or her counterpart who is not. Psychologists have noted that being happy makes one more outward looking—more likely to engage with the world and to seek out new challenges and experiences. In other words, happiness encourages “active involvement with goal pursuits and with the environment” (Lyubomirsky et al. 2005, 804). To the extent that this is true, we should expect individuals who enjoy greater life satisfaction to be more engaged with, and hence more likely to participate in, their political surroundings, as well.7Veenhoven (1988)
and Klandermans (1989), for instance, argue that happiness can have a causal effect on acts of political participation, including voting and protest participation.
Empirical studies that examine the links between political participa-tion and life satisfacparticipa-tion and happiness have heretofore focused on established democracies in the developed world and have relied on a mix of individual-level and aggregate data. Country-level studies on happiness commonly include measures of each country’s political liber-ties or level of democracy. These variables capture the opportuniliber-ties for participation and may serve as proxies for actual participation. These studies indeed find some evidence that citizens living in regimes that afford them greater political freedoms are, on average, happier than their counterparts elsewhere (Veenhoven 1995; Schyns 1998; Inglehart 2000; see also Radcliff 2001). Although these aggregate studies appear consistent with expectations of a positive link between participation and happiness, using them to make claims about effects at the individual level raises an ecological inference problem. Greater average happiness in contexts with ample opportunities for participation does not mean that in a given country, individuals who participate are more satisfied with their lives than nonparticipants.
oppor-tunity for participation, rather than examining the consequences of the actual act of participation. Dorn et al. (2008) add more controls to the Frey and Stutzer regressions, at which point the opportunity for partici-pation is no longer a significant predictor of happiness.
Also drawing on individual-level survey data from Europe, work by Margit Tavits (2008) looks at country-level political characteristics and individual-level participatory patterns in a multilevel regression frame-work. She finds a negative and significant relationship between coun-try-level corruption and subjective well-being.8Although her main focus
is on country-level corruption and individual vote choice, Tavits—in results that resemble our own—also finds that voters are happier than nonvoters, regardless of whether the vote was cast for the winner or the loser (2008, 1619–20). She highlights the difficulty of establishing the causal direction of this relationship.
The empirical analysis that follows first examines the relationship between individual participation and happiness and finds that they are indeed positively correlated in Latin America. Although not definitive, these attempts to establish the direction of causality of this relationship suggest that the act of voting does not increase an individual’s life sat-isfaction. Instead, this analysis is more consistent with the interpretation that happier people are more likely to turn out to vote.
EMPIRICAL
STRATEGY AND
RESULTS
The empirical results that follow reflect, as far as we are aware, the first attempt to examine the relationship between participation and happi-ness in a large sample of countries outside of the advanced industrial economies. We draw on data from LAPOP’s AmericasBarometer survey conducted in 18 countries in early 2008.9Although we acknowledge that
voting might cause happiness or that happiness might cause voting, we begin our analysis using voting as our key explanatory variable.10
Sub-jective well-being—that is, individual happiness—is our outcome vari-able.11 We choose this set-up because our measure of political
partici-pation is temporally prior to our measure of happiness: respondents were asked whether they voted in the last presidential election before the survey and then about their satisfaction with life at the time of the survey. This approach is also consistent with most existing empirical work on political participation and happiness, which treats participation as a cause of happiness.
Initial Evidence of a Link Between Voting and Happiness
estimate varying-intercept models that allow us to account for baseline variation in average happiness levels across countries. Multilevel models allow us simultaneously to estimate coefficients for country-level vari-ables and country-specific intercepts, using the former to predict the latter.12 We also employ varying-slope models, which, in addition to
allowing the intercepts to vary by country, permit us to examine whether the main relationship of interest—that between voting and hap-piness—varies significantly across countries (see Steenbergen and Jones 2002; Gelman and Hill 2006).
The most general version of our estimating equations is
Happinessi[j]= j+ *control variablesi+ j *votei+ i
j= 0 + 1*country-level variables1j+ j j= 0 + 1*country-level variables2j+ j
where individual i lives in country j; j is a country-specific intercept that is a function of country-level variables and is estimated with nor-mally distributed error j; is a vector of standard coefficients; j is a country-specific coefficient on voting that is a function of country-level variables and is estimated with normally distributed error j; and iis a normally distributed individual-level disturbance term. Since the vari-ables included in the country-level equations for the intercept and slope need not be the same, we have indexed these vectors by the subscripts 1 and 2. In the model with only varying intercepts, j = for all j.
The outcome variable is measured on a four-point scale with the highest value indicating that the respondent is “very satisfied” with his or her life and the lowest value indicating that the respondent is “very unsatisfied” with his or her life. The individual-level control variables follow from the existing literature and include measures of age, educa-tion, income and financial security (i.e., wealth), and indicator variables that take on the value of 1 when a respondent is married, has children, or considers himself or herself a member of a nonwhite or nonmestizo ethnic group.13 Previous research has found positive relationships
between happiness and education, marital status, income, and wealth; a negative relationship between having children and being happy; and a negative but U-shaped relationship between happiness and age.
lit-erature has found significant relationships between these country char-acteristics and average national happiness.15
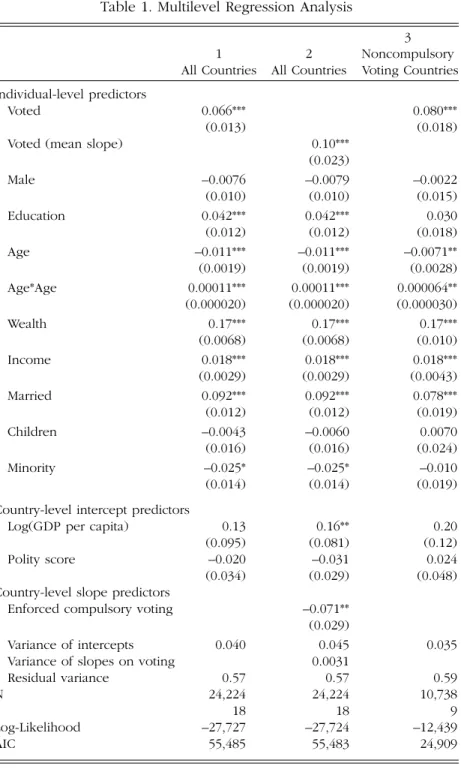
Column 1 of table 1 reports the results from the varying-intercept model. The coefficients on the individual-level control variables are con-sistent with those found in the existing empirical literature. Married people and wealthier individuals express higher levels of subjective well-being. Age exhibits a curvilinear relationship with life satisfaction: the negative association between age and happiness increases in mag-nitude until about age 51, at which point the trend reverses.16 With
respect to the varying intercepts, neither GDP per capita nor the level of democracy is a significant predictor of the country-level intercepts; only GDP per capita is signed in the expected direction.17
Our main interest is in the sign and direction of the coefficient on voting. The regression reveals a positive relationship: individuals who say that they voted in the last presidential election on average report being about 0.065 points more satisfied with their lives than their oth-erwise similar counterparts. In terms of substantive significance, this coefficient is two-thirds the size of that associated with being married, a characteristic consistently highlighted as an important determinant of happiness in the literature (and also a 0–1 variable). The coefficient is also three-and-a-half times as large as that for income. This suggests that, all else equal, the difference in life satisfaction between a voter and a nonvoter is the same as that between individuals who are otherwise similar but three-and-a-half categories apart on the 11-unit income scale. These comparisons suggest that the relationship between voting behav-ior and individual life satisfaction in Latin America is substantively sig-nificant as well.18
To examine cross-country variation in the relationship between voting and happiness, we use a varying-slope model. Like the previous model, this model estimates a separate intercept for each country in the dataset. In addition, the model allows us to estimate a separate slope on the variable “voted” for each country. We examine whether the exis-tence of enforced compulsory voting in a country can help predict these varying slopes. Enforced compulsory voting exists in 9 of the 18 coun-tries in the dataset.19
We might expect compulsory voting to weaken any relationship between voting and happiness, for at least two reasons. First, consider-ing the possible effects of votconsider-ing on happiness, votconsider-ing is less likely to increase an individual’s sense of autonomy and hence less likely to create procedural utility in countries where all citizens are compelled to vote.20Second, examining the possible effect of individual life
Table 1. Multilevel Regression Analysis
3
1 2 Noncompulsory
All Countries All Countries Voting Countries
Individual-level predictors
Voted 0.066*** 0.080***
(0.013) (0.018)
Voted (mean slope) 0.10***
(0.023)
Male –0.0076 –0.0079 –0.0022
(0.010) (0.010) (0.015)
Education 0.042*** 0.042*** 0.030
(0.012) (0.012) (0.018)
Age –0.011*** –0.011*** –0.0071**
(0.0019) (0.0019) (0.0028)
Age*Age 0.00011*** 0.00011*** 0.000064**
(0.000020) (0.000020) (0.000030)
Wealth 0.17*** 0.17*** 0.17***
(0.0068) (0.0068) (0.010)
Income 0.018*** 0.018*** 0.018***
(0.0029) (0.0029) (0.0043)
Married 0.092*** 0.092*** 0.078***
(0.012) (0.012) (0.019)
Children –0.0043 –0.0060 0.0070
(0.016) (0.016) (0.024)
Minority –0.025* –0.025* –0.010
(0.014) (0.014) (0.019)
Country-level intercept predictors
Log(GDP per capita) 0.13 0.16** 0.20
(0.095) (0.081) (0.12)
Polity score –0.020 –0.031 0.024
(0.034) (0.029) (0.048)
Country-level slope predictors
Enforced compulsory voting –0.071**
(0.029)
Variance of intercepts 0.040 0.045 0.035
Variance of slopes on voting 0.0031
Residual variance 0.57 0.57 0.59
N 24,224 24,224 10,738
J 18 18 9
Log-Likelihood –27,727 –27,724 –12,439
AIC 55,485 55,483 24,909
*p < 0.10; **p < 0.05; ***p < 0.01.
thought of as “dispositional nonvoters.” In either case, we expect the relationship between voting and happiness to be weaker in countries where compulsory voting is enforced.
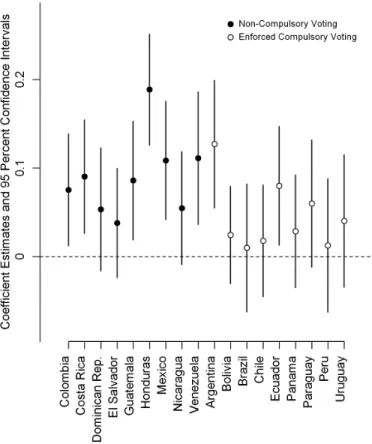
Column 2 in table 1 presents the parameter estimates from this model. Column 2 displays the group-level coefficients and the individ-ual-level coefficients with the exception—because it varies across coun-tries—of voting. The country-level coefficients on voting are plotted in figure 1. Our expectation with respect to the varying slopes is supported by the analysis: the negative and statistically significant coefficient for compulsory voting shows that the positive relationship between voting and life satisfaction is attenuated in countries with enforced compulsory voting.
Figure 1. Voting and Satisfaction with Life
Notes: Slope values calculated from a varying-slope linear model with country-level slope and intercept predictors of life satisfaction.
The range of estimates across countries suggests that voters might be only negligibly happier than their nonvoting counterparts (Brazil and Peru) or that voters may be up to 0.19 points more satisfied with their lives as compared to nonvoters (Honduras). The estimated coefficient on voting is positive in all nine of the countries without enforced com-pulsory voting, and it is statistically significant in six of these.21In
con-trast, the relationship between voting and life satisfaction is weaker, though still positive, in those countries with enforced compulsory voting. Among the compulsory voting countries, only in Argentina and Ecuador is the coefficient estimate statistically significant at the conven-tional 95 percent confidence level.
We also repeat the analysis for the noncompulsory voting countries only. Column 3 in table 1 shows the varying-intercept model for non-compulsory voting countries, estimating a single coefficient on voting that is slightly larger than that reported in column 1. These results sug-gest that voting and life satisfaction are positively correlated in Latin America as a whole and that this relationship is stronger in countries without enforced compulsory voting.22
The analysis in this section shows the existence of a positive corre-lation between individual voting behavior and life satisfaction. However, regression models of this nature do not allow us to identify any causal relationship between the two variables. As in Western Europe, voters in Latin America tend to be more satisfied with their lives, but does the act of voting create happiness, or the reverse?
E
STABLISHINGC
AUSALITY IN THEV
OTING ANDH
APPINESSR
ELATIONSHIPThree strategies are available that may allow us to identify the direction of the relationship between voting and life satisfaction in Latin America. First we exploit the timing of the surveys and voting-age laws to com-pare a group of citizens who were not eligible to vote to an otherwise similar group who were. Second, we make use of voting eligibility as an instrument for voting across the entire range of the data. Third, we examine unique data on voting behavior in a referendum in Costa Rica.
Survey Timing and Voting-Age Laws
The 2008 AmericasBarometer was conducted without regard for the polit-ical timeline of each individual country. The survey was carried out in early 2008 in all countries, but in many cases the most immediate previ-ous presidential election was held many months, or in some cases years, before the survey.23Nevertheless, anyone 18 years of age or older (16 in
This means that in each country, a group of the survey’s youngest respondents were not eligible to vote at the time of their country’s last presidential election and therefore can be clearly classified as nonvot-ers. This allows us to create two delimited cohorts within the data: one that was barely eligible to vote in the most recent election and one that was barely not eligible. The distinguishing characteristic is eligibility at the time of the most recent election; at the time of the survey, all respondents were eligible to vote.24 We expect these groups to be
oth-erwise similar, which allows us to attribute differences in average hap-piness across the two groups to the act of voting in the most recent elec-tion. As in a regression discontinuity design, we think of this younger cohort as a control group and their slightly older—but otherwise simi-lar—counterparts as a group that has been “treated” with the act of voting. This allows us to attempt to estimate a causal effect of voting on life satisfaction for these young voters.25
For example, in a country with a presidential election held 13 months prior to the survey, we can compare the self-reported happiness of 18-year-olds (who were 17 at the time of the election and therefore not able to vote) with that of 19-year-olds (who were eligible to cast bal-lots).26Although, by construction, respondents in this control group are
slightly younger than those who were able to vote, we expect that indi-viduals in these two groups will otherwise be, on average, very similar along many dimensions, including their enjoyment of full political rights (including eligibility to vote) at the time of the survey and, also impor-tant, unobservable characteristics like personality type. The key distin-guishing characteristic of the 18-year-old respondents is expected to be that they did not cast votes in the last election. By including these respondents, the survey creates an opportunity for us to plausibly iden-tify the effect of the act of voting on life satisfaction by comparing aver-age happiness across these two cohorts.
For all countries, we classify a group of young respondents accord-ing to whether or not they could have voted at the time of the last elec-tion. The exact definition of the control and treatment groups varies from country to country depending on the date of the most recent pres-idential election.27
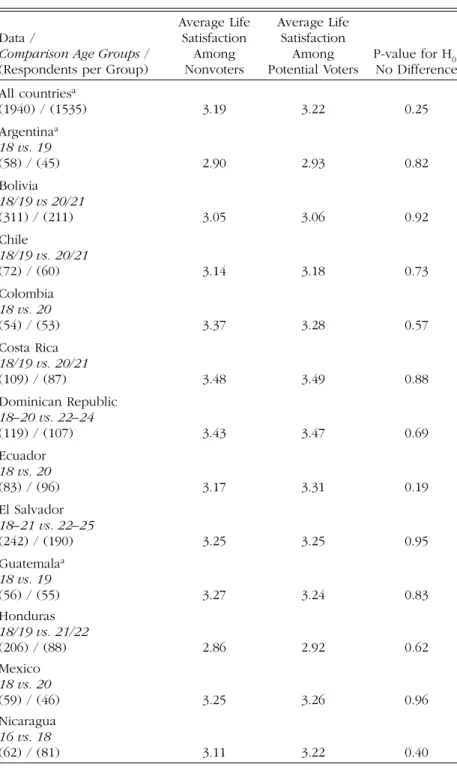
Table 2. Difference-in-Means Tests for Life Satisfaction Across Voting and Nonvoting Cohorts
Average Life Average Life
Data / Satisfaction Satisfaction
Comparison Age Groups/ Among Among P-value for H0: (Respondents per Group) Nonvoters Potential Voters No Difference
All countriesa
(1940) / (1535) 3.19 3.22 0.25
Argentinaa
18 vs. 19
(58) / (45) 2.90 2.93 0.82
Bolivia
18/19 vs 20/21
(311) / (211) 3.05 3.06 0.92
Chile
18/19 vs. 20/21
(72) / (60) 3.14 3.18 0.73
Colombia
18 vs. 20
(54) / (53) 3.37 3.28 0.57
Costa Rica
18/19 vs. 20/21
(109) / (87) 3.48 3.49 0.88
Dominican Republic
18–20 vs. 22–24
(119) / (107) 3.43 3.47 0.69
Ecuador
18 vs. 20
(83) / (96) 3.17 3.31 0.19
El Salvador
18–21 vs. 22–25
(242) / (190) 3.25 3.25 0.95
Guatemalaa
18 vs. 19
(56) / (55) 3.27 3.24 0.83
Honduras
18/19 vs. 21/22
(206) / (88) 2.86 2.92 0.62
Mexico
18 vs. 20
(59) / (46) 3.25 3.26 0.96
Nicaragua
16 vs. 18
countries, there is no indication that voters are systematically more sat-isfied with their lives than nonvoters. Although treated individuals are slightly happier in about half of the countries, none of these differences approach conventional levels of statistical significance.28
The results of multivariate regressions limited to the relevant age ranges and controlling for other individual characteristics also suggest that there is no effect on individual life satisfaction from being in the treated group.29In other words, when we look at two cohorts that are
comparable across unobservable characteristics and control for known correlates of happiness, we continue to find no relationship between
Table 2. (continued)
Average Life Average Life
Data / Satisfaction Satisfaction
Comparison Age Groups/ Among Among P-value for H0: (Respondents per Group) Nonvoters Potential Voters No Difference
Panama
18–20 vs. 22–24
(172) / (123) 3.40 3.36 0.64
Paraguay
18–22 vs. 23–27
(207) / (185) 3.12 3.09 0.70
Peru
18/19 vs. 20/21
(98) / (81) 3.15 3.02 0.20
Venezuela
18 vs. 19
(44) / (45) 3.52 3.44 0.59
Uruguay
18–20 vs. 22–24
(102) / (82) 3.22 3.33 0.27
Noncompulsory voting countriesa
(895) / (697) 3.22 3.28 0.14
Compulsory voting countriesa
(1045) / (838) 3.16 3.17 0.84
aBoth Argentina and Guatemala held presidential elections less than a year before
voting and life satisfaction. For a number of reasons, these results should be treated with caution. In addition to the relatively small sample size, the two groups are, of course, slightly different in age composition. Given the negative relationship between age and happiness, the fact that those in the treatment group are even only slightly older means that if there is a very small positive effect of voting on happiness, we may not detect it with this method. Nevertheless, this analysis does not pro-vide support for the idea that voting causes happiness.
Using Voting Eligibility as an Instrument for Voting
The regression discontinuity design has a number of advantages, most notably in the straightforward nature of the analysis that it allows. How-ever, it incorporates only data from the survey’s youngest respondents. We also can use the voting eligibility indicator from the regression dis-continuity design and employ it as an instrument in a two-stage least squares (2SLS) regression that attempts to estimate the causal effect of voting on happiness. Although voting eligibility is highly correlated with voting, we have no reason to believe that there should be any inde-pendent effect of eligibility at the time of the last election on happiness at the time of the survey. Theoretically, a full simultaneous equations model in which we would also instrument for happiness would allow us to estimate the effect of happiness on voting along with the effect of voting on happiness. However, the temporal nature of the survey does not lend itself to this approach. Recall that happiness is measured at the time of the survey, whereas the act of voting takes place at some point in the past—at the time of the most recent presidential election. The available data are therefore more amenable to a test of whether voting leads to happiness, rather than the reverse.30
Those Who Cannot Vote and Those Who Do Not Want to Vote: Evidence from Costa Rica
A highly contentious and well-publicized referendum took place in October 2007 in Costa Rica on the subject of entering into the
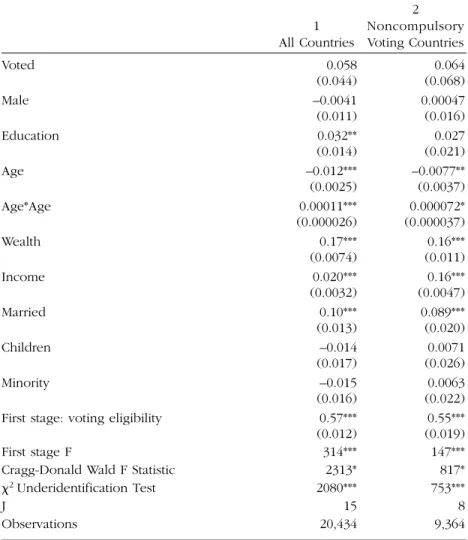
Domini-Table 3. Two-Stage Least Squares Regression Estimates
2
1 Noncompulsory
All Countries Voting Countries
Voted 0.058 0.064
(0.044) (0.068)
Male –0.0041 0.00047
(0.011) (0.016)
Education 0.032** 0.027
(0.014) (0.021)
Age –0.012*** –0.0077**
(0.0025) (0.0037)
Age*Age 0.00011*** 0.000072*
(0.000026) (0.000037)
Wealth 0.17*** 0.16***
(0.0074) (0.011)
Income 0.020*** 0.16***
(0.0032) (0.0047)
Married 0.10*** 0.089***
(0.013) (0.020)
Children –0.014 0.0071
(0.017) (0.026)
Minority –0.015 0.0063
(0.016) (0.022)
First stage: voting eligibility 0.57*** 0.55***
(0.012) (0.019)
First stage F 314*** 147***
Cragg-Donald Wald F Statistic 2313* 817*
2 Underidentification Test 2080*** 753***
J 15 8
Observations 20,434 9,364
*p < 0.10; ** p < 0.05; ***p < 0.01.
can Republic–Central America Free Trade Agreement (DR-CAFTA). The AmericasBarometer survey conducted in early 2008 asked respondents whether they had voted in the referendum or not, and if not, why not. Of the 1,482 respondents, 818 reported voting in the referendum, 620 reported not voting, and 44 did not answer this question. Of the 664 who could have provided an answer to the question of why they did not vote—both those who said they did not vote and those who did not answer the question about the referendum—only 295 did.
From a set of 19 possible explanations for not voting, we classify responses into two categories: those that indicate an inability to vote (e.g., not having an ID card, lacking transportation, or having to work on the day of the referendum) and those that indicate a desire not to vote. (The most common responses in this category were that the respondent did not like either of the referendum options or was not interested in the referendum.) Of the nonvoters who replied to this question, 58 percent said they did not vote because they were not able to do so, meaning that there are 123 nonvoters in the data who said they did not want to vote.31
We can use this information to help establish whether the act of voting has consequences for life satisfaction or, alternatively, whether more satisfied people are systematically more likely to be voters. If the former is true and voting increases happiness, we would expect non-voters, regardless of their reasons for failing to vote, to have systemati-cally lower levels of life satisfaction than voters. In contrast, if the latter is the case, we would expect voters and the group of nonvoters who wanted to vote to have similar, higher levels of life satisfaction as com-pared to nonvoters who did not want to vote.32 As figure 1 shows, the
relationship between voting and happiness in Costa Rica is typical of the countries in our dataset—and particularly the countries without com-pulsory voting. Although this analysis suffers from the obvious limita-tions of a single case, we believe that using data from this specific case can provide legitimate insight into the more general phenomenon under study here.
because they were in some way constrained from doing so) against those who do not express any interest or desire to cast their ballot.
The first model includes only the indicator variable for voting, and serves to establish that the results of these particular data are consistent with those found in the larger LAPOP dataset: voters appear to be more satisfied with their lives, controlling for the usual set of covariates. How-ever, the same question remains: did voting in the referendum make people happier, or did happier people vote in the referendum?
Table 4. Linear Regression Estimates from Costa Rica
4
1 2 3 Wanted
All All All to Vote
Voted 0.130*** 0.039 0.035
(0.045) (0.068) (0.068)
Wanted to vote 0.187** 0.147
(0.077) (0.096)
Male 0.009 –0.050 –0.047 –0.077
(0.045) (0.050) (0.050) (0.053)
Education 0.031 –0.001 0.003 0.020
(0.052) (0.054) (0.055) (0.058)
Age –0.009 –0.018** –0.019** –0.017*
(0.007) (0.008) (0.008) (0.009)
Age*Age 0.0001 0.0002** 0.0002** 0.0002**
(0.00008) (0.00008) (0.00008) (0.00009)
Wealth 0.122*** 0.144*** 0.141*** 0.134***
(0.028) (0.031) (0.031) (0.033)
Income 0.030*** 0.036*** 0.035*** 0.037***
(0.011) (0.012) (0.012) (0.013)
Married 0.112** 0.102* 0.098* 0.101*
(0.051) (0.055) (0.055) (0.059)
Children –0.061 –0.029 –0.020 –0.019
(0.065) (0.071) (0.071) (0.076)
Indigenous –0.201*** –0.141* –0.139* –0.096
(0.075) (0.083) (0.083) (0.087)
Combined effect of 0.186**
wanting to vote and voting (0.079)
N 1172 913 908 812
Adjusted R2 0.06 0.06 0.06 0.05
*p < 0.10; **p < 0.05; ***p < 0.01.
The three additional models in table 4 help us gain leverage on this question. The second model includes only the indicator variable for wanting to vote, and here we find that this variable is positive and sig-nificant and actually has a slightly larger estimated coefficient than that for the act of voting alone from column 1. The third model includes both variables, and reveals that although neither is statistically significant at conventional levels, the coefficient on wanting to vote has a larger magnitude and a higher significance level than the coefficient on the act of voting itself.33 The combined effect of the two variables is positive
and statistically significant. Recall that the indicator for wanting to vote takes the value of 1 for all those who actually voted, in addition to those who wanted to vote but did not. So the combined effect indicates the effect for people who both wanted to vote and did vote, but the rela-tive magnitude of the two constituent effects suggests that most of the association is due to the link between wanting to vote and happiness.
In addition, by looking only at the subset of people who wanted to vote—combining those who actually did vote with those who said that they could not vote because of some constraint on their ability to do so—we can better determine whether or not the act of voting makes a significant difference for life satisfaction. The results from the fourth model suggest that it does not. In the subset of people who wanted to vote—where some were able to do so and others were not—the act of actually voting bears no relationship to life satisfaction. This finding is consistent with the interpretation that the significant correlation between the two variables runs from life satisfaction to voting (or desiring to vote), rather than in the opposite direction.
CONCLUSIONS
This article has provided the first evidence that voting and individual life satisfaction are positively correlated in a sample of Latin American tries. The results also suggest that this relationship is weaker in coun-tries with enforced compulsory voting. The study has attempted to iden-tify the direction of causality of this relationship through statistical modeling, a regression discontinuity design, and the analysis of unique survey data. Although each of these methods has its limitations, the con-sistent results across the three increase our confidence in our findings: we do not find any evidence that voting increases individual happiness. Instead, our data are more consistent with the claim that happiness causes people to participate.
and life satisfaction, on the other; but it is, of course, possible that some other, unobserved factor—perhaps genetic predispositions—causes both happiness and participation (Fowler et al. 2008). In addition, even though we find that the most ubiquitous form of political participation, voting, has no causal effect on happiness, democracies also create opportunities for many other types of political participation. More involved or frequent forms of participation may have a more measura-ble effect on individual life satisfaction than the relatively low-cost form of participation studied here.
Similarly, insofar as satisfaction with life may increase the propen-sity to participate, this calls for the exploration of other forms of partic-ipation as outcome variables. Although happier people may be more likely to vote, perhaps those less satisfied with their lives are more likely to contact their elected representatives or participate in protests. Latin America has led the modern movement for direct democracy, and polit-ical protest has played a prominent role in many instances where gov-ernment stability is at stake. It should be a fruitful region in which to examine further the possibly complex relationship between individual political participation and life satisfaction.
NOTES
For summary statistics on all variables used in this analysis, wording of questions, and other pertinent information, see the online appendix, which is available at http://netfiles.uiuc.edu/mwinters/www. The authors are listed in alphabetical order; both contributed equally to this project. This article is based on research begun for the Inter-American Development Bank and available as IDB Working Paper 638; we thank Carlos Scartascini for his valuable feedback and guidance on that project. Thanks to Amanda Cronkhite for research assis-tance. Thanks also to Lucy Goodhart, Georgia Kernell, Julia Maskivker, and Miguel Rueda Robayo for careful comments and to Bernd Beber, Miguel de Figueiredo, Daniel Neff, and the participants in the Columbia University Quan-titative Political Science Seminar for useful feedback and discussion. Six anony-mous reviewers provided extremely helpful comments. We thank the Latin American Public Opinion Project (LAPOP) and its major supporters (the United States Agency for International Development, the United Nations Development Program, the Inter-American Development Bank, and Vanderbilt University) for making the data available. All errors and omissions are our own.
1. Throughout this paper, the terms happinessand life satisfactionare used interchangeably. The survey data ask respondents about life satisfaction. Although the literature has established some differences between the two terms (e.g., life satisfactionis more highly correlated with stable, long-term character-istics), comparing findings between the two outcome variables yields fairly con-sistent results (Helliwell and Putnam 2004).
than the act of participation itself. Tavits (2008) also finds that voters are hap-pier than nonvoters, although she does not make any claims about the causal direction of the relationship.
3. Although the largest Latin American surveys now include questions on life satisfaction, most studies on happiness remain focused on Western Europe. One exception is Graham and Pettinato 2001, which looks at the economic cor-relates of life satisfaction in Latin America. They conclude that most findings about the demographic correlates of happiness from the literature on Western Europe hold in Latin America; our results also confirm this, and in addition, we are the first to examine possible political correlates of happiness in the region. 4. See Lyubomirsky et al. 2005 for a summary and critique (including self-critique) of the pervasiveness of this attitude in the literature (particularly in psy-chology) on happiness.
5. Scholars have used political participation as an explanatory variable in studies of political efficacy (Finkel 1985, 1987; Clarke and Acock 1989; Stenner-Day and Fischle 1992; Rahn et al. 1999; Ikeda et al. 2008), political conceptual-ization (Leighley 1991), political tolerance (Weber 2003), societal trust (Rahn et al. 1999), and regime support (Ginsberg and Weissberg 1978; Finkel 1987; Rahn et al. 1999; Anderson et al. 2005).
6. See the description of self-determination theory in Ryan and Deci 2001, 146-48; the references in Frey et al. 2004, 380; and the discussion in Muhlberger 2005.
7. Recent work in political science has explored the link between the “Big Five” personality traits and various types of political participation. Although these studies do not measure happiness or life satisfaction directly, they do find a positive correlation between political participation and some traits we expect to be positively correlated with happiness, like extroversion and openness to experience. See Mondak et al. 2010 and Gerber et al. 2010 for summaries of this literature. We thank Amanda Cronkhite for calling this parallel to our attention. 8. Helliwell and Huang (2008) also look at governance and aggregate levels of subjective well-being. They find that governance characteristics related to service delivery positively predict happiness in all countries, whereas gover-nance characteristics related to democratic expression positively predict happi-ness only in wealthy countries.
9. The LAPOP is run by the Center for the Americas at Vanderbilt Univer-sity, which regularly administers public opinion surveys throughout the Ameri-cas. The countries included in the LAPOP survey analyzed here are Argentina, Bolivia, Brazil, Colombia, Costa Rica, Chile, the Dominican Republic, Ecuador, El Salvador, Guatemala, Honduras, Mexico, Nicaragua, Panama, Paraguay, Peru, Uruguay, and Venezuela. All surveys were conducted between January and March 2008, with national probability samples of 1,500 respondents (3,000 in the cases of Bolivia and Ecuador) who were interviewed in person across urban and rural areas in each country. Most surveys employed a complex sampling design that takes into account clustering and stratification. More details about the sur-veys are available at www.LapopSursur-veys.org.
States, see Clausen 1968 and Silver et al. 1986, among others.) To the extent that voting has an effect on individual life satisfaction or that voters systematically differ from nonvoters, the tendency to falsely report having voted will attenuate the coefficient on voting toward zero.
11. The survey asks, “In general, how much do you find yourself satisfied with your life? Would you say that you find yourself: (1) Very satisfied, (2) Some-what satisfied, (3) SomeSome-what dissatisfied, or (4) Very dissatisfied?” We have recoded responses so that higher scores on these variables indicate a greater subjective assessment of happiness. For summary statistics on all variables used in this analysis, see the online appendix.
12. For the purpose of exposition, we report coefficients from OLS regres-sions. The signs, statistical significance, and substantive effects from coefficients estimated using ordered logistic regression are generally quite similar; those estimates can be found in the online appendix.
13. The exact wording of all questions is included in the online appendix. 14. We also replicate the analysis with two other measures of democracy, the Freedom House index and Vanhanen’s index of democratization. The results are unchanged.
15. For example, Veenhoven (1995), Schyns (1998), Tavits (2008), and Di Tella and MacCulloch (2008) find that GDP per capita correlates positively and sig-nificantly with subjective well-being, while Veenhoven (1995, 2005) finds that democracy correlates positively and significantly with subjective well-being. On the other hand, studies such as Easterlin 1974 and Radcliff 2001 do not find a signifi-cant cross-country link between GDP per capita and average national happiness.
16. This result is consistent with results reported by Di Tella and MacCul-loch (2006) and Radcliff (2005).
17. Signs and significance levels for the intercept predictors are similar when only GDP per capita or the Polity score is included.
18. We have replicated these initial analyses using other available data from Latin America. Using the 2004 and 2006 LAPOP surveys, we find results similar to those presented here: voting is a positive and significant predictor of subjec-tive well-being, controlling for confounding covariates. We do not find this rela-tionship in similar data from another large survey in the region, the 2005 Lati-nobarómetro. All three analyses are reported in the online appendix.
19. Compulsory voting laws are common in Latin America, with 14 of the 18 countries in the sample having some sort of regulation on the books. Such laws are rarely enforced in full, but there is at least some enforcement in 9 of the countries in our sample: Argentina, Bolivia, Brazil, Chile, Ecuador, Panama, Paraguay, Peru, and Uruguay (International IDEA n.d.; Electoral Commission 2006; see also relevant country information in CIA 2008). Even in these coun-tries, enforcement is variable, and institutional particularities provide some opportunities to evade enforcement. So, for example, Chile requires voting only among those registered, and registering to vote is voluntary. Given this situa-tion, it is not surprising that although turnout in these countries is higher than elsewhere in the region, it is not universal.
21. The confidence intervals on these slope estimates are calculated using only the uncertainty in the estimate of the fixed-effect component of the slope. All the confidence intervals increase in size if the error in estimating the random component of the slope is also taken into account. We report these results in the online appendix.
22. In an alternate specification, we also include the amount of time since the most recent election as correlate of the varying slopes. When both variables are included in the analysis, time elapsed since the last election is not significantly correlated with the country-varying slopes, whereas enforced compulsory voting remains a significant predictor. Results are available in the online appendix.
23. The time lag between the act of voting and the administration of the survey might attenuate any positive effect of voting on life satisfaction. To the extent that voting has only a temporary positive effect on happiness, the avail-able data are unlikely to detect it. Insofar as this is true, however, we would expect the coefficient on voting in the multilevel model described above to decrease as time since the election increases. As noted in the previous footnote, this is not the case, which suggests that the results are not merely an artifact of the time elapsed since the last election. We thank an anonymous reviewer for raising this point.
24. We therefore use this strategy to identify the causal effect of voting and not the causal effect of eligibility. All survey respondents had been treated with eligibility by the time the survey occurred, but only some had been treated with the ability to vote in the most recent election.
25. Obviously, not all those treated actually vote; in this sense, our treat-ment did not have complete compliance. In the countries in our dataset, turnout averages 76 percent: 72 percent in the countries without compulsory voting and 80 percent in countries with enforced compulsory voting. Given that some of the ineligible voters would probably be nonvoters if they had been eligible, we compare ineligible voters to the entire group of eligible voters. If we instead compared ineligible voters only to those who actually turned out, these groups would be likely to differ systematically on characteristics relevant for voting. Since all of the respondents in the survey were eligible to vote at the time of the survey, any significant effect could be attributed to the actual act of voting in the past rather than to the change in eligibility status. Basing our inferences on comparing two sets of young voters means that the results are not immedi-ately generalizable to all voters.
26. Marc Meredith (2008) employs a similar strategy to examine the effects of past political participation on voter turnout in the United States.
27. Depending on the date of the last election, respondents of a certain age may be split between previously eligible and ineligible voters. In these cases, we omit this group from the analysis and compare only those respondents whose eligibility status at the time of the last election was certain, using data spaced equally around the cutpoint for voting eligibility, such that the size of the eligible and ineligible groups will be roughly equivalent.
are far from definitive. As noted, the 95 percent confidence interval from the dif-ference-in-means test encompasses zero, indicating that we cannot reject the null hypothesis that there is no effect of voting on happiness. At the same time, the confidence interval also encompasses .06, the estimated coefficient of the relationship between voting and happiness from our initial multilevel regression model. This means that we are not in a position to reject the null hypothesis that the true effect of voting on happiness is this positive value. We thank an anonymous reviewer for calling our attention to this possibility.
29. Results are in the online appendix. In a number of countries, the older cohort has higher levels of education and is statistically significantly more likely to be married and to have children. Because of this, we replicate the null results that we obtain in the difference-in-means tests through regression analyses in which we control for these confounding covariates. Note that marriage and edu-cation are associated with increased life satisfaction in our data, while having children is not correlated with any change in satisfaction. The finding that the older group is more likely to have characteristics associated with increased hap-piness suggests that, if anything, the difference-in-means test should be biased toward finding a positive effect of voting on happiness. Our failure to find such an effect increases our confidence in the claim that voting is unlikely to be a cause of happiness for this age group.
30. The case might be made that we would be able to detect a relationship insofar as the measure of present-period happiness correlates highly with the measure of happiness at the time when the voting decision was being made. Therefore, we attempted a 2SLS analysis of the effect of happiness on voting using an indicator for whether or not the respondent had been the victim of vio-lent crime in the last 12 months as the instrument for happiness. The coefficient on instrumented happiness is large and positive, as we would expect, but not statistically significant.
31. Respondents provided the reason for their failure to vote sponta-neously, and so a small number (10) gave answers of both types. We code these individuals as not wanting to vote for the purposes of the results presented here. If we instead code these individuals’ responses as missing, the results are unchanged.
32. Nonvoters who could not vote might systematically differ from non-voters who did not want to vote in ways that might be correlated with happi-ness. For instance, someone lacking transportation or an identity card might be less well off than his or her peers in ways that our income measure does not capture, which could, in turn, cause that person to be both less happy and less likely to vote. If this were the case and we found that those unable to vote were systematically less happy than their voting counterparts, then it would be diffi-cult to say whether this was due to the failure to vote or to some other charac-teristic (like deeper poverty). In fact, however, we find just the opposite. Non-voters who could not vote are systematically happier than nonNon-voters who chose not to vote. This suggests that, if anything, we are underestimating the extent to which nonvoters who want to vote report greater life satisfaction than nonvot-ers who choose not to vote.
REFERENCES
Anderson, Christopher, André Blais, Shaun Bowler, Todd Donovan, and Ola Listhaug. 2005. Loser’s Consent: Elections and Democratic Legitimacy. New York: Oxford University Press.
Barber, Benjamin. 1984. Strong Democracy: Participatory Politics for a New Age. Los Angeles: University of California Press.
Bowles, Samuel, and Herbert Gintis. 1986. Democracy and Capitalism: Property, Community, and the Contradictions of Modern Social Thought. New York: Basic Books.
Central Intelligence Agency (CIA). 2008. World Factbook. Washington, DC: U.S. Central Intelligence Agency.
Clarke, Harold D., and Alan C. Acock. 1989. National Elections and Political Atti-tudes: The Case of Political Efficacy. British Journal of Political Science19, 4: 551–62.
Clausen, Aage R. 1968. Response Validity: Vote Report. Public Opinion Quar-terly32, 4: 588–606.
Di Tella, Rafael, and Robert MacCulloch. 2006. Some Uses of Happiness Data in Economics. Journal of Economic Perspectives20, 1 (Winter): 25–46. –––––. 2008. Gross National Happiness as an Answer to the Easterlin Paradox.
Journal of Development Economics86: 22–42.
Dorn, David, Justina A. V. Fischer, Gebhard Kirchgässner, and Alfonso Sousa-Poza. 2008. Direct Democracy and Life Satisfaction Revisited: New Evidence from Switzerland. Journal of Happiness Studies9: 227–55.
Drèze, Jean, and Amartya K. Sen. 2002. India: Economic Development and Social Opportunity. New York: Oxford University Press.
Easterlin, Richard A. 1974. Does Economic Growth Improve the Human Lot? Some Empirical Evidence. In Nations and Households in Economic Growth, ed. P. A. David and Melvin W. Reder. New York: Academic Press. 89–125. Electoral Commission (United Kingdom). 2006. Compulsory Voting Around the
World: Executive Summary. www.electoralcommission.org.uk/document-summary?assetid=13240. Accessed October 7, 2011.
Finkel, Steven E. 1985. Reciprocal Effects of Participation and Political Efficacy: A Panel Analysis. American Journal of Political Science29: 891–913. –––––. 1987. The Effects of Participation on Political Efficacy and Political Suppot:
Evidence from a West German Panel. Journal of Politics49, 2: 441–64. Fowler, James H., Laura A. Baker, and Christopher T. Dawes. 2008. Genetic
Vari-ation in Political ParticipVari-ation. American Political Science Review 102, 2 (May): 233–48.
Frey, Bruno S., and Alois Stutzer. 2000. Happiness Prospers in Democracy. Jour-nal of Happiness Studies1: 79–102.
–––––. 2005a. Beyond Outcomes: Measuring Procedural Utility. Oxford Eco-nomic Papers57: 90–111.
–––––. 2005b. Happiness Research: State and Prospects. Review of Social Econ-omy62, 2 (June): 207–28.
Gelman, Andrew, and Jennifer Hill. 2006. Data Analysis Using Regression and Multilevel/Hierarchical Models. New York: Cambridge University Press.
Gerber, Alan S., Gregory A. Huber, David Doherty, Conor M. Dowling, and Shang E. Ha. 2010. Personality and Political Attitudes: Relationships Across Issue Domains and Political Contexts. American Political Science Review
104, 1 (February): 111–33.
Ginsberg, Benjamin, and Robert Weissberg. 1978. Elections as Legitimizing Insti-tutions. In Parties and Elections in an Anti-Party Age, ed. Jeff Fishel. Bloomington: Indiana University Press. 179–85.
Graham, Carol, and Stefano Pettinato. 2001. Happiness, Markets, and Democ-racy: Latin America in Comparative Perspective. Journal of Happiness Stud-ies2, 3 (September): 237–68.
Haller, Max, and Markus Hadler. 2006. How Social Relations and Structures Can Produce Happiness and Unhappiness: An International Comparative Analy-sis. Social Indicators Research75, 2 (January): 169–216.
Helliwell, John F., and Haifang Huang. 2008. How’s Your Government? Interna-tional Evidence Linking Good Government and Well-Being. British Journal of Political Science 38: 595–619.
Helliwell, John F., and Robert D. Putnam. 2004. The Social Context of Well-Being. Philosophical Transactions of the Royal Society of London. Series B 359: 1435–46.
Ikeda, Ken’ichi, Tetsuro Kobayashi, and Maasa Hoshimoto. 2008. Does Political Participation Make a Difference? The Relationship Between Political Choice, Civic Engagement, and Political Efficacy. Electoral Studies27, 1: 77–88. Inglehart, Ronald. 2000. Globalization and Postmodern Values. Washington
Quarterly23, 1 (Winter): 215–28.
International Institute for Democracy and Electoral Assistance (IDEA). n.d. Compulsory Voting. www.idea.int/vt/compulsory_voting.cfm. Accessed October 7, 2011.
Keim, Donald W. 1975. Participation in Contemporary Democratic Theories. In
Participation in Politics, ed. J. Roland Pennock and John W. Chapman. New York: Lieber-Atherton. 1–38.
Klandermans, Bert. 1989. Grievance Interpretation and Success Expectations: The Social Construction of Protest. Social Behaviour4, 2: 113–25.
Leighley, Jan. 1991. Participation as a Stimulus of Political Conception. Journal of Politics53, 1: 198–211.
Lyubomirsky, Sonja, Laura A. King, and Ed Diener. 2005. The Benefits of Fre-quent Positive Affect: Does Happiness Lead to Success? Psychological Bul-letin131, 6 (November): 803–55.
Mansbridge, Jane. 1983. Beyond Adversary Democracy. Chicago: University of Chicago Press.
Meredith, Marc. 2008. Persistence in Political Participation. Manuscript. Stanford University.
Mill, John Stuart. 1862. Considerations on Representative Government. New York: Harper and Brothers.
Inte-grative Framework for the Study of Trait Effects on Political Behavior.
American Political Science Review104, 1 (February): 85–110.
Muhlberger, Peter. 2005. Democratic Deliberation and Political Identity: Enhanc-ing Citizenship. Paper presented at the 2005 Annual MeetEnhanc-ing of the Inter-national Society of Political Psychology, Toronto, July 3–6.
O’Donnell, Guillermo A. 1994. Delegative Democracy. Journal of Democracy5, 1 (January): 55–69.
Olsen, Marvin E. 1982. Participatory Pluralism. Chicago: Nelson-Hall.
Radcliff, Benjamin. 2001. Politics, Markets, and Life Satisfaction: The Political Economy of Human Happiness. American Political Science Review95, 4 (December): 939–52.
–––––. 2005. Class Organization and Subjective Well-Being: A Cross-National Analysis. Social Forces84, 1: 513–30.
Rahn, Wendy M., John Brehm, and Neil Carlson. 1999. National Elections as Institutions for Generating Social Capital. In Civic Engagement and Ameri-can Democracy, ed. Morris P. Fiorina and Theda Skocpol. Washignton, DC: Brookings Institution Press. 111–60.
Ryan, Richard M., and Edward L. Deci. 2001. On Happiness and Human Poten-tials: A Review of Research on Hedonic and Eudaimonic Well-Being.
Annual Review of Psychology52: 141–66.
Schyns, Peggy. 1998. Cross-national Differences in Happiness: Economic and Cultural Factors Explored. Social Indicators Research43: 3–26.
Sen, Amartya K. 2001. Development as Freedom. New York: Oxford University Press.
Silver, Brian D., Barbara A. Anderson, and Paul R. Abramson. 1986. Who Over-reports Voting? American Political Science Review 80, 2 (June): 613–24. Steenbergen, Marco R., and Bradford S. Jones. 2002. Modeling Multilevel Data
Structures. American Journal of Political Science46, 1: 218–37.
Stenner-Day, Katen, and Mark Fischle. 1992. The Effects of Political Participation on Political Efficacy: A Simultaneous Equations Model. Australian Journal of Political Science27, 2 (July): 282–305.
Stutzer, Alois, and Bruno S. Frey. 2006. Political Participation and Procedural Utility: An Empirical Study. European Journal of Political Research 45, 3: 391–418.
Tavits, Margit. 2008. Representation, Corruption, and Subjective Well-Being.
Comparative Political Studies41, 12: 1607–30.
Thompson, Dennis F. 1970. The Democratic Citizen: Social Science and Democratic Theory in the Twentieth Century. New York: Cambridge University Press. Veenhoven, Ruut. 1988. The Utility of Happiness. Social Indicators Research20:
333–54.
–––––. 1995. The Cross-National Pattern of Happiness: Test of Predictions Implied in Three Theories of Happiness. Social Indicators Research 34, 1 (January): 33–68.
–––––. 2005. Apparent Quality-of-Life in Nations. Social Indicators Research71: 61–68.