B
ART
T
HIJS
E
IGHT
Eight Clusters: A Dynamic Perspective and Structural Analysis for the Evaluation of Institutional Research Performance
PROEFSCHRIFT
Ter verkrijging van de graad van Doctor aan de Universiteit Leiden, op gezag van Rector Magnifi cus prof. mr. P.F. van der Heijden,
volgens besluit van het College voor Promoties te verdedigen op woensdag 27 januari 2010
klokke 11:15 uur door Bart C.M. Thijs
PROMOTIECOMMISSIE
Promotoren: Prof. Dr. A.F.J. van Raan
Prof. Dr. W. Glänzel (Katholieke Universiteit Leuven)
Overige leden:
Prof. Dr. J.A. Bruijn
Prof. Dr. P.M. Kroonenberg
P
REFACEI had the opportunity to write this thesis while working at ‘Steunpunt voor beleidsrelevant onderzoek O&O Indicatoren’. This policy research centre on R&D indicators was established in 2002 by the Flemish regional government at K.U.Leuven. In 2005 it became an interuniversity consortium and in January 2009 it was transformed into the Centre for R&D Monitoring (ECOOM). Its mission was and still is to develop a consistent system of R&D and Innovation indicators to assist the Flemish government in mapping and monitoring the R&D efforts in the Flemish region.
The main theme of the thesis is assessment of institutional research performance. It is a theme of great importance not only to our centre but also in many other countries or regions. The number of countries who developed (or are still developing) systems for assessment exercises or for institutional funding is rapidly increasing. However comparability between those national systems or between institutions with different profi les remains problematic.
This thesis presents a new Dynamic Perspective on research performance. It is based on four fundamental principles and combines the use of bibliometric indicators with a structural analysis of the research profi le of institutes. This structural analysis allows the classifi cation of institutions based on the fi elds in which they are active.
T
ABLE OF CONTENTSI B
ACKGROUND, M
ODELANDA
PPLICATIONS...1
1 General
Introduction
...3
1.1 Background
...3
1.2
Common problems with research assessment ...4
1.2.1 Field
dependence.
...4
1.2.2 Comparability
...5
1.2.3 Quantitative versus qualitative approach ...5
1.3
Introduction in bibliometrics ...6
1.3.1 De
fi
nition and history ...6
1.3.2 Bibliographic
databases
...7
1.3.3 Indicators and bibliometric tools ...9
1.3.4 Applications of bibliometrics ...12
1.4
A dynamic perspective based on a structural analysis of
institutional research pro
fi
les ...14
1.5
Framework of the thesis ...15
References ...16
2 Classi
fi
cation model ...21
2.1 Address
cleaning
...21
2.1.1 Using rough data extracted from WoS database ...21
2.1.2 Three step procedure ...21
2.1.3 Results of procedure ...23
2.2 Research
pro
fi
les ...23
2.3 Clustering...25
2.3.1 Hierarchical
clustering
...25
2.3.2 Number of clusters ...26
2.3.3 Eight cluster solution ...27
2.4 Classi
fi
cation model ...29
References ...31
3
The dynamic perspective on research performance ...33
3.1
Four basic principles ...33
3.1.1 National
situation
...33
3.1.2 Evolution
...33
3.1.3 Multiple indicators and
fi
eld differentiation ...34
3.1.4 Comparability
...34
3.2.1 Multiple indicators and
fi
eld differentiation. ...35
3.2.2 Comparability
...35
References ...37
4 Other
Applications
...39
4.1 Bibliometric
indicators
...39
4.2
Temporal analysis of research pro
fi
les dynamics ...40
4.2.1 Brazil
...40
4.2.2 Europe
...41
4.3 Collaboration
...42
References ...43
Appendix I 16
fi
elds used for journal classi
fi
cation
... 44II C
OREP
APERS...47
1 The
in
fl
uence of author self-citations on bibliometric
meso-indicators. The case of European universities ...49
1.1 Introduction
...50
1.2
Data sources and processing ...51
1.3 Methods
...52
1.4 Results
...53
1.5 Conclusions
...58
References ...60
2
A Structural Analysis of publication pro
fi
les for the classi
fi
cation of
European research institutes ...61
2.1 Introduction
...62
2.2
Data sources and processing ...63
2.3 Methodology
...63
2.3.1 Research
pro
fi
les ...64
2.3.2 The clustering procedure ...66
2.3.3 Predictive model ...68
2.4 Application
...70
2.4.1 National
comparison
...70
2.4.2 Pro
fi
le dynamics ...72
2.5 Conclusions
...73
References ...75
Appendix I ...76
3.1 Introduction
...78
3.2
Data sources and processing ...79
3.3
Bibliometric indicators used in the study ...80
3.4
Data analysis ...81
3.4.1 Bibliometric characteristics of pro
fi
le clusters ...81
3.4.2 National characteristics of pro
fi
le clusters ...83
3.4.3 Group-speci
fi
c characteristics in subject
fi
elds. The case of
chemistry ...84
3.5 Conclusion
...86
References ...87
Appendix I Tables presenting the mean and 95% Con
fi
dence Interval for
12 indicators used in this study...88
Appendix II Level of signi
fi
cance for Chi-Square of each indicator within
the given country ...92
4
Israeli Research Institutes: A Dynamic Perspective ...93
4.1 Introduction
...94
4.2
The dynamic perspective ...94
4.3
Data sources and data processing ...96
4.4
Methods and application ...97
4.5
The macro level: Israel as a country ...98
4.6
The meso level: Israeli institutes ...99
4.6.1 Tel
Aviv
University
...101
4.6.2 Hebrew
University
...102
4.6.3 Technion – Israel Institute of Technology ...103
4.6.4 Ben-Gurion
University
...104
4.6.5 Weizmann Institute of Science ...105
4.7 Conclusions
...106
References ...108
Appendix I ...109
5
A structural analysis of collaboration between European research
institutes ...111
5.1 Introduction
...112
5.2
Data sources, processing and methodology ...114
5.2.1 Collaborative
behaviour
...115
5.3 Results
...116
5.3.1 Publication
counts...116
5.4 Citation
indicators...118
5.5 Collaboration
patterns
...124
5.5.1 Measuring collaboration preferences ...125
5.6 Conclusion
...128
III F
UTUREP
ROSPECTS...133
1
Validation and extension of the classi
fi
cation model ...135
1.1
Validation based on other input variables ...135
1.1.1 Scopus
...136
1.1.2 Hybrid clustering ...136
1.2
Validation based on other entities or institutions ...137
References ...138
2
US research institutions ...139
2.1
Comparing US with Europe ...140
2.2 Enriched
data
...140
2.2.1 IPEDS
...140
2.2.2 Carnegie
classi
fi
cation ...141
2.2.3 WebCASPAR
...141
2.2.4 Research
questions
...141
References ...143
Appendix ...144
3 Collaboration
...147
3.1
Combination of types of collaboration ...147
3.2 Collaboration
patterns
...148
References ...150
Samenvatting ...151
Summary ...155
Curriculum Vitae ...159
1
G
ENERALI
NTRODUCTION1.1 Background
In the last decade several national systems or exercises to assess research performance of institutes of higher education were created. Policy makers nowadays are more and more faced with voters and taxpayers who ask for accountable government spending. One of the reasons is the limited availability of funds at government level (Hodges, et al. 1996) and policy makers have to take responsibility for the choices they make. Another reason is the demand for more competition and transparency in scientifi c research (Fisch and Daniel, 1986, 1988). Then, assessment of quality of research performance can be a fruitful tool in supporting the policy decisions and a transparent mechanism for distribution of research funding.
In the UK, the results of the 2008 Research Assessment Exercise (RAE) have been published recently. This RAE is a framework for the evaluation of research activities at UK higher education institutes using peer review. From 2010 onwards metrics will become an important element in the assessment of research in the fi elds of natural science, technology, engineering and medicine. In other fi elds, such as mathematics, social sciences, arts and humanities metrics will be used to inform peer review. Up to 2008 it was a qualitative exercise based on 67 units of assessment . The results, quality profi les, are used by the funding bodies.
Since 2004, the Research Quality Framework was developed in Australia and at the beginning of 2008 it was replaced by the Excellence in Research for Australia (ERA) initiative. In this new initiative both quantitative measures and peer review are combined. One of the leading Australian centres for systematic evaluation and mapping of research, the Research Evaluation and Policy Project (REPP) at the Australian National University in Canberra, recognises the value of both qualitative and quantitative approaches to research assessment.
The Performance Based Research Fund in New Zealand is a program to ensure excellence in research at institutes at higher education. The fi rst Quality Evaluation was completed in 2003, and then a partial round was held in 2006. The 2012 round will be a full round again. These research performance assessment are used as a base for the funding to reward quality of researchers.
The Norwegian Research Institute for Studies in Innovation, Research and Education (NIFU-STEP) receives grants from the Research Council of Norway to manage a comprehensive institutional publication database (FRIDA) which is used for institutional funding.
In 2004 the Italian government started the Three-Year Assessment Exercise (VTR). This exercises uses peer review to assess the research performance of academic institutes (both universities as well as public research agencies) (Reale et al., 2007)
In Flanders the BOF-key was developed to support research funding and policy making (BOF: Bijzonder Onderzoeksfonds, Special Research Funding). This key for the allocation of money to the Flemish universities includes publications and citation counts among other indicators. The fi rst time that funds were distributed based on this key was for fi scal year 2003 (Debackere & Glänzel, 2004).
The theme of research evaluation has already a long history in the fi eld of scientometrics. In the 1970s Francis Narin coined to concept ‘Evaluative Bibliometrics’ (Narin, 1976) and Garfi eld discussed whether citation analysis is a legitimate evaluation tool (Garfi eld, 1979). In the eighties and nineties many papers and books were published on this issue. The journal ‘Research Evaluation’, completely devoted to the topic, was founded in 1998. In 2006 the fi rst volume of the Scientometrics Guidebook Series was published. In this Guidebook 66 papers, all published in Scientometrics, about evaluations of individual scientists and research institutions were compiled. This extensive knowledge has been used in many evaluation projects at the national level or for individual institutions.
All the above mentioned developments focus on research performance at institutes of higher education. But these institutes do not have a monopoly on scientifi c research. Also hospitals, companies, government agencies, specialized institutes do publish and information on their performance can be relevant. Many of them even receive public funding for their research activities and are at some point eligible to assessment. Several other problems surface when looking in detail at some of the above mentioned methodologies. In the next section the most common problems are identifi ed. This thesis presents a framework for quantitative research evaluation that helps to solve these problems.
1.2
Common problems with research assessment
1.2.1 Field
dependence.
Calero et al (2008) analyse the research performance of 386 institutes and ranked them using bibliometrics indicators both on all fi elds combined and, separately, in oncology. They show that the average number of positions that universities move from one ranking to the other is 103 and they conclude that it would be appropriate to rank universities per research fi eld.
Only few of the above mentioned exercises use different methodologies for the assessment of performance in different fi elds in the sciences. Some of them, like BOF nowadays, include weighting schemes to correct for fi eld differences. Others apply different methodologies for the social sciences and humanities. However, the performance of institutions in sciences and life sciences is assessed without making a distinction between fi eld specialization of these institutions. Therefore the use of fi eld normalized indicators is crucial in the assessment of individual institutes. The Leiden ranking (CWTS, 2009) uses the CWTS crown indicator which is a fi eld normalized citation indicator (see Moed et al., 1995; van Raan, 2004).
1.2.2 Comparability
The national systems of research assessment have one big disadvantage in common. They are all just national systems. Trans-national comparison between institutes is diffi cult because as each country has its own system. This is especially a problem within Europe where the creation of the European Research Area (ERA) and the Bologna process try to develop a completely integrated European system of higher education which makes trans-national comparisons between institutes crucial to policy makers and stakeholders (Bonaccorsi et al. 2007).
Also the above mentioned relation between fi eld and research activity has infl uences on the validity of comparisons between institutes. A comparison of bibliometrics indicators between institutes can only lead to valid results if these institutes are active in similar fi elds. This requirement is not often met both in national exercises and in ranking schemes.
1.2.3 Quantitative versus qualitative approach
In research evaluation there is an ongoing debate about quantitative versus qualitative approach. Up to 2008 the RAE had a qualitative approach with peer review. The next round, in 2010, standard quantitative indicators for the assessment of performance in the fi elds of natural sciences, technology, engineering and medicine will be applied and will play an important role. For fi elds in the Social Sciences, Arts and Humanities a combination of both approaches will be used while keeping the role of peer review central.
This is in line with recommendation by many authors. For instance, Debackere and Glänzel (2004) state that qualitative and quantitative methods in science studies should complement each other. Moed (2007) makes suggestions for the combination of bibliometric indicators and the peer-review process. Butler (2007) held also a plea for a balanced approach
In this thesis, I focus on the quantitative component of the evaluative process which will be embedded in a international context using state of the art bibliometric indicators. It has to be stressed that the presented classifi cation system and dynamic perspective alone cannot serve as a standalone system for the evaluation of individual researchers or research institutions but that it should be combined with qualitative approaches like peer review or others.
1.3
Introduction in bibliometrics
Because of the focus on the quantitative component in this dissertation a short introduction on bibliometrics is given.
1.3.1 Defi nition and history
Several defi nitions of the term ‘Bibliometrics’ are proposed. The French word ‘Bibliometrié’ was introduced by Paul Otlet in 1934. The English term appeared in the Journal of Documentation in 1969. It was proposed by Alan Pritchard and also used in the title of a paper by Robert Fairthorne. Pritchard (1969) defi ned bibliometrics as
‘...the application of mathematical and statistical methods to books and other media of communication’.
Around the same time Nalimov and Mulchenko (1969) introduced the term ‘Scientometrics’ as
‘...the application of those quantitative methods which are dealing with the analysis of science viewed as an information process’.
Many others gave defi nitions of the term ‘Bibliometrics’, eg. Fairthorne (1969), Hawkins (1977), Burton (1988), Egghe (1988), Tague-Sutcliffe (1992). Broadus (1987) wrote a paper on the defi nition of bibliometrics. He examined and evaluated several defi nitions and proposed a new one:
‘(It is) the quantitative study of physical published units, or of bibliographic units or surrogates of either’.
The discoveries of distributions or laws in statistical analysis of scientifi c literature were of great importance to the development of the fi eld (Hood, 2001). Lotka stated in 1926 that (Lotka’s Law):
‘the number (of authors) making n contributions is 1/n² of those making one’.
A few years later Bradford (1934) wrote:
‘a given subject, they may be divided into a nucleus of journals more particularly devoted to the subject and several groups or zones containing the same number of articles as the nucleus when the numbers of periodicals in the nucleus and the succeeding zones will be as 1: b : b² …’.
Zipf’s Law (Zipf, 1949) concerns word frequency but can be seen as a more general form of the two other laws. rf=C, where r is the rank of a word, f is the frequency and C is a constant. Lotka’s Law can be rewritten as a special case of Zipf’s Law as YXn=C with Y=the number of authors with X articles, C=number of authors with only 1 article and n=2.
The publication of Derek de Solla Price’s book ‘Little Science – Big Science’ (1963) indicated a revolution. Science as it was known before came to its end. It had taken such a sharp rise after World War II that existing systems for information retrieval failed and funding and evaluation based on personal knowledge and peer reviews became more and more diffi cult (Glänzel, 2008
From the seventies onward the growth of the fi eld really took off. Scientists active in all kinds of fi elds got interested in bibliometrics and applied their knowledge to the study of science and scientifi c communication. The input from these researchers with such a diverse background (Mathematics, Sociology, Psychology, History of Science or even Chemistry) made bibliometrics to the multidisciplinary fi eld it is today. With the creation of the journal Scientometrics in 1979 and fi rst international conferences at the beginning of the eighties a distinct discipline was established (Glänzel, 2008).
1.3.2 Bibliographic
databases
The fi rst important database containing bibliographic data –the Science Citation Index, SCI– was created by the Institute for Scientifi c Information (ISI) in Philadelphia (PA, USA). It had several advantages over other bibliographic indexes at that time. It was a multi-disciplinary database, it contained information on all authors and all addresses in the by-line of a paper. But most important, it contained all references included in a paper. This information allows to track down all the cited papers and create links between citing and cited publications. Other databases like MEDLINE, INSPEC or Chemical Abstracts lack this completeness of information. Upon its conception the founder of ISI, Eugene Garfi eld, created metrics to measure the impact of journals enabling him to decide whether journals were important or relevant enough to be indexed in the database. This database was later expanded (SCI-E) and additional sources were added with the Social Science Citation Index and the Arts & Humanities Citation Index. Nowadays, ISI is part of Thomson Reuters and the database is accessible through a web interface Web of Science (WoS) which itself is part of a larger research information platform Web of Knowledge (WoK).
In 2002 the publisher Elsevier started with the creation of its own multi-disciplinary database ‘Scopus’ which was launched at the end of 2004. It claims to be the largest abstract and citation database of research literature and quality web sources. It does not only include papers published in journals but also results from web pages and patents. Elsevier aimed at creating a database with a broad coverage. This is confi rmed by a study of Lopez-Illescas et al. (2008) in which they found that oncology journals covered in the Web of Science is a subset of the journals covered in Scopus. Scopus covered 106 additional oncology journals. Despite this broader coverage, the SCImago Journal Rank correlates high with WoS-based impact factors. So it remains unclear what the benefi ts are of this broader coverage for bibliometric studies. Furthermore, because the fi erce competition between Elsevier and Thomson Reuters, it remains to be seen which of the databases (Scopus or WoS) will end up with the broadest coverage.
Google Scholar is a freely available alternative to the above mentioned fee-based databases. It was launched in the same month as Scopus (November 2004) (Payne, 2004; Bar-Ilan, 2008). Data is indexed if an abstract is online available to non-subscribers of the journal who come from Google and Google Scholar. However, Jasco (2006) pointed out several shortcomings and inconsistencies of Google Scholar, at that time for instance ‘I Introduction’ was indexed as an author of a huge number of papers.
based on Google Scholar data. Their study shows a convergent validity of the citation analysis from the fee-based databases but a lack for the analysis based in Google Scholar.
Based on the existing literature and our own long experience with the use of the Web Of Science we are confi dent that it is a legitimate choice to use this database for evaluative purposes. Its features comply with the requirements of bibliometric methodology.
1.3.3 Indicators and bibliometric tools
The fi rst unit of analysis in bibliometric studies is the published paper. For one paper several variables can be collected: number of authors, number of addresses (institutions, cities, countries) involved, number of citations received within a certain time frame, expected citation rate based on journal or fi eld, discipline classifi cation. These variables can be aggregated at three subsequent levels:
• Micro level: Publications of individual researchers or research groups • Meso level: Publications of institutions or large departments or faculties.
Studies of individual journals are also regarded as belonging to the meso level
• Macro level: studies at regional or national level or higher aggregations, fi eld or discipline studies.
Each of these levels demands for its own approach. It is obvious that evaluative studies at the micro level require retrieval and cleaning procedures with the highest possible accuracy while at the macro level these studies are less prone to data retrieval errors. At each level a different implementation of bibliometric concepts can be appropriate. A self-citation occurs whenever an entity refers in one of its papers to another paper that is assigned to the same entity. This defi nition can be applied to authors or journals or institutions but evidently these choices require other computations.
For the calculation of research productivity different counting schemes can be applied. These schemes refer to the rules used to count the publications assigned to the entity under study (Glänzel, 2008).
Fractional counts: In this scheme the contribution of one entity is fractionated by the total number of involved entities, they share one publication or citation. The advantage of this scheme is that the share of entities at one level can be added up at a higher level of aggregation. However this does not hold in all cases and can be problematic sometimes, e.g. one single author with appointments at two different institutions in different countries both mentioned on one publication.
in some fi elds or institutions it is common to list the authors in alphabetical order which makes the notion and thus the counting scheme invalid. The scheme is unavoidably used when the bibliographic database does not include all addresses.
Full or integer counting: The publication is counted as full for each of the unique contributing entities, which can be institutions, institutes, authors and countries. One could say that with this scheme contributions to just the paper itself are counted. If someone’s name (or an institution) appears in the heading of a paper this means that he (it) has contributed. This is a binary variable. As it is impossible to measure the exact share of contribution of each entity involved in an automated manner many authors apply this scheme in their studies nowadays.
Once publications are assigned to entity different indicators can be used to present and compare publication activity. These indicators can be used to express the number of publications per author, institution, country, fi eld or journal. As special cases, the number of uncited as well as the number of highly cited papers (during a specifi c time window) can also be reported. It also allows ranking the entities with respect to their output. Different types of indicators are possible.
Absolute indicators give the mere number of output produced by the unit. Sometimes they can be quite impressive but they are hardly informative on the position of the entity in comparison to its peers or competitors. Relative indicators relate a entity’s performance with a specifi c reference. This reference can be located either within or outside of the entity under study. For instance the share of international publications of an institution relates the number of internationally co-authored papers to the total output of that institution which is an internal reference.
A special relative indicator is the Activity index introduced by Frame (1977) and later applied in macro studies by Schubert et al. (1989). This indicator is defi ned as the ratio between the share of the given unit in publications in the given fi eld and the overall share of the unit in publications.
This enables the creation of publication profi les of a unit by discipline and indicates whether the unit has a higher or lower activity in a fi eld compared its overall share in the total output. This improves the comparability between units with respect to their activities across fi elds.
Another possibility to improve the comparability between units is to use ranks instead of (absolute or relative) frequency counts. The above mentioned distributions (Lotka, Bradford and Zipf) are attempts to rank on authors, journals or words. However, ranking easily becomes problematic when using multiple indicators to describe and compare publication activity. Thus, a multidimensional space could be used to plot the units or indicators could be combined or aggregated into one single indicator using different weightings. But none of these solutions enhances the understanding of the relation between the units.
‘If Paper R contains a bibliographic footnote using and describing Paper C, then R contains a reference to C, and C has a citation from R.’
Next to this operational defi nition of citations there was a long and still is an ongoing discussion on the meaning of citations. Also in the discussion on citations the truly multidisciplinary nature of the fi eld is revealed. Merton (1973) and Kaplan (1965) gave a sociologically explanation to citations as the giving of recognition to which the scientist is obliged (Wouters, 1999).
Moed (2005) added a cognitive dimension to the discussion by interpreting citations as:
‘…manifestations of intellectual infl uence, even though such infl uence may not directly be traced from the citing texts. They can be viewed as instances of citing authors’ socio-cognitive location that refl ect their awareness of what are the important groups or programmes that must be included in their reference lists.’
In his book on citation analysis Moed (ibid.) outlines the different views on citation and citation analysis and he concludes that all these perspectives are valid as they all point out different aspects of referencing practices. It is therefore impossible to have one single theoretical concept to express what citations measure.
Cozzens (1989) referred to the primarily rhetoric nature of citations where the reward comes only secondarily. This discussion on opposite viewpoints on citations is still lively going on in an online mailing list (Sigmetrics, see http:// web.utk.edu/~gwhitney/sigmetrics.html).
More pragmatically was the interpretation of citations by Glänzel and Schoepfl in (1999):
‘one important form of use of scientifi c information within the framework of documented science communication’
As part of this debate on the meaning of citations some authors investigated the reasons for citing published research. Garfi eld (1965) and somewhat later Weinstock (1971) compiled a list of 15 reasons for citing publications:
1. Paying homage to pioneers 2. Giving credit for related work
3. Identifying methodology, equipment, … 4. Providing background reading
5. Correcting one’s own work 6. Correcting the work of others 7. Criticizing previous work 8. Substantiating claims
10. Providing leads to poorly disseminated, poorly indexed or uncited work
11. Authenticating data and classes of facts
12. Identifying original publications in which an idea or concept was discussed
13. Identifying original publications or other work describing an eponymic concept or term
14. Disclaiming work or ideas of others (negative claim) 15. Disclaiming priority claims of others (negative homage).
Some of the reasons listed above have indeed a rhetoric nature as claimed by Cozzens but other reasons are easily understood as rewarding. The list thus stresses the complementarity of the two viewpoints. It also helps to understand that citation indicators have to interpreted much broader than mere ‘quality measures’. It is more the reception or use of information that can be captured. Braun et al. (1985) stated this as follows:
‘if a paper receives 5 or 10 citations a year throughout several years after its publication, it is very likely that its content will become integrated into the body of knowledge of the respective subject fi eld; if, on the other hand, no reference is made at all to the paper during 5 to10 years after publication, it is likely that the results involved do not contribute essentially to the contemporary scientifi c paradigm system of the subject fi eld in question’
Also van Raan (1998, 2004) sees enough evidence to conclude that references motives as mentioned above are not randomly given and thus the phenomenon of citation can play its role as reliable measure of impact.
It is this pragmatic perspective on citations that is taken in this thesis and which permits the use of citation indicators in the quantitative component of a research evaluation exercise. A broad range of indicators is chosen with the emphasis on relative indicators. Relative citation indicators compare the total citation count of a unit with a reference standard set by a journal or a fi eld.
1.3.4 Applications of bibliometrics
analyses papers cited by the same paper while the latter one starts from papers that share at least one reference. Small and Sweeney (1985) used single linkage clustering to sequentially link co-cited papers. This results in sets of clustered publications –core papers- and publications in a cloud citing at least one in a cluster (Oberski, 1988, Braam et al. 1988). Using multidimensional scaling and visualization techniques these clusters and relations can be plotted in maps which can enhance the understanding of the structure and dynamics of science.
A second application of bibliometric tools is in description and evaluation of research performance. It was Price (1963) again who fi rst pointed out the possibilities of quantitative studies of science in evaluation and policy. A few years earlier, in 1957, had the launch of the Sputnik increased the pressure on western governments, scientists and military: the ‘Sputnik shock’ (Leydesdorff, 2005). A consequence was the reorganization of both the education and the science system. NASA was created and the budget of the National Science Foundation was increased by nearly $100 million. One decade later, at the end of the sixties, funding for research was decreasing drastically again in a response to economic diffi culties and the huge costs of the Vietnam War. This created the need to provide both policy makers and the general public with objective data on the health, quality and competitiveness of research in the US (Braun, 1985). In a response to this need the National Science Foundation published the book ‘Science Indicators 1972’ (NSF, 1973). These volumes were published bi-annually and SCI data provided by ISI was used to calculate the scientometric indicators. It was Narin (1976) who introduced the term ‘Evaluative Bibliometrics’. Both publication and citation indicators are valuable in the evaluation of science. Publication indicators measure the scientifi c activity while scientifi c achievement or merit can be expressed by citation indicators (Moed, 1989). Recently Bornmann (2009b) proposed the use of pairs of indicators to cover both aspects as a meaningful approach for comparing scientists. The discussion on the role of citations is described above.
A third application is the use of bibliometric indicators in library management. The indicator most widely used in library science is the Impact Factor as introduced by Garfi eld (1955). It is defi ned for a journal X in year n as
The total number of citations from SCI-covered journals in a given year n to all [citable] papers published in journal X in years n-1 and n-2 divided by the total number of [citable] papers in journal X published in years n-1 and n-2.
et al. (1994) related the bibliometric data available in the Journal Citation Report (JCR) with what they called bibliotheconomic data (subscription prices, prices per article, holdings, etc.).
Although the main theme of this thesis focuses on the area of research assessment and evaluation, the classifi cation model applied on research institutions also can help in the understanding of the structure of science and the relation between different institutions.
1.4
A dynamic perspective based on a structural analysis of
institutional research profi les
This thesis presents a new methodology that can be used in quantitative assessment exercises of individual institutions and in institutional evaluation at national level. It aims at solving the problems mentioned above and implementing state of the art bibliometric methodologies..
For individual assessment of research performance we recommend also a qualitative counterpart which could confront the management with quantitative fi ndings.
First, a classifi cation model was built in order to create groups of likewise institutes. This grouping tackles the issues of fi eld dependence of indicators and inter-institute comparability. This clustering of research profi les will be called structural analysis throughout the thesis.
The other crucial element in the methodology is the dynamic perspective. In this perspective four principles of good evaluative practice are combined.
The idea for the creation of this methodology originated after two successful applications of the clustering of institutes. A fi rst paper appeared in 2006 on the infl uence of author self-citations at the meso-level (see part II, chapter 1) . Later, in a paper on Brazilian institutes this clustering was used again to give better understanding of the structure or profi le of research in this country.
At the S&T Indicators Conference in Leuven (sept. 2006) a fi rst step towards the fi nal version of the classifi cation model was presented. A fully elaborated description appeared in 2008 in Scientometrics (see part II, chapter 2).
At the S&T Indicators conference in Vienna, (july 2008), the fi rst application of this dynamic perspective was presented. The research performance of fi ve Israeli institutes was examined and discussed. This paper will be publish in Research Evaluation (see part II, chapter 4).
1.5
Framework of the thesis
This thesis consists of the following three parts: I Backgrounds, Models and Applications; II Core papers; and III Future Prospects. The fi rst part (in which we are now) contains four chapters. First, a general introduction on current research evaluation studies and on quantitative studies of publications and citations –particularly bibliometrics- is discussed in this chapter. Then, the next chapter presents the classifi cation model. It also describes the address cleaning procedure that is used as this is an absolute necessary condition in order to get valid results on institutional performance. A detailed description of the three versions of the clustering procedure is provided and the last section deals with the discriminant analysis used for the creation of the classifi cation model.
The main goal in mind when developing this model was to improve the comparability and assessment of institutional research performance. This application is presented in the third chapter on the dynamic perspective on research performance.
In the fourth and last chapter of the fi rst part we will particular focus on important issues such as the improvement of bibliometric indicators; patterns of changing research profi les; and differences in collaborative behavior.
In the second part, the core of this thesis, fi ve papers published (or accepted for publication) in international refereed journals are included:
• The infl uence of author self-citations on bibliometric meso-indicators. The case of European universities; published in Scientometrics, 66(1), 71-80
• A Structural Analysis of publication profi les for the classifi cation of European research institutes; published in Scientometrics, 74(2), 223-236
• A structural analysis of benchmarks on different bibliometrical indicators for European research institutes based on thbeir research profi le; published in Scientometrics, 79(2), 377-388
• Israeli Research Institutes: A Dynamic Perspective; accepted for publication in Research Evaluation.
• A structural analysis of collaboration between European research institutes; accepted for presentation at the ISSI 2009 conference, Rio de Janeiro, Brazil and submitted to Research Evaluation.
References
Bar-Ilan, J. (2008), Which h-index? – A comparison of WoS, Scopus and Google Scholar, Scientometrics, 74(2), 257-271.
Bonaccorsi, A., Daraio, C., Lepori, B., Slipersaeter, S. (2007), Indicators on individual higher education institutions: addressing data problems and comparability issues, Research Evaluation, 16(2), 66-78.
Bornmann, L., Marx, W., Schier, H., Rahm, E., Thor, A., Daniel, HD. (2009a), Convergent validity of bibliometric Google Scholar data in the fi eld of chemistry-Citation counts for papers that were accepted by Angewandte Chemie International Edition or rejected but published elsewhere, using Google Scholar, Science Citation Index, Scopus, and Chemical Abstracts, Journal of informetrics, 3(1), 27-35.
Bornmann, L., . (2009b), Do we need the h-index and its variants in addition to standard bibliometric measures, Journal of the American society for
information science and technology, 60(6), 1286-1289.
Braam, R.R., Moed, H.F., Van Raan, A.F.J. (1988), Mapping of Science: Critical Elaboration and new Approaches, A Case Study in Agricultural Biochemistry, Informetrics, 87/88, 15-28.
Bradford, S.C. (1934), Sources of information on specifi c subjects, Engineering,
137: 85-86.
Braun, T., Glänzel, W., Schubert , A. (1985), Scientometric indicators. A 32-Country Comparative Evaluation of Publishing Performance and
Citation Impact. World Scientifi c Publishing, Singapore.
Broadus, R.N. (1987), Towards a defi nition of ‘bibliometrics’, Scientometric, 12,
373-379.
Burton, H.D. (1988), Use of a virtual information system for bibliometric analysis, Information Processing and Management, 24, 39-44.
Butler L. (2007), Assessing university research: a plea for a balanced approach,
Science and Public Policy, 34(8), 565-574.
Calero-Medina, C., Lopez-Illescas, C., Visser, M.S., Moed, H.F. (2008), Important factors when interpreting bibliometric rankings of world universities: an example from oncology, Research Evaluation, 17(1),
71-81.
Cozzens, S.E. (1989), What do citations count? The rhetoric-fi rst model,
Scientometrics, 15, 437-447.
Cronin, B. (1981), The need for a theory of citation, Journal of Documentation,
CWTS (2009), The Leiden Ranking 2008, (accessible via http://www.cwts.nl/
ranking/LeidenRankingWebSite.html ).
Debackere, K., Glänzel, G. (2004), Using a bibliometric approach to support research policy making: The case of Flemish BOF-key, Scientometrics,
59(2), 253-276.
Egghe, L. (1988), On the classifi cation of the classical bibliometric laws,
Journal of Documentation, 44, 53-62.
Fairthorne, R.A. (1969), Empirical hyperbolic distributions (Bradford-Zipf-Mandelbrot) for bibliometric description and prediction, Journal of
Documentation, 25, 319-343.
Fisch, R., Daniël, H.D. (1986), Messung and förderung von forschungsleistung,
Konstanzer beiträge zur sozialwissenschaftlichen forschung, Band 2,
Universitätsverlag, Konstanz.
Fisch, R., Daniël, H.D. (1988), Evaluation von Forschung, Beiträge zur
socialwissenschaftlichen forschung, Band 4, Universitätsverlag,
Konstanz.
Frame, J.D. (1977), Mainstream research in Latin America and the Caribbean,
Interciencia, 2, 143-148.
Garfi eld, E. (1955), Citation Indexes for Science. A New Dimension in Documentation through Association of Ideas. Science, 122, 108-111.
Garfi eld, E. (1965), Can citation indexing be automated? In Stevens, M.E. and Giuliano, V.E. (Eds.), Statistical association methods for mechanized
documentation, National Bureau of Standards, Washington, DC.
Garfi eld, E. (1979), Is citation analysis a legitimate evaluation tool?
Scientometrics, 1(4), 359-37 .
Glänzel, W., Schoepfl in, U. (1999), A bilbiometric study of reference literature in the sciences and social sciences, Information Processing and
Management, 35(1), 31-44.
Glänzel, W. (2008), Bibliometrics as a research fi eld. A course on theory and
applications of bibliometric indicators. KU Leuven, Leuven.
Hawkins, D.T. (1977), Unconventional uses of on-line information retrieval systems: on-line bibliometric studies, Journal of the American Society
for Information Science, 28, 13-18.
Hodges, S., Hodges, B., Meadows, A.J., Beaulieu, M., Law, D. (1996), The use of an algorithmic approach for the assessment of research quality,
Hood, W.W., Wilson, C.S. (2001), The literature of bibliometrics, scientometrics, and informetrics, Scientometrics, 52(2), 291-314.
Jasco, P. (2006), Defl ated, infl ated and phantom citation counts, Online
Information Review, 30(3), 297-309.
Kaplan, N. (1965), ‘Prolegomena to the footnote’, American Documentation, 16,
179–187.
Leydesdorff, L. (2005), Evaluation of research and evolution of science indicators, Current Science, 89(9), 1510-1517.
Liu, N.C., Cheng, Y. (2005), Academic Ranking of World Universities – Methodologies an Problems, Higher Education in Europe, 30(2).
Lopez-Illescas, C., Moya-Anegon, F., Moed, H.F. (2008) Coverage and citation impact ofoncological journals in the Web of Science and Scopus, Journal
of Informetrics, 2 (4), 304-316.
Lotka, A.J. (1926), The frequency distribution of scientifi c productivity, Journal
of the Washington Academy of Science, 16(12), 317-323.
Merton, R.K. (1973), The normative structure of science, University of Chicago
Press, Chicago.
Moed, H.F. (1989), The use of bibliometric indicators for the assessment of
research performance in the natural and life sciences (PhD-thesis),
DSWO Press, Leiden.
Moed, H F., De Bruin, R.E., Van Leeuwen, TH.N. (1995), New bibliometric tools for the assessment of national research performance: database description, overview of indicators and fi rst applications, Scientometrics,
33 (3), 381-422.
Moed, H.F. (2005), Citation Analysis in Research Evaluation, Springer,
Dordrecht.
Moed, H.F. (2007), The future of research evaluation rests with an intelligent combination of advanced metrics and transparant peer review, Science
and Pulic Policy, 34(8), 575-583.
Nacke, O. (1979), Informetrie: Ein neuer Name für eine neue Disziplin,
Nachrichten für Dokumentation, 30, 212-226.
Nalimov, V.V., Mulchenko, Z.M. (1969), Naukometriya. Izuchenie Razvitiya Nauki kak Informatsionnogo Protsessa. [Scientometrics. Study of the
Development of Science as an Information Process], Nauka, Moscow,
Narin, F. (1976), Evaluative Bibliometrics: The use of Publication and Citation
Analysis in the Evaluation of Scientifi c Activity, Computer Horizons,
Inc., Cherry Hill.
Oberski, J.E.J. (1988), Co-citation Cluster Analysis and Dutch Physics. In: van Raan, A.F.J (Ed.), Handbook of Quantitative Studies of Science &
Technology, Elsevier Science Publishers bv, Amsterdam.
Otlet, P. (1934), Traite de Documentation. Le livre sur le livre. Theorie et
pratique, Van Keerberghen, Brussel.
Payne, D. (2004), Google Scholar welcomed, News from The Scientist, 5(1):
20041123 01. Retrieved May 13, 2009, from http://www.the-scientist. com/news/20041123/01/.
Pritchard, A. (1969),Statistical bibliography or bibliometrics?, Journal of
Documentation, 25, 348-349.
Price, D. de Solla, (1963) Little Science, Big Science, Columbia Univ. Press,
New York.
Price, D. de Solla, (1970), Citation measures of hard science, soft science,
technology and non-science, D.C. Heath & Co., Lexington, MA.
Price, D. de Solla. (1976), A general theory of bibliometric and other cumulative advantage processes. Journal of the American Society for Information
Science, 27, 292–306.
Reale, E. Barbara A., Costantini, A. (2007), Peer review for the evaluation of academic research: lessons from the Italian experience, Research
Evaluation, 16 (3), 216-228.
Schubert, A., Braun, T. (1986), Relative Indicators and Relation Charts for comparative assessment of publication output and Citation Impact,
Scientometrics, 9 (5-6), 281-291.
Schubert, A., Glänzel, W., Braun, T. (1987), Subject Field Characteristic Citation Scores and Scales for Assessing Research Performance, Scientometrics,
12 (5-6), 267-292.
Schubert, A., Glänzel, W., Braun, T. (1989), World fl ash on basic research: Scientometric datafi les. A comprehensive set of indicators on 2649 journals and 96 countries in all major science fi elds and subfi elds, 1981-1985, Scientometrics, 16(1-6), 3-478.
Schubert, A., Braun, T. (1996), Cross-Field Normalization of Scientometric Indicators, Scientometrics, 36(3), 311-324.
Smith, L.C. (1981), Citation Analysis, Library Trends, 30(1), 85.
Tague-Sutcliffe, J.M. (1992), An introduction to informetrics, Information
Processing & Management, 28, 1-3.
Van Hooydonk, G., Gevaert, R., Milis-Proost, G., Van De Sompel, H.,
Debackere, K. (1994), A bibliometric analysis of the impact factors of scientifi c disciplines, Scientometrics, 30(1), 65-81.
van Raan, A.F.J. (2004), Measuring Science. Capita Selecta of Current Main Issues. In: Moed, H.F., Glänzel, W., Schmoch, U. (Eds.), Handbook
of Quantitative Science and Technology Research, Kluwer Academic
Publishers, Dordrecht.
Weinstock, N. (1971), Citation Indexes, In: Kent, A. (Ed.), Encyclopedia of
Library and Information Science, Marcel Dekker, New York.
Wouters, P. (1999), The Citation Culture (Doctoral Thesis), Private edition.
Zipf, G.K. (1949), Human behavior and the principle of least effort,
2
C
LASSIFICATION MODELOne of the goals of the development of the classifi cation model is to enhance comparability in evaluative studies of research institutes As stated above institutes of higher education do not have a monopoly on scientifi c research and are not the only organizations that receive public funding for their research activities. Therefore this model is not limited to these institutes of higher education but is applied to all organizations that publish research papers in scientifi c journals.
In this thesis both terms institute as institution can be used to indicate organizations that publish scientifi c research papers.
2.1 Address
cleaning
One of the major tasks prior to the creation of the classifi cation model is the assignment of papers to institutes. This is a crucial and vital step in the complete analysis. If we would be unable to assign publications to institutes at acceptable and satisfying level any statement about these institutes research performance would be invalid. For this reason it is appropriate to give some insight in the procedures used to clean the data.
This project started in 2004 with the creation of the fi rst version of a cleaning procedure. At this stage it was applied to a few European countries. In a next phase the methodology was applied to Brazilian institutes as joint work with Jaqueline Leta resulting in two papers (Glänzel, et al., 2006 and Leta et al., 2006). The procedure was then extended to EU15-counties and some Eastern European countries. France and UK appeared to be diffi cult to handle.
2.1.1 Using rough data extracted from WoS database
One of the advantages of the Web of Science (WoS) database is that the full address information of all addresses in the by-line of a paper is recorded. These addresses are stored twice in the database. First, it is stored as a ‘full address’ just as it appears on the paper and next it is stored in a parsed form. Here some additional parsing of the address information in subfi elds is done by Thomson Scientifi c. The name of the institute, department, street, zip code, city, state, country are extracted from the full address. From 1998 onwards, additional information on department (at 3 levels) is extracted from the street fi eld. The fi rst fi eld in the parsed address is crucial in our cleaning procedure
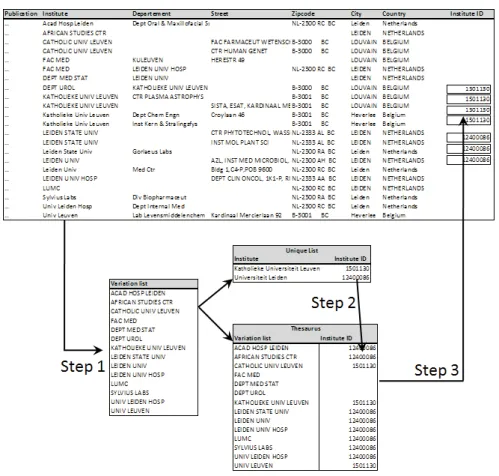
2.1.2 Three step procedure
Step 1: A list with variations is created. All addresses from one country are selected. These addresses are used to create a list of all possible distinct occurrences in the institute fi eld. We assume that this list contains all synonyms and spelling variance of the institutes. It is also counted how many times each of these distinct names occur in the total set of addresses. Only those names with a reasonable frequency are selected for the next steps
Fig. 1. Schematic overview of the three-step procedure
Step 3: Addresses are matched with the thesaurus. All addresses from the selected county are matched against the thesaurus. Here not only the institute fi eld in the parsed address entry is used but also the three department and the street fi elds are included in the cleaning procedure. Figure 1 gives a schematic overview of these three steps.
2.1.3 Results of procedure
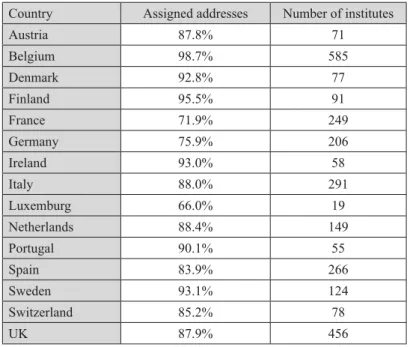
Table 1 gives the result of the cleaning procedure for 15 selected European countries. For all countries (except Luxemburg) more than 70% of all addresses were assigned to an institution. For many countries the share of assigned addresses is even above 85%. From our experience with Belgian addresses where 98.7% was assigned we conclude that the remaining part of addresses often belongs to either small organizations or private persons or companies that publish a few papers.
Country Assigned
Addresses
Number of Institutes
Austria 87.8% 71
Belgium 98.7% 585
Denmark 92.8% 77
Finland 95.5% 91
France 71.9% 249
Germany 75.9% 206
Ireland 93.0% 58
Italy 88.0% 291
Luxemburg 66.0% 19
Netherlands 88.4% 149
Portugal 90.1% 55
Spain 83.9% 266
Sweden 93.1% 124
Switzerland 85.2% 78
UK 87.9% 456
Table 1. Results of address cleaning procedure in 15 European countries
Of course, when publication data is used for funding or evaluation of individual institutes, one should aim at collecting all publications of an institution.
2.2 Research
profi les
the natural and life sciences (13 fi elds), social sciences (2 fi elds) and humanities (1 fi eld) as developed in Leuven and Budapest is applied. (Glänzel & Schubert, 2003).
A research profi le can be seen as a vector in the ‘fi eld-space’ representing the share of each of the 16 fi elds in the total set of publications of the specifi c institute.
Agriculture Biology BioSciences Biomedical Research General & Internal Medicine Non-internal Medical Specialties Neuroscience & Behavior Chemistry
K.U.Leuven 6% 9% 14% 8% 17% 15% 6% 16%
Institut Français de recherche
pour l’exploitation de la Mer 29% 45% 10% 3% 3% 1% 0% 8%
TU Delft 8% 4% 3% 2% 0% 2% 1% 33%
Karolinska Institutet 1% 7% 18% 14% 33% 37% 13% 3%
Physics Geo & Space Sciences Engineering Mathematics General, Regional & Community issues Economical and Political issues Arts & Humanities Multidisciplinary
K.U.Leuven 15% 3% 10% 4% 3% 3% 3% 1%
Institut Français de recherche
pour l’ exploitation de la Mer 3% 31% 4% 0% 0% 0% 0% 1%
TU Delft 31% 8% 30% 7% 2% 1% 1% 1%
Karolinska Institutet 1% 0% 1% 0% 2% 0% 0% 2%
Table 2. Research profi le of 4 different research institutes
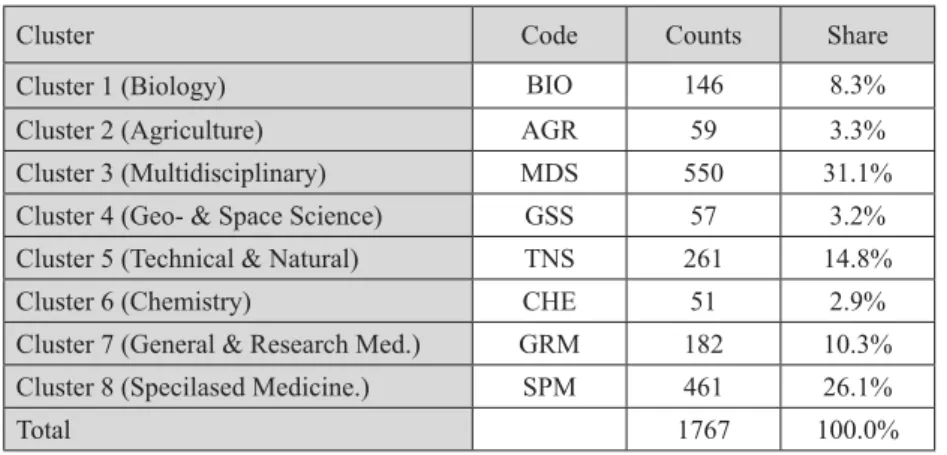
with publication output above a given threshold are selected. In the fi nal version of the classifi cation model 1767 institutes were used to create groups of likewise institutes.
Of course, this research profi le can be calculated for each set of publications, by country, institute, author and over any publication window. Table 2 gives the research profi les of 4 different research institutes.
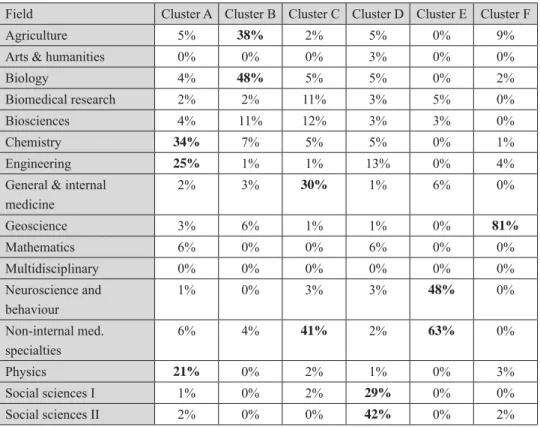
In the fi rst version of the classifi cation model –described in the paper about self-citations at the meso level, see Part II, chapter 1- a principal component analysis (PCA) was performed in order to reduce the number of variables or fi elds. This resulted in 9 components accounting for 76,7% of the total variance in the data. After further analysis (rotation) of these components, scores were calculated for all institutes. However, in later studies this PCA was abandoned as it did not have any added value for the analysis. It only reduced the available information that could be used for the clustering.
We also tried to use a broader classifi cation system (60 subfi elds, or even the 200 WoS journal categories) but this resulted often in vectors containing too many zeros and thus complicating needlessly the clustering.
2.3 Clustering
In order to create groups of institutes a cluster analysis is most appropriate. Of course a more diffi cult choice concerns the methodology, algorithm and distance measures and fi nal number of clusters. Several different models were used and tested. As mentioned above, a fi rst version used the data after PCS. Then a second version of the model was used in the paper on Brazilian institutions (Leta et al, 2006). These models were then adapted and improved. Proper testing and validation was done and the fi nal version was published in Scientometrics in 2008. Because hierarchical clustering was chosen the fi rst model can be derived from the fi nal one by aggregating at a higher level. However, the ‘stopping rules’ applied in the cluster algorithm suggest a eight cluster solution instead of the six clusters used in the fi rst version.
2.3.1 Hierarchical
clustering
tends to create one large group and several smaller ones. This is also the case with the clustering of institutes. However, extensive validating was done and Ward algorithm gave the most satisfying results.
2.3.2 Number of clusters
Crucial in a cluster analysis is the choice of number of cluster. With hierarchical clustering at each step in the procedure one has to decide whether or not to stop with partitioning. Several stopping rules for hierarchical clustering are developed by many authors. Others authors elaborated on the evaluation and comparison of these rules. Milligan and Cooper (1985) have compared 30 different methods for the estimation of optimal number of clusters.
Fig. 2. Results of two stoppings rules
In the fi rst and second version of the classifi cation these statistical rules were not used, only inspection of different cluster solutions was applied to judge the best number of cluster.
non-medical institutions. This rough classifi cation is trivial and proved not to be useful for the grouping of institutes with a similar research profi le. The Duda-Hart Je(2)/ Je(1) suggests eight clusters as the second optimum solution.
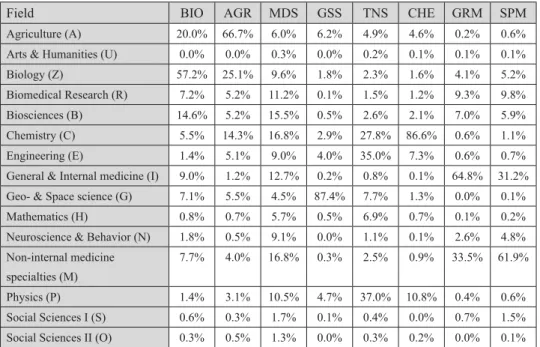
2.3.3 Eight cluster solution
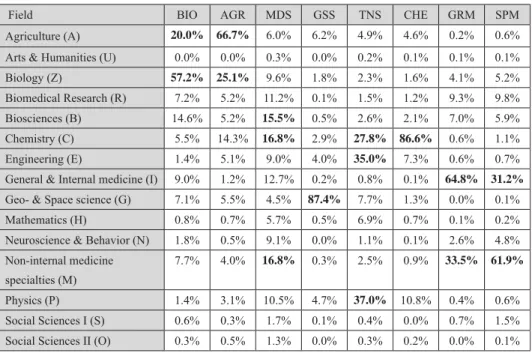
These eight clusters can be characterised by the average research profi le of the members of the respective cluster: Biology (1. BIO), Agriculture (2. AGR), Geo- and Space sciences (4. GSS), Technical and Natural sciences (5. TNS), Chemistry (6. CHE), General and Research Medicine (7. GRM), Specialised Medical (8. SPM) and a cluster with institutes having a Multidisciplinary profi le (3. MDS).
Field BIO AGR MDS GSS TNS CHE GRM SPM
Agriculture (A) 20.0% 66.7% 6.0% 6.2% 4.9% 4.6% 0.2% 0.6%
Arts & Humanities (U) 0.0% 0.0% 0.3% 0.0% 0.2% 0.1% 0.1% 0.1%
Biology (Z) 57.2% 25.1% 9.6% 1.8% 2.3% 1.6% 4.1% 5.2%
Biomedical Research (R) 7.2% 5.2% 11.2% 0.1% 1.5% 1.2% 9.3% 9.8%
Biosciences (B) 14.6% 5.2% 15.5% 0.5% 2.6% 2.1% 7.0% 5.9%
Chemistry (C) 5.5% 14.3% 16.8% 2.9% 27.8% 86.6% 0.6% 1.1%
Engineering (E) 1.4% 5.1% 9.0% 4.0% 35.0% 7.3% 0.6% 0.7%
General & Internal medicine (I) 9.0% 1.2% 12.7% 0.2% 0.8% 0.1% 64.8% 31.2%
Geo- & Space science (G) 7.1% 5.5% 4.5% 87.4% 7.7% 1.3% 0.0% 0.1%
Mathematics (H) 0.8% 0.7% 5.7% 0.5% 6.9% 0.7% 0.1% 0.2%
Neuroscience & Behavior (N) 1.8% 0.5% 9.1% 0.0% 1.1% 0.1% 2.6% 4.8%
Non-internal medicine specialties (M)
7.7% 4.0% 16.8% 0.3% 2.5% 0.9% 33.5% 61.9%
Physics (P) 1.4% 3.1% 10.5% 4.7% 37.0% 10.8% 0.4% 0.6%
Social Sciences I (S) 0.6% 0.3% 1.7% 0.1% 0.4% 0.0% 0.7% 1.5%
Social Sciences II (O) 0.3% 0.5% 1.3% 0.0% 0.3% 0.2% 0.0% 0.1%
Table 3. Research profi le per cluster as expressed by the fi eld representation of their research output
‘agriculture’ and ‘biology’, interesting enough, almost mirroring the same contrary and complementary picture of GRM/SPM found in the life sciences. Finally, the third cluster (MDS) has been found a truly multidisciplinary cluster with activity in all science fi elds and less skewed publication distributions over fi elds; no fi eld has a higher share than 20% here.
Social sciences and humanities make up only a very small share of the activity of the European institutions in all clusters.
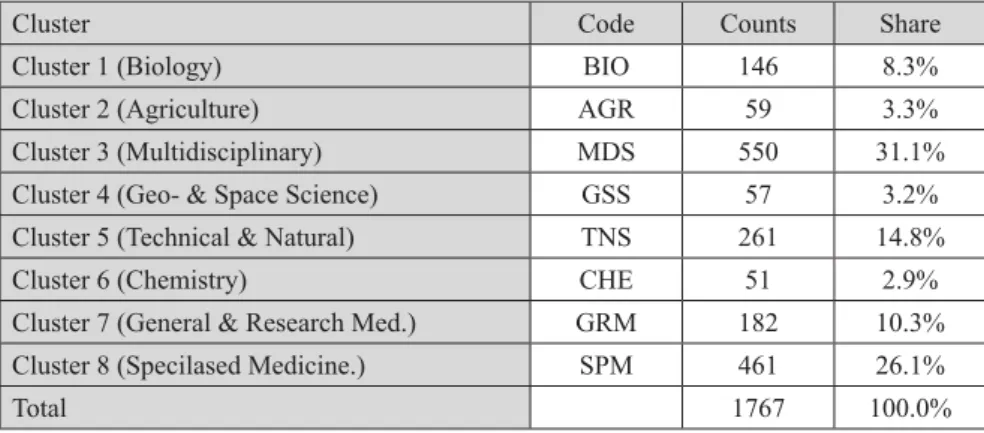
The number of institutes assigned to each cluster is presented in table 4. The clusters with multidisciplinary institutes and institutes with specialized medicine comprise jointly about 57% of all institutes. The clusters with Biology, Technical and Natural Sciences and the General and Research Medicine still hold a reasonable share of institutes while the three small clusters , the Geo- and Space Sciences, Agriculture and Chemistry each hold about 3% of all institutes. The existence of one large cluster is often an undesired effect of the chosen linkage method (Ward) but in this case inspection of the data is clearly supportive for one larger multidisciplinary group.
Cluster Code Counts Share
Cluster 1 (Biology) BIO 146 8.3%
Cluster 2 (Agriculture) AGR 59 3.3%
Cluster 3 (Multidisciplinary) MDS 550 31.1%
Cluster 4 (Geo- & Space Science) GSS 57 3.2%
Cluster 5 (Technical & Natural) TNS 261 14.8%
Cluster 6 (Chemistry) CHE 51 2.9%
Cluster 7 (General & Research Med.) GRM 182 10.3%
Cluster 8 (Specilased Medicine.) SPM 461 26.1%
Total 1767 100.0%
Table 4. Number of research institutes in each of the eight clusters
Francais du Petrole’ as well as the Dutch company ‘DSM’. Our grouping resulted in two clusters with a main focus on medical sciences. In the fi rst medical group (GRM) the focus is more on general and research medicine. General hospitals make up a large part of this group, e.g. ‘Niguarda CA Hospital of Milan’. Other institutes in this group are the ‘European Institute of Oncology’ or ‘Netherlands Cancer Institute and Antoni van Leeuwenhoek Hospital’. In the last cluster (SPM) we fi nd several universities like the ‘Erasmus University Rotterdam’ or ‘Medical University of Lübeck’. We can also fi nd specialized institutes like the ‘National institute for the rest and care of the elderly’ or ‘Nuffi eld Orthopaedic Centre’ among the institutions with specialized medical profi le.
2.4 Classifi cation model
After the clustering of 1767 institutes, a classifi cation model was created for the assignment of other research institutes or other research profi les to one of the eight groups. The institutions in the cluster analysis are used as the training set. The resulting model can then be applied to any other institution. For the creation of this model we used discriminant analysis. This technique uses linear functions (latent variables) of the predictive variables in the dataset, in this case the vector representing the research profi le. Each function or canonical root classifi es cases into one of two possible groups. By adding a function to the analysis it is possible to distinguish between one more group. This means that for the classifi cation into eight separate groups we need seven different linear functions. Discriminant analysis can be disturbed by out-liners but these cases were mostly removed by excluding institutes with less than 20 publications.
Function Eigenvalue % of Variance Cumulative % Canonical Cor.
1 7.572(a) 36.4 36.4 0.94
2 4.573(a) 22 58.4 0.906
3 4.290(a) 20.6 79 0.901
4 1.320(a) 6.3 85.3 0.754
5 1.179(a) 5.7 91 0.736
6 1.171(a) 5.6 96.6 0.734
7 .700(a) 3.4 100 0.642
Table 5. Eigenvalues and statistitcal functions of the discriminant analysis
by the discriminant function and the dependent variable. Each of these functions also have a signifi cant Wilks’ Lambda value which indicates that different groups have indeed different, discriminating mean values on this function.
Based on these functions a classifi cation model is constructed using Fisher’s coeffi cients. This results in eight different linear functions, each assigned to one of the different groups. For each observation the resulting value for each function can be calculated. The observation is assigned to the group connected to the function with the highest value. The exact coeffi cients of each classifi cation function can be found in Appendix 1.
References
Calinski, T., Harabasz, J. (1974), A dendrite method for cluster analysis.
Communications in Statistics, 3, 1-27.
Duda, R.O., Hart, P.E. (1973), Pattern Classifi cation and Scene Analysis. New
York: Wiley.
Glänzel, W. (2001), National characteristics in international scientifi c co-authorship, Scientometrics, 51 (1), 69-115.
Glänzel, W., Schubert, A.(2003), A new classifi cation scheme of science fi elds and subfi elds designed for scientometric evaluation purposes,
Scientometrics, 56 (3), 357–367.
Glänzel, W., Leta, J., Thijs, B. (2006), Science in Brazil. Part 1: A macro-level comparative study. Scientometrics, 67 (1), 67-86.
Leta, J., Glänzel, W., Thijs, B. (2006), Science in Brazil. Part 2: Sectoral and institutional research profi les. Scientometrics, 67 (1), 87-105.
Milligan, G.W., Cooper, M.C. (1985), An examination of procedures for dermining the number of clusters in a data set. Psychometrika, 50(2),
159-179.
Thijs, B., Glänzel, W. (2006), The infl uence of author self-citations on bibliometric meso-indicators. The case of European universities.
Scientometrics, 66 (1), 71-80.
Ward, J.H. (1963). Hierarchical Grouping to optimize an objective function.
3
T
HE DYNAMIC PERSPECTIVEON RESEARCH PERFORMANCE3.1
Four basic principles
The paper on Israeli research (see Part II, chapter 4) institutes introduced the dynamic perspective on institutional research performance. This dynamic perspective is an implementation of four principles distilled from guidelines and best practices known in the fi eld of scientometrics. These are combined and extended with the classifi cation model based on research profi les which adds a unique tool to increase comparability between institutes. Then, the use of citations based indicators standardized both with respect to journal or fi eld expectations and the additional information on publication strategies gained from the ratio between journal and fi eld expected citation rates do complete nicely to requirements of a multidimensional methodology (Glänzel, Schubert, et al 2008; Glänzel, Thijs et al, 2009).
The four basic principles are:
• Institutions are embedded in their national situation.
• Past performance is a good reference point for assessment of present and future performance.
• Multiple indicators and Field differentiation allow a broad performance assessment.
• Institutions are best compared with similar or likewise institutions.
3.1.1 National
situation
Research institutes are embedded in a national science system with its own properties and peculiarities. They depend on national funding and are part of an established cultural heritage. This means that national statistics can provide a good starting point or reference point for the evaluation of institutional research performance. Bonaccorsi (2007) states that ‘contextual information on national systems needs to be introduced at the level of analysis’. However, as institutes can have a much more specialized research profi le than the country, the national situation alone cannot be used as a normative benchmark.