Eect of Alkali-Aggregate Reactions in
Concrete Dams Using Finite Element Method
M. Moshtagh
1and M. Ghaemian
The eect of Alkali-Aggregate Reactions (AAR) in concrete dams was investigated using the nite element method. Two models have been presented to assess the eects of the AAR in concrete dams. The stress dependency of AAR strains has been taken into account in the models and the degradation of concrete properties during the reaction has been implemented in the nite element program. The results of the isothermal and nonisothermal analyses of a gravity section of a Beauharnois power plant have been presented and compared with the measured data and the results are in close agreement. The results of the analysis demonstrate the importance of the AAR in concrete dams. High stresses and large deections occur in the dam during the reaction. Because of the stress dependency of the reaction, vertical displacements are smaller than horizontal displacements.
INTRODUCTION
The Alkali-Aggregates Reaction is a chemical reaction that occurs between hydroxide ions found in the form of K(OH) and Na(OH) in the Portland cement and reactive aggregates. Water, as a main component of concrete, is a catalyzer in this reaction. AAR causes concrete expansion, micro cracks and, nally, visible cracks in the concrete. Because water is required for continuance of the reaction, in dams, mass concrete, where humidity is at its extreme, the reaction can continue during the age of the structure. Over a long period of time, AAR aects the operation of concrete gravity dams, due to deterioration induced by the AAR. The structural eect of AAR is the resulted strain, due to the expansion of the concrete volume produced by the generation of reaction products, such as Silica gel. This strain is related to temperature, humidity, aggregate activity and stresses on the struc-ture [1]. Concrete properties, such as modulus of elasticity and tensile strength, are degredaded during the reaction.
Few models are proposed by researchers, taking into consideration AAR. A parametric model for AAR was proposed by Leger et al. [2]. They applied a CTMR
1. Department of Civil Engineering, Sharif University of Technology, P.O. Box 11155-9313, Tehran, I.R. Iran. *. Corresponding Author, Department of Civil Engineering,
Sharif University of Technology, P.O. Box 11155-8639, Tehran, I.R. Iran.
loop to assess the eects of AAR in concrete dams. Capra and Bournazel [3] introduced a thermodynamic model of damaged concrete, in which temperature, relative humidity, applied stress and aggregate activity are the main factors contributing to AAR. Huang and Pietruszczak [4] applied a nonlinear continuum theory to model the thermo mechanical behavior of concrete subjected to an alkali-silica reaction. The expansion rate was assumed to be controlled by the alkali content and the magnitude of conning stress, as well as temperature variation.
Bournazel et al. [5] prepared a probabilistic model, in which the size of particles, aggregate activity, concentration of reactive aggregates and the probabil-ity of Na+, K+ and OH existence in the system were
taken into consideration.
In this paper, two models have been presented to study AAR eects in concrete dams. In the models, the stress dependency of the strain has been taken into account. Spatial changes of humidity and aggregate activity have been neglected through the dam body [2]. FINITE ELEMENT IMPLEMENTATION Strain caused by AAR is introduced into a nite element program. This strain is implemented in the form of the initial strain into the system. In a system with initial strain, the stress-strain relationship is as follows:
where fg is the stress tensor, " is the total strain tensor, "0 is the initial strain tensor and [D] is the
material properties matrix.
The strain energy of an element is as follows: Ue= 12t
Z
ff"g f"0ggTfgd
= 12t Z
ff"g f"0ggT[D]ff"g f"0ggd: (2)
The above equation can be modied as the following: Ue= 12t
Z
f"gT[D]f"gd 1
2t Z
f"gT[D]f" 0gd
1 2t
Z
f"0gT[D]f"gd +12t
Z
f"0gT[D]f"0gd:
(3) The second and third terms on the right hand side of the equation are equal. The strain-displacement relationship is as follows:
f"g = [B]feg; (4)
where feg is the vector of the element degrees of
freedom and [B] is the strain-displacement matrix. By inserting Equation 4 into Equation 3, the strain energy can be rewritten into the following form:
Ue= 12tfegT
Z
[B]T[D][B]dfeg
+12t Z
f"0gT[D]f"0gd
tfegTZ
[B]T[D]f"
0gd: (5)
By making use of the denition of the stiness matrix, [Ke] = tR
[B]
T[D][B]d, the above equation can be
recast as follows:
Ue= 12fegT[Ke]feg +12t
Z
f"0gT[D]f"0gd
tfegTZ
[B]T[D]f"
0gd: (6)
The second term on the right hand side is constant. The potential energy of an element can be written as
follows:
e= Ue We
= 12fegT[K
e]e fFegTfeg + Cons
| {z }
Ue
fFegTfeg
| {z }
We
; (7)
where fFeg is the element load vector and is as follows:
fFeg = t
Z
[B]T[D]f" 0gd:
Minimizing the potential energy results in the follow-ing:
[Ke]feg = fFeg + fFeg: (8)
Therefore, the eect of initial strains is implemented in the total load vector of the system.
COMMON ASSUMPTIONS OF THE MODELS
In both proposed models, the eects of temperature and applied stresses have been taken into consideration, using weighed factors (F, FT). The rate of the strain,
due to the reaction is as follows:
_"r= f( _"u; FT; F; t); (9)
where _"ris restrained expansion rate, _"uis unrestrained
expansion rate, FT represents variation, with respect to
temperature, F represents variation, with respect to
stresses and t is time.
To consider the eect of temperature, a hyper-bolic relationship was dened for FT as follows [6]:
FT = f(T ) = 12
1 + tanh
T T0
A2
; (10)
where A2 and T0 are material constants and T is
temperature. For low temperatures, the function ap-proaches zero and, for high temperatures, it apap-proaches unity.
An important noticeable fact is that the AAR activity will stop below a certain temperature. In this paper, a temperature of 10C has been assumed
as the boundary temperature [2,7]. So, the eect of temperature will be as follows:
(
FT = 0 if T < 10 C
An eective modulus of elasticity was used to consider the eect of creep in the concrete:
Ee=1 + E : (12)
In the above equation, Ee is the eective modulus of
elasticity and is the creep coecient. For simplicity, a constant creep coecient equal to 1.5 [2] was used. THERMAL ANALYSES
A thermal analysis was performed to obtain temper-ature distribution in the dam body. Air tempera-tures are based on the temperature records that was employed by Leger et al. [8]. Only convection and radiation were considered in the analysis and the eects of supplied heat ux from the sun were neglected. The parameters of the thermal analyses are as follows:
Thermal conductivity = 2.62 N/SC,
Specic heat capacity = 912 m2/S2,
Convective coecient = 23.2 N/mSC,
Radiation coecient = 4.2 N/mSC,
Free-stress temperature = 5C,
Thermal expansion coecient = 1:5 10 5/C.
To consider the eects of convection and radiation simultaneously, an equivalent convective coecient of 27.4 N/mSC was used.
In the isothermal analyses, a constant tempera-ture of 5.46C was employed to the whole dam body.
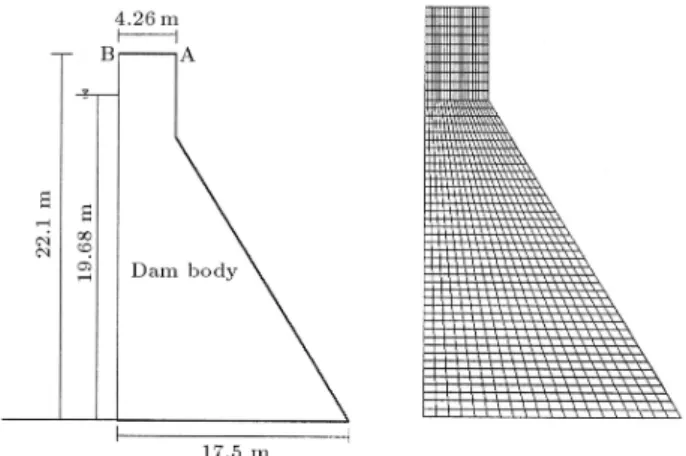
In this paper, a monolith of the Beauhrnois power plant gravity dam was analyzed. The selected section and the nite element mesh are shown in Figure 1. FIRST PROPOSED MODEL
In this model, the inuences of the eective parameters on the AAR induced strain are as follows.
Figure 1. Dam conguration and nite element model.
Eect of Applied Stresses
The exponential function suggested by Hobbs [9] was used to take into account the eect of applied stresses as follows:
F= f() = exp
A1
fc0
; (13)
where F is weighed factor of applied stresses, fC0 is
initial compressive strength, A1 is material constant
and is the average of the principal stresses.
In this model, the eect of tension in the AAR strain is neglected, so:
(
F= 1 if 0
F= f() if < 0 (14)
Time Dependency of the Reaction
The time dependency of the reaction has been imple-mented in this model as follows [10]:
f(t) = " 1 g"3
A3 ; (15)
where: g3= "t
0
A3+ t0:
In the above equation, " and A3are material constants
and t0 is a ctitious time, called thermal activation
time, which shows the progress of the reaction. g3
represents the free expansion at a given alkali content and is modied during the continuance of the reac-tion [4]. Because the reacreac-tion stops below the boundary temperature, increments of the activation time must be computed at each time step as follows:
(
dtactivation= 0 if temperature < 10C
dtactivation= dt if temperature 10C
t0 = t0+ dt
activation: (16)
Finally, the rate of the AAR caused strain is:
_"AAR= FT F f(t): (17)
This is added to the initial strains of the system. For nonisothermal conditions, in the elastic range:
_"0= 13_"AAR
| {z }
AAR expansion
+ 1
3 _T | {z }
Thermal strain
: (18)
In isothermal conditions, the thermal strains are ne-glected, so the rate of the initial strain is as follows:
Degradation of Concrete Properties
Degradation of the mechanical properties of concrete, particularly the elastic modulus and uniaxial compres-sive/tensile strength, come mainly from mechanical damage to the material. A simple function, in order to modify the Young's modulus of elasticity and the uniaxial compressive strength during the reaction, was used as follows:
E = E0
1 (1 b1)g"3
; (20)
fc= fc0
1 (1 b2)g"3
; (21)
where E0 is the initial modulus of elasticity, fc0 is the
initial compressive strength, g3 is the free expansion
at a given alkali content and b1 and b2 are material
constants.
Material Parameters
The numerical simulations have been carried out, assuming E0 = 15 MPa and fC0 = 27 MPa. The
constants appearing in f(T ) were selected, based on experimental results reported by Pleau et al. [6], i.e. T0 = 24:75C and A2 = 15:25C. The remaining
material parameters were chosen as A1 = 0:1, A3 =
8200 days, " = 0:057, b1 = 0:7 and b2 = 0:9 [4].
The duration of the analysis is 50 years, assuming one month time steps.
Results of the Isothermal Analysis
A nite element analysis of the Beauharnois dam was performed in the isothermal case, where a constant temperature was considered for the dam body.
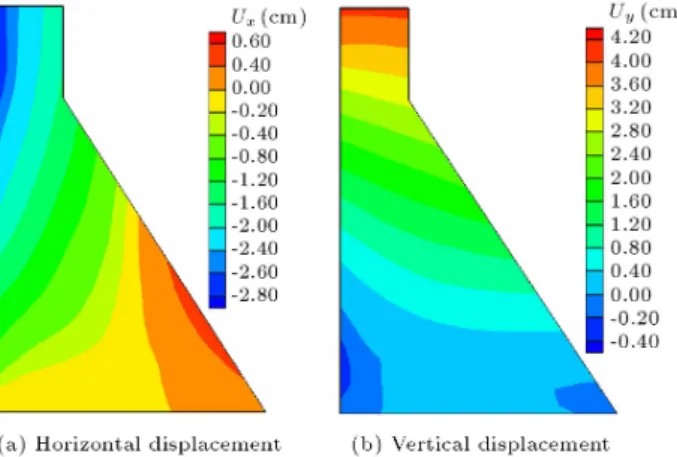
Figure 2 shows the contours of horizontal and vertical displacements after 25 years of continuing reaction in the isothermal case. Horizontal and vertical
Figure 2. Contours of displacement for isothermal analysis in the rst proposed model.
displacements of point A are less than measured data, while the vertical computed displacement of point B is greater than the measured one.
Results of the Nonisothermal Analysis
Figure 3 shows the contours of horizontal and vertical displacements after 25 years of continuing reaction in the nonisothermal case. Horizontal displacement of point A has been computed, which is less than the measured data, inversely, the vertical displacement of point B has been found to be greater than the real value.
SECOND PROPOSED MODEL
In this model, eective parameters have been consid-ered as follows.
Stress Dependency of the Strain
A logarithmic function, suggested by Charlwood [1] for the inuence of applied stresses, was used. Like the rst model, the increasing eect of tension is neglected, so one has:
(
F = 1 if > 0
if 0 ) abs= abs()
) (
F = 1 if abs< L
F=1 K1log
abs
L
if Labsmax (22)
where L is compressive stress, below which restrained
growth rate is equal to the free expansion rate, max
is compressive stress, above which restrained growth rate is equal to zero, is the average of the principal stresses, abs is the absolute of and K1 is the slope
of the stress-strain curve.
Figure 3. Contours of displacement for nonisothermal analysis in the rst proposed model.
Thus, the rate of strain is:
_"AAR= F FT _"u: (23)
In nonisothermal cases, in the elastic range, the rate of initial strains is equal to:
_"0= | {z }_"AAR AAR expansion
+ |{z} _T
thermal strain
: (24)
And in isothermal conditions, the thermal eects are relinquished, so:
_"0= _"AAR: (25)
Degradation of Concrete Properties
In this model, a linear function was used to modify the Young's modulus of elasticity and the compressive strength of the concrete as follows:
E = E0(1 K2t); (26)
fC= fC0(1 K3t): (27)
K2 and K3 are material constants and t is time. K2
and K3 were chosen in a way that E and fc reach 80
percent of the initial values after 25 years of continuous reaction.
Model Parameters
The numerical simulation was performed using param-eters of the model as L = 0:3 MPa, max = 8 MPa,
K2 = K3 = 0:004 /year and the calibrated free
expansion of 350 " /year. The duration of the analysis is 50 years, with one month time step.
Results of Isothermal Analysis
Figure 4 shows the contours of horizontal and vertical displacements computed using the second proposed model in the isothermal case. The horizontal displace-ment of point A is less than the measured one and the vertical displacements of both points are greater than the measured data.
Results of the Nonisothermal Analysis
Figure 5 shows the contours of horizontal and vertical displacements after 25 years of continuous reaction in the nonisothermal case. The horizontal and vertical displacements of point A were computed. The hori-zontal computed displacement of point A is less than the measured one, while the vertical displacement of point B is greater than the measured one.
Figure 4. Contours of displacement for isothermal analysis in the second proposed model.
Figure 5. Contours of displacement for nonisothermal analysis in the second proposed model.
COMPARISON OF THE MODELS
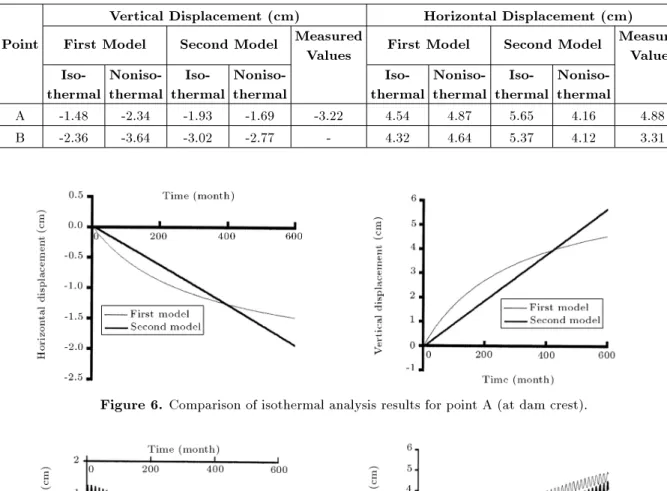
Table 1 shows the comparison of computed ments of points A and B with the measured displace-ments. The results of the rst proposed model, in the nonisothermal case, are in close agreement with the measured values.
Figures 6 and 7 compare the horizontal and verti-cal displacement histories of point A, obtained from two models in isothermal and nonisothermal analyses. In the nonisothermal cases, oscillator histories are due to the eect of thermal expansion. During cold weather, the reaction stops, because of the low temperatures. The thermal eects cause the dam to deect toward downstream. At the beginning of the warm weather, both thermal and AAR strains cause the dam to deect toward upstream and make an oscillation form in the displacement histories.
To investigate a real dam, using the de-scribed models, the constants appearing in FT and
F("; A3; T0; A2) are selected, based on experimental
results. The remaining material parameters (A1, B1
Table 1. Comparison of the results obtained by the proposed models and measured displacement. Vertical Displacement (cm) Horizontal Displacement (cm) Point First Model Second Model Measured
Values First Model Second Model MeasuredValues
Iso-thermal
Noniso-thermal
Iso-thermal
Noniso-thermal
Iso-thermal
Noniso-thermal
Iso-thermal
Noniso-thermal
A -1.48 -2.34 -1.93 -1.69 -3.22 4.54 4.87 5.65 4.16 4.88 B -2.36 -3.64 -3.02 -2.77 - 4.32 4.64 5.37 4.12 3.31
Figure 6. Comparison of isothermal analysis results for point A (at dam crest).
Figure 7. Comparison of nonisothermal analysis results for point A (at dam crest).
the analysis will be carried out using implemented computer subroutines to assess the short and long term eects of AAR. If the AAR caused expansion is relatively high, proper predictions will be necessary. CONCLUSIONS
In this paper, two models were proposed for mod-eling the eects of the AAR. They incorporate the eect of AAR expansion coupled with degradation of concrete properties. The main features for initiation and continuation of the reaction in the models are the inclusion of temperature, humidity and applied stresses on the model. The results of the analysis demonstrate the importance of the AAR in concrete dams. High stresses and large deections occur in the dam during
the reaction. Because of the stress dependency of the reaction, vertical displacements are smaller than horizontal displacements.
REFERENCES
1. Charlwood, R.G., Steele, R.R., Solymar, Z.V. and Curtis, D.D. \A review of Alkali aggregate reactions in hydroelectric plants and dams", Int. Conf. on Alkali-Aggregate Reactions in Hydro-Electric Plants and Dams, New Brunswick, Canada (Sept. 1992). 2. Leger, P., Cote, P. and Tinawi, R. \Finite element
analysis of concrete swelling due to alkali-aggregate reactions in dams", Computers & Structures, 60(4), pp 601-11 (1996).
mechanical eects of alkali-aggregate reaction", Ce-ment and Concrete Research, 28(2), pp 251-60 (1998). 4. Huang, M., Pietruszczak, S. \Modelling of thermo-mechanical eects of alkali-silica reaction", Journal of Engrg. Mechanics, 125(4), pp 476-85 (April 1999). 5. Bournazel, J.P., Capra, B., Mebarki, A. and Sellier, A.
\Alkali-aggregate reaction-a probabilistic description of induced mechanical eects", Int. Conf. of Compu-tational Modeling of Concrete Structures, 1, De Borst. Ed., Mang, Bicanic, Euroc, pp 491-500 (1994). 6. Pleau, R., Berube, M.A., Pigeon, M., Fournier, B. and
Raphael, S. \Mechanical behaviour of concrete aected by ASR", Proc., 8th Int. Conf. on Alkali-Aggregate Reaction, pp 721-6 (1989).
7. Gocevski, V. and Pietruszczak, S. \On rehabilitation of hydraulic structures subjected to alkali-aggregate
re-action", Numerical Models in Geomechanics-NUMOG VII, Pande, Pietruszczak & Schweiger, Rotterdam, Balkema, pp 589-94 (1999).
8. Leger, P., Venturelli, J. and Bhattacharjee, S.S. \Sea-sonal temperature and stress distributions in concrete gravity dams, Part 1: Modelling; Part 2: Behaviour." Can. J. Civ. Engrg., Ottawa, pp 999-1029 (1993). 9. Hobbs, D.W., Alkali-Silica Reaction in Concrete.,
Lon-don (1988).
10. Magni, E.R., Rogers, C.A. and Grattan-Bellew, P.E. \The inuence of the alkali-silica reaction on structures in the vicinity of Sudbury", Ontario. Proc., 7th Int. Conf. on Alkali-Aggregate Reaction in Concrete, pp 17-21 (1986).