Sharif University of Technology
Scientia IranicaTransactions D: Computer Science & Engineering and Electrical Engineering www.scientiairanica.com
Research Note
A multi-objective approach to model-driven
performance bottlenecks mitigation
M. Amoozegar
a;and H. Nezamabadi-pour
ba. Department of Information Technology, Institute of Science and High Technology and Environmental Sciences, Graduate University of Advanced Technology, Kerman, P.O. Box 76315-117, Iran.
b. Department of Electrical Engineering, Shahid Bahonar University of Kerman, Kerman, P.O. Box 76169-133, Iran. Received 25 December 2013; received in revised form 1 October 2014; accepted 7 March 2015
KEYWORDS Bottleneck detection; Multi-objective optimization;
Software performance engineering;
UML;
Gravitational search algorithm.
Abstract. Software Performance Engineering (SPE) evaluates the key performance factors such as response time and utilization in the entire life cycle of software development. One of the important issues of software performance is bottlenecks that have not been investigated much till now in the process of SPE. Meanwhile, Bottleneck detection and mitigation in software modeling stage is quality-centered and cost eective. Layered bottleneck is a type of bottleneck that occurs in systems with layered services and aects its utilization more than at bottlenecks. The presented approach in this paper has selected Layered Queening Network (LQN) as an appropriate performance model to present and analyze the layered bottlenecks. The process of SPE from software model to performance model has been automatically implemented. Also, an optimization stage is added to nd the best specication of software model in a way that the strength of the bottleneck, the response time and the cost will be minimized. To assess the proposed solution, two recently proposed multi-objective gravitational search algorithms are employed. To evaluate the eectiveness of the applied algorithms, two well-known multi-objective algorithms: NSGA-II and MOPSO are also applied to a case study, and a comprehensive comparison is presented.
c
2015 Sharif University of Technology. All rights reserved.
1. Introduction
Software performance engineering integrates perfor-mance evaluation in the software development process from the early stages throughout the whole life cycle. Therefore, software model annotated with performance specication is transformed into a performance model. Recent research of SPE focused on feedback from analyzing performance results into software model.
Performance usually refers to response time; throughput and resource utilization. Many researches have been presented to improve these factors.
Mean-*. Corresponding author. Tel.: 03433776611
E-mail addresses: [email protected] (M. Amoozegar); [email protected] (H. Nezamabadi-pour)
while SPE also covers the other performance issues such as bottlenecks. Although high utilization of resources is a main target, excessive utilization causes bottlenecks. A bottleneck is a single point of contention that limits the overall system performance [1].
Layered bottleneck is a type of bottleneck that occurs in systems with layered services. In this layered structure, each service in a layer is client for lower layer service, and server for upper layer service and resources are possessed simultaneously. Layered bottlenecks are more complicated than at bottlenecks and the workload intensity of the system and the resources utilization are more aected. Therefore, one of the key factors in the software performance optimization is bottleneck detection and improvement.
ap-proaches have been presented. Some apap-proaches are based on simulation and monitoring. Ref. [2] presented an approach that supports automated monitoring, analyzing, and reporting by applying machine-learning in the context of staging. Therefore, this approach collects data and analyzes bottlenecks for a signicant number of performance metrics.
Ref. [3] has presented an approach for simple and automatic detection of performance bottleneck based on the dierential analysis method. This approach generates dierent binary variants obtained by patch-ing individual or groups of instructions. Then the cost of an instruction group is evaluated. Dieren-tial Analysis is illustrated by the use of DECAN on a range of HPC applications to detect performance bottlenecks.
Many other approaches detect bottlenecks from runtime or source-code information [4-7]. Based on runtime information, a PERT (Program Evaluation and Review Technique) diagram is built, and the crit-ical path of the diagram is identied as a performance bottleneck.
These methods are time consuming and very costly. The bottlenecks are detected in the last phase of software development so that their mitigation is very dicult.
Model based techniques for bottleneck detection evaluate software model. Therefore, in the early life cycle of software development, bottlenecks can be de-tected and mitigated by tuning the related performance specications.
Based on [8], in performance model side, bot-tleneck identication and removal was introduced few decades ago [1] and has been continuously rened by more recent results [9]. But, there exist few works that detect such bottlenecks based on UML models. Garousi [10] presented a UML-driven technique to detect Performance bottlenecks of concurrent real-time systems. The control ow diagram and PERT diagram are built from the sequence diagrams and interaction overview diagrams to pinpoint performance bottlenecks.
This paper presents an automatic UML based bottleneck improvement solution that optimizes strength bottleneck [9] of the software model. There-fore, bottleneck detection and mitigation problem is modeled as an optimization problem that has consid-ered more than one objective function (in this study three objective functions are considered together) and is solved with the Pareto-optimal concepts.
In recent years, some approaches [11,12] have been proposed that apply heuristic algorithms to evaluate the UML model for performance in terms of expected response time, throughputs and resource utilizations. Ref [13] has applied multi-objective evolutionary op-timization to nd the good value of the performance
specications of the software modeled with Palladio Component Model.
Gravitational Search Algorithm (GSA) is a rela-tively new optimization algorithm based on the laws of gravity and motion. In Ref. [14] we presented an approach to optimize the response time of the software model along with two constraints, cost and utilization, by single objective version of GSA. Single objective optimization algorithm provides one solution or one choice for the software architecture. Meanwhile, in multi-objective optimization algorithms, instead of a unique optimal solution, there is rather a set of alter-native trade-os. This research applies three multi-objective versions of GSA that are called NSGSA (Non-dominated Sorting Gravitational Search Algorithm) and MOGSA (Multi Objective Gravitational Search Algorithm) to nd the best congurations of software model in a way that bottleneck strength be minimized. Bottleneck must be improved while cost and response time must also be controlled. Thus three objectives exist that must be minimized.
The privileges of the presented approach are:
1. The software model that is specied with perfor-mance property automatically analyzed from two important performance issues; bottleneck and re-sponse time. Bottlenecks, especially software bot-tlenecks, are aected by the software and hardware resources. By the presented approach, the optimum number of resources will be determined, before the software development starts. This process is very cost eective especially when the role of the software resources, e.g. threads, in the development process has been considered.
2. The bottleneck improvement is considered as the main objective during the SPE process. The software architecture who is not aware of the perfor-mance engineering can easily optimize the software model.
3. NSGSA and MOGSA are applied in SPE scope and bottleneck improvement problem with respect to response time and cost.
A case study has been selected and whole steps of SPE, from software modeling to optimization, have been applied to it. NSGA-II and MOPSO are also used for optimization. Important metrics such as coverage metric, diversity and spacing evaluate the performance of these algorithms. Comprehensive comparison of the results has been provided that show the NSGSA has the best behavior.
The rest of the paper is structured as follows: Basic concepts are discussed in Section 2. Section 3 describes the bottleneck detection and the measure-ment strategy. Formal denition of an optimization problem is presented in Section 4. Introduction of the
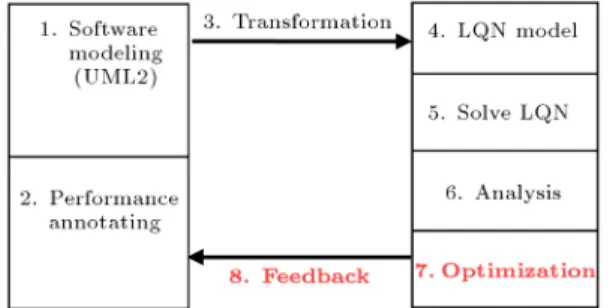
Figure 1. Software performance engineering process.
Case study, simulation and the analysis of the results are illustrated in Sections 5 and 6. The nal section is related to a conclusion and future work.
2. Background
2.1. Software performance engineering
Software Performance Engineering (SPE), rstly pre-sented in [15], is a systematic, quantitative approach to construct software systems that meet performance objectives. It is based on the careful and methodical evaluation of performance attributes throughout the lifecycle, from requirements and specication to imple-mentation and maintenance [16].
Figure 1 shows the steps of SPE. The rst step is the designing of software model in UML2 with activity, component and deployment diagram. In the second step, the MARTE [17] prole extends software model to annotate performance requirements and specify performance property of resources and activities using stereotypes and tagged values. Steps three and four are related to software model transform into CBML by means of existing algorithms and tools that have been provided in our already research [18]. CBML is an XML based language designed for describing layered queuing models with embedded components, and also the component sub-models [19,20], the LQN model will be solved with LQNS solver [21] in step 5. LQNS uses analytical mean value queuing approximations to solve the queues at all entries. Analysis is done in step 6 with SPEX which supports experiment instrumentation [22]. This tool can execute parameterized experiments using LQNS, and is very useful for repeating a parameterized run. In the nal step, a search is performed through the space of the problem and the best value for performance parameter annotated in software model will be presented nally. All of these steps are used for an E-shop software case study.
A key factor in the successful performance anal-ysis is the automation. Over the last decade, many researches have been directed towards integrating per-formance analysis into the software development pro-cess [23]. In this way, a software architecture who is not procient in performance domain can easily design the software with high performance.
2.2. Bottleneck
A bottleneck is a single point of contention that limits the overall system performance [1].
LQN models [24] extend the traditional queuing network models by considering both software and hard-ware contention, and the impact of layers on service time. LQN model has layered structure. Each layer is the server of the upper layers and a client for the lower layers.
When a software task has been fully utilized, while the resources that it uses are underutilized, a software bottleneck has accrued [1]. Hardware bottlenecks usually occur at a CPU, a disk, or other devices. Software bottlenecking is quite dierent from hardware bottleneck. When a software task is highly utilized, it will \push back" on its clients which makes them appear to be saturated, too. This is while the used resources by this task are underutilized. In the systems with deeply layered structure, software blocking extends to other layers quickly [25]. A detailed discussion of software bottlenecking and their features can be found in [1].
2.3. Multi-objective optimization
Some problems have more than one objective function to be optimized and sometimes these objectives are in conict with each other. Multi-objective optimization algorithms are presented to solve these problems. Since these algorithms provide more than one solution, the trade-o between objectives is necessary to nd the best solution.
Suppose that x = (x1; x2; ; xn) is the vector
of decision variable, fi : Rn ! R; i = 1; ; k are the
objective functions and gi, hj: Rn! R, i = 1; ; m,
j = 1; ; p are the constraints of the problem. Pareto domain based algorithms that are used in this paper, present this problem and denition as follows [26]: Minimize:
f(x) = [f1(x); f2(x); ; fk(x)]:
Subject to:
gi(x) 0; i = 1; 2; ; m;
hj(x) = 0; j = 1; 2; ; p:
Denition 1: Given two vectors x, y 2 Rk, we say
that x y if xi yi, i = 1; ; k and that x dominates
y (or presented by x y) if x y and x 6= y. Denition 2: we say x 2 Rk is non-dominated
with respect to , if there does not exist another x02
such thatf(x0) f(x).
Selected non-dominated solutions are stored in an external archive. The external archive is updated at
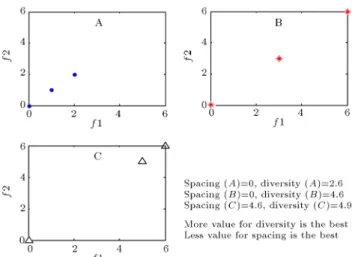
Figure 2. Diversity and spacing concept.
each iteration of the algorithm. When the running algorithm is terminated, external archive will present nal results.
Therefore, multi-objective optimization algo-rithms provide a set of solutions that is required to be well-spread and uniformly covering wide areas of the Pareto front. To evaluate the performance of these algorithm, two important metrics have been dened. The spread of the solution set is measured by using the diversity metric [27]. The second metric is spacing that demonstrates how uniformly the solutions in the objective space are distributed [28]. These metrics are measured based on the described formula in Section 6. Figure 2 shows the concept of these metric for three solution sets A, B and C in a two-objective problem (f1 and f2).
3. Bottleneck detection and measurement strategy
Bottleneck detection and mitigation can be considered as one of the principal targets of SPE as mentioned above. Layered bottleneck is a type of bottleneck that is related to layered services. In LQN model, total service time of each server or resource, includes its service time and holding time and service time of other resources are used in nested form. Therefore, when a service includes other services and they are waiting, they possess resources in the form of nested simultaneous.
A directed graph can be used to model dependen-cies between recourses. A node presents each resource A, and an arc connects A to their dependent resources. Details and related equations are described in [9]. Basic parameters and equations of A to measure bottleneck are:
mA = multiplicity of A;
XA = service time of A;
WA = waiting time for requests to A;
RA = response time = WA+ XA;
fA = throughput of resource A;
UA= fAXA = utilization of A;
satA = the saturation level of A = UA=mA.
Ref. [1] presents two observations and two denitions: Observation 1: When a task is a software bottle-neck, it is saturated but its servers are not.
Observation 2: A saturated task or processor tends to saturate tasks which use it by rendezvous, so bottlenecks tend to spread saturation in a rendezvous net back along the request arcs.
Denition 3: A software bottleneck occurs when a task (or a set of task threads) exhibits a high utilization, which is also high relative to the utilization of each of its servers, either direct or indirect.
Denition 4: A measure for the bottleneck, called the bottleneck strength, is the ratio of its utilization to that of its most highly utilized server, direct or indirect. Based on these observations and denitions, a \bottleneck strength" measure, that has been dened in [1] and completed in [9], is presented as:
BStrengthA= sat satA
Shadow(A);
Shadow(A) = max
a2Below(A)sata: (1)
BStrengthAis the strength of the bottleneck at A and,
Below (A) is the set of resources that A depends on, directly or indirectly.
A layered bottleneck accrues when a statured resource bounds the throughput of the system.
Satshows the resource saturation threshold that
must be initialized before the bottleneck detection. These conditions must be checked to detect the bot-tlenecks [9].
If sat value of one or more resources (for example a) in Processors is more than sat then:
B = max
a2Processorssata: (2)
Else, sat value of one or more other resources is more than sat, B is any resource which satises both of:
satB > sat;
B = max
A=2ProcessorsBstrengthA: (3)
Therefore, both software and hardware resources are considered. Also, LQN provides a simple manner to model and analyze the bottlenecks.
4. Problem modeling
In this section, the problem formulation, solution space and objective functions are precisely described. Finding the best values for performance attribute of these recourses is very important. Design options or performance specications are annotated in software model by MARTE prole and describe a particle. Therefore, suppose that s is the number of servers and t is the number of multi-threaded object or task; the decision vector is dened by M whose elements are, respectively, chosen from the set fcpusi; i = 1 s, cpui, i = 1 s, thrmj and j = 1 tg, where:
1. cpus: CPU speed of each server in deployment diagram annotated with speedfactor tag value of Resource stereotype;
2. cpum: CPU multiplicity of each server in de-ployment diagram annotated with Resmult tag of Resource stereotype;
3. thrm: Multiplicity of thread for each active object in UML diagram annotated with poolsize tag of PaRunTInstance stereotype.
The most important software resources are threads that have important eects on the performance of the software. Determining the number of threads in the software modeling stage facilitates and accelerates the software developing process. This resource is equivalent to the software task in LQN.
Also, we can add other important parameters to evaluate performance carefully, but we restrict adding the number of parameters to control the complexity of the problem.
Objective functions are as follows. The rst objective is F1(M) that minimizes the response time.
Response time is annotated with respTime tags in activity diagram and is measured by LQNS tools after model transformation.
The second objective is Total cost that con-trols and restricts the number of resources indirectly. Although more recourse decrees response time and bottleneck, the total cost must be limited. The total cost is dened as:
F 2 =
s
X
k=1
H cpusk cpumk; (4)
where H is the speed coecient.
The third objective is the bottleneck strength that must be minimized. This objective function is calculated from Eq. (1). In this stage, the bottlenecks and their strength are determined according to the dened instruction in Section 3. The maximum value of BStrength is considered as the strength of the bottlenecks.
In the optimization process, the number of soft-ware and hardsoft-ware resources which are known as the performance specications, in the software model, have been determined automatically. Two objectives, response time and strength bottleneck, increase the capacity of the system, but total cost, F2; equilibrates
and controls the used resources. 4.1. Optimization algorithms
The selected algorithms to optimize the mentioned problem are divided into 3 categories: The rst cat-egory is related to multi-objective algorithms based on the gravitational search algorithm or GSA. GSA has been inspired from the law of gravity and mass interactions that uses the theory of Newtonian physics. Searcher agents are the collection of masses that make an isolated system. Every mass can be informed of the position of other masses. Dierent masses transfer their information to other masses using the gravitational force. Detailed and related equations are given in [29]. Non-dominated sorting Gravitational search al-gorithm or NSGSA [30] and Multi-objective GSA or MOGSA [31] are selected for the rst category.
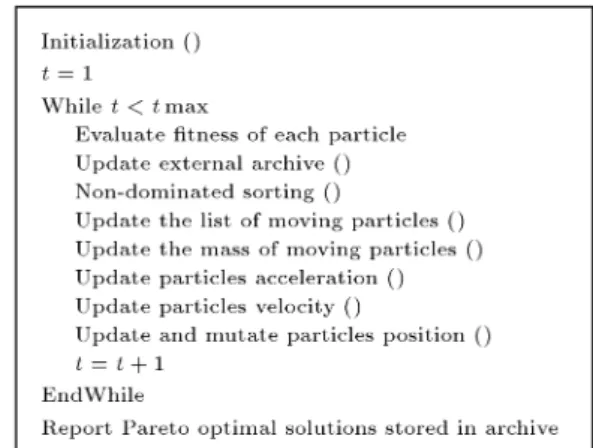
NSGSA update the gravitational accelerations by using the non-dominated sorting approach. Some elitism mechanisms exist in these algorithms which have been provided by an external archive of the Pareto optimal solutions. Non-dominated solutions are added to the external archive. The length of the archive is limited, therefore, once the length of the external archive is violated, one member must be removed. The deviation of the members crowding distances from the average is calculated to select a member that must be removed. Sign and reordering mutations are two proposed operators that keep diversity within the moving masses. Figure 3 shows the pseudo code of this algorithm.
MOGSA also uses an external archive to reserve the non-dominated solutions and update it the same as Simple Multi-Objective PSO (SMOPSO) [32]. The used mechanism to control archive is elimination
ticle from crowded areas. For this purpose, objective functions and solution space are divided into hyper-rectangles. When archive overow accrues, one particle from the most crowded hyper-rectangle is randomly selected and removed. In MOGSA, the distance be-tween each particle to its nearest neighbor is calculated and its mass is updated. Distribution of archived particles is done by using the niching technique. In this algorithm, the archived particles apply gravitational force.
NSGA-II is a multi-objective extended version of the genetic algorithm that is based on non-dominated sorting solutions [33]. This algorithm is chosen because of its similarity with NSGSA.
SMPOS is a multi-objective version of PSO. This algorithm is chosen because of its similarity with MOGSA.
Therefore, two multi-objective versions of the new gravitational search algorithm are selected to evaluate their behavior in the bottleneck improvement scope.
The second reason for these selections is provid-ing the possibility of compression gravitational based algorithms with similar genetic based and PSO based multi-objective algorithms.
5. Case study
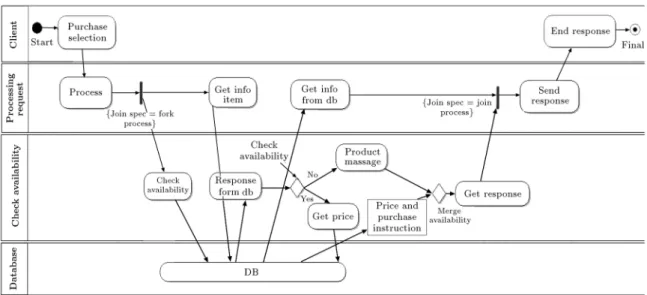
E-shop is a software system that provides user interface to purchase and payment items. Details of this system are presented in component, deployment and activity diagrams (Figures 4-7).
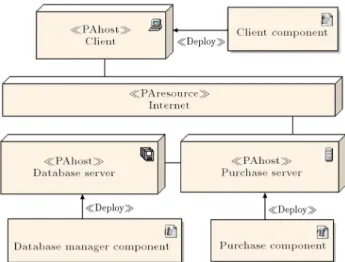
This system is modeled with UML2 in Enterprise Architect tools. Figure 4 shows a component diagram which models functionality of system in high level, Figure 5 shows a deployment diagram which species hardware framework, and Figure 6 shows an activity diagram that presents the behavior of the system.
After modeling functionality of the software, we must specify non-functional features, for example per-formance. Therefore, annotate model with MARTE prole. Tables 1, 2 and 3 show needed performance annotations and related elements of the model.
The software model was transformed into CBML
Figure 4. Component diagram of E-shop system.
Figure 5. Deployment diagram of E-shop system. Table 1. Deployment diagram annotation.
Tag
value Client
Purchase server
Database server
Resmult 1 1 1
SchedPolicyKind Ref Fcfs Fcfs
speedFactor 1 1 1
Replica 1 1 1
by our tool [18]. At the rst step, XMI, that is an XML-based document of software model, is generated; then, it is transformed into LQN model and is rewrited based on SPEX tool format. SPEX provides a framework for iterative run of LQN model that will be integrated with optimization code algorithms in the next step.
6. Simulation results and comparisons
Each particle is codded as a vector with 5 dimensions, M = [multiplicity of purchase server, multiplicity of database server, multiplicity of thread for processing request task, multiplicity of thread for check avail-ability task, and multiplicity of thread for Database manager task]. The lower and upper boundaries of each dimension are set to 1 and 20.
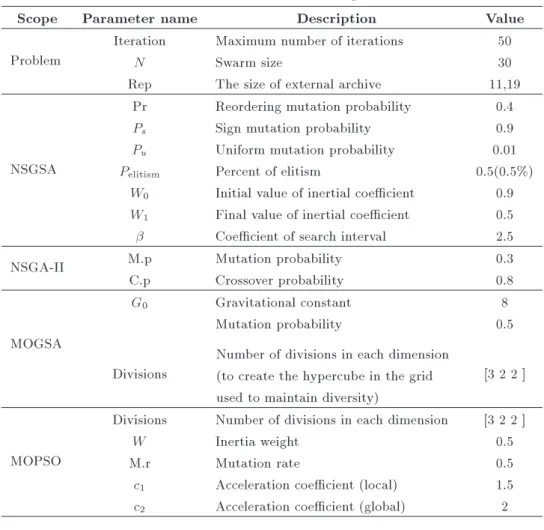
Four mentioned algorithms are congured accord-ing to the parameters, and their values are enlisted in Table 4. The problem section shows the shared parameter between all optimization algorithms.
These parameters include the number of iterations (Iteration), number of particles in the swarm (Swarm size) and archive size. In multi-objective optimization algorithms, an external archive is dened that keeps all the non-dominated (best) solutions. Special parame-ters of each algorithms are briey described in Table 4. These parameters have been congured based on the most common values in the literatures. In the future research, adaptive version of these algorithms can be used to tune the parameters.
Figure 6. Activity diagram of E-shop system. Table 2. Component diagram annotation.
Tag value Element Purchase Database
PoolSize Component 1 1
SchedPolicyKind Component Fcfs Fcfs
Port-db-purchase Port-purchase-item Port-get-request
Mapping Port 0.5 0.5 0.5
Table 3. Activity diagram annotation. Purchase
Tag value Processing request
Check
availability Database manager
Poolsize 1 1 1
Priority 0 0 0
Pro
cess
Get
info
item
Get
info
from
db
Send
resp
onse
Chec
k
av
ailabilit
y
Resp
onse
from
db
Pro
duct
massage
Get
price
Price
and
purc
hase
instruction
Get
resp
onse
Pro
cess
query
Insert
query
Select
query
Up
date
query
Send
resp
onse
Host demand 1 1 1 1 1 1 1 1 1 1 1 1 2 3 1
In NSGSA and MOGSA, the gravitational con-stant, G, will take an initial value, G0, and it will be reduced with time according to:
G(i) = G0 (1 i=Iteration); (5) where i is the current iteration number.
Experiments are run in 2 states; in the rst mode the archive size is set to 11, and in the other state the archive size is 19, and all experiments are repeated. The results of 20 independent runs of each algorithm are saved in a database. Thus, for each algorithm, 20 sets of non-dominated solutions are achieved.
Figure 7 shows the behavior of NSGSA in the Last iterations. Also, 6 members from 19 non-dominated solutions of Pareto front are shown in Table 5. This solutions are presented to software architecture who makes various trade-os, or compromises among bot-tleneck strength, response time and cost, and chooses one solution.
The performance of used algorithms is evaluated using three important metrics. These metrics are selected because they do not require known Pareto optimal front. We review each metric and analyze the results.
Table 4. Parameters values of 4 algorithms.
Scope Parameter name Description Value
Problem
Iteration Maximum number of iterations 50
N Swarm size 30
Rep The size of external archive 11,19
NSGSA
Pr Reordering mutation probability 0.4
Ps Sign mutation probability 0.9
Pu Uniform mutation probability 0.01
Pelitism Percent of elitism 0.5(0.5%)
W0 Initial value of inertial coecient 0.9 W1 Final value of inertial coecient 0.5
Coecient of search interval 2.5
NSGA-II M.p Mutation probability 0.3
C.p Crossover probability 0.8
MOGSA
G0 Gravitational constant 8
Mutation probability 0.5
Divisions
Number of divisions in each dimension (to create the hypercube in the grid used to maintain diversity)
[3 2 2 ]
MOPSO
Divisions Number of divisions in each dimension [3 2 2 ]
W Inertia weight 0.5
M.r Mutation rate 0.5
c1 Acceleration coecient (local) 1.5
c2 Acceleration coecient (global) 2
Figure 7. Obtained results and the behavior of NSGSA.
6.1. Coverage metric
The coverage metric [34] calculates the percentage of solutions in a certain approximation set which is dom-inated or equal to any solution in another competing approximation set. This metric is computed as:
C(A; B) = jfb 2 B=9a 2 A : a bgjjBj : (6)
Table 5. Six selected members from 19 members of Pareto front.
Bottleneck Strength
(BS)
Response
time Cost
1.34 51.97 38
1.21 53.25 33
1.29 52.77 24
0.81 69.31 18
0.80 102.93 9
0.99 173.40 6
If all points in A dominate or are equal to all points in B, then by denition C = 1. C = 0 implies the opposite. In general, C(A; B) and C(B; A) both have to be considered due to set intersections not being empty. If C(A; B) = 1 and C(B; A) = 0 then A is better than B.
Coverage metric is computed for each pair of algorithms. Note that the concept and value of C(A; B) is dierent from C(B; A). Therefore, in addition to computing C(A; B), C(B; A) is also computed. For example, cell in the NSGA-II row and the NSGSA column shows the result of C(NSGSAII, NSGSA) and
by replacing the row and column, the cell shows the result of C(NSGSA, NSGSAII).
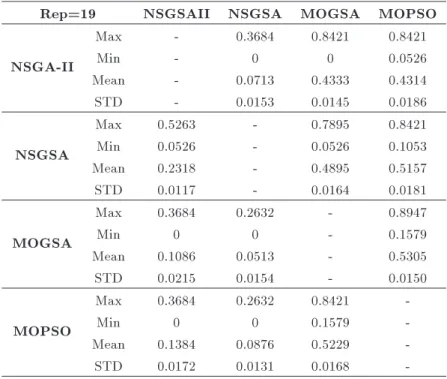
Statistical analysis has been performed on the coverage metric of 20 independent runs of four algo-rithms; Table 6 shows the results when the size of archive is 11, and Table 7 shows the results when it is 19. STD is the standard deviation that is useful for stability evaluation of the results of the algorithm. A lower value of STD implies the more stability of the
algorithm. By analyzing the results, these conclusions can be obtained:
1. NSGSA is certainly better than other algo-rithms. Mean and max of C(NSGSA, NSGA-II) > C(NSGA-II, NSGSA);
2. Mean and max of C (NSGSA, MOGSA) > C (NSGA-II, MOGSA) and C (NSGSA, MOPSO) > C (NSGA-II, MOPSO).
Table 6. Coverage metric; size of archive is 11.
Rep=11 NSGSAII NSGSA MOGSA MOPSO
NSGA-II
Max - 0.3636 0.8182 0.8182
Min - 0 0 0
Mean - 0.0550 0.3495 0.3702
STD - 0.0232 0.0214 0.0240
NSGSA
Max 0.7273 - 1.0000 0.9091
Min 0 - 0 0.0909
Mean 0.2127 - 0.4998 0.5095
STD 0.0329 - 0.0183 0.0300
MOGSA
Max 0.2727 0.0909 - 0.8182
Min 0 0 - 0.1818
Mean 0.0616 0.0145 - 0.4970
STD 0.0305 0.0168 - 0.0223
MOPSO
Max 0.3636 0.2727 1.0000
-Min 0 0 0.1818
-Mean 0.0766 0.0620 0.4882
-STD 0.0172 0.0305 0.0177
-Table 7. Coverage metric; size of archive is 19.
Rep=19 NSGSAII NSGSA MOGSA MOPSO
NSGA-II
Max - 0.3684 0.8421 0.8421
Min - 0 0 0.0526
Mean - 0.0713 0.4333 0.4314
STD - 0.0153 0.0145 0.0186
NSGSA
Max 0.5263 - 0.7895 0.8421
Min 0.0526 - 0.0526 0.1053
Mean 0.2318 - 0.4895 0.5157
STD 0.0117 - 0.0164 0.0181
MOGSA
Max 0.3684 0.2632 - 0.8947
Min 0 0 - 0.1579
Mean 0.1086 0.0513 - 0.5305
STD 0.0215 0.0154 - 0.0150
MOPSO
Max 0.3684 0.2632 0.8421
-Min 0 0 0.1579
-Mean 0.1384 0.0876 0.5229
-Note that based on the STD values NSGSA are more stable than NSGA-II.
Comparison results also show much dierence between NSGSA and NSGA-II with MOPSO and MOGSA. Therefore, non-dominated sorting based al-gorithms are better than others whose control policy of the archive is based on a grid.
The overall conclusions of coverage metric evalu-ation lead us to the following ranking: 1. NSGSA, 2. NSGA-II, 3. MOGSA, 4.MOPSO.
6.2. Diversity
Denition of diversity metric is as bellow [27]:
D = v u u tXn
i=1
max (kx0
i yi0k); (7)
where kx0
i y0ik is the Euclidean distance between of
the non-dominated solution xi and the non-dominated
solution yi. For each non-dominated solution, xi, in
the external archive, the Euclidean distance with the other solutions (yi) is calculated and the maximum
value (farthest solution) is selected. A higher value indicates a better answer that has provided the more diverse solutions.
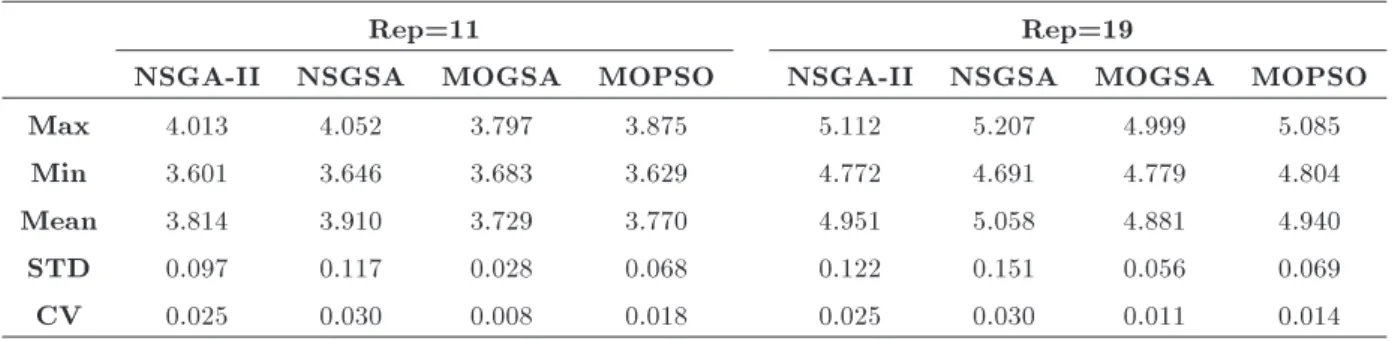
Since the scale of the objective function is dier-ent, the obtained values should be normalized between 0 and 1. Table 8 shows the diversity metric values of objectives. In both cases, with the size of 11 or 19 for archive, diversity of NSGSA is the best and MOPSO, NSGA-II and MOGSA are in subsequent positions, respectively. CV values show the stability
of the result of NSGSA and NSGA-II are more stable and their CVs are much better than those of MOPSO and MOGSA.
In this problem, diversity in the solution space is as important as diversity in the objective space. For example, it may be possible, that the objective space is very divers while the actual solutions in problem space are very similar. Therefore, it is important to establish which type of diversity is aimed at or whether both are equally important in the problem domain [35]. In the context of the bottleneck improvement, diversity in the solution space is very important because the solution space contains the parameters of software model, and dissimilar values provide more choices for software engineer. One solution proposes the values for the parameters of model. Diverse solutions provide dierent proposals. The Software architecture can choose one solution based on the resource availability or other considerations. Population diversity is presented in Table 9. Since the scales of the parameters in solution space are the same, they do not have to be normalized. The results show that NSGA is the best algorithm and has provided more stable solutions. NSGA-II is close to NSGSA but with large dierence, MOGSA and MOPSO are in rank three and four. 6.3. Spacing
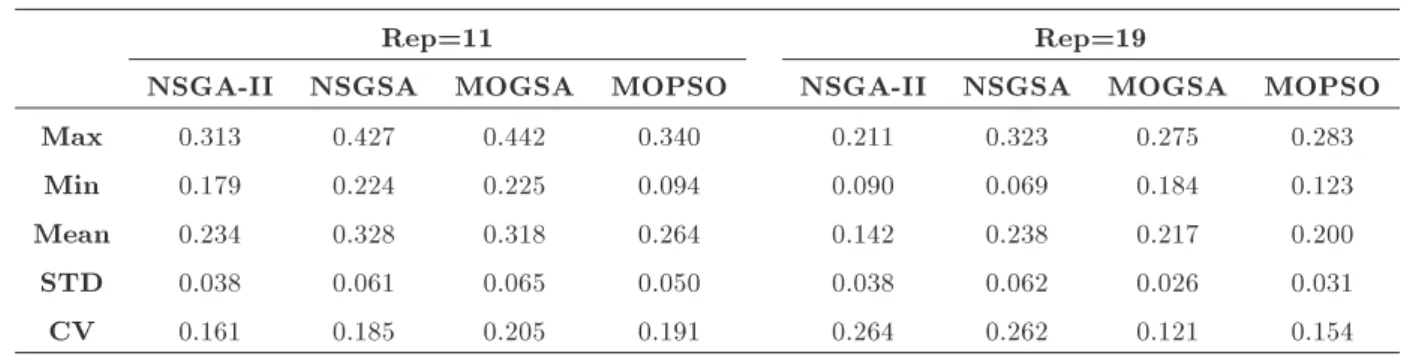
This metric demonstrates how uniformly the solutions in the objective space are distributed [28]. It is dened as:
S = r
1 n 1
X
di d2;
Table 8. Diversity metric in objective space.
Rep=11 Rep=19
NSGA-II NSGSA MOGSA MOPSO NSGA-II NSGSA MOGSA MOPSO
Max 4.013 4.052 3.797 3.875 5.112 5.207 4.999 5.085
Min 3.601 3.646 3.683 3.629 4.772 4.691 4.779 4.804
Mean 3.814 3.910 3.729 3.770 4.951 5.058 4.881 4.940
STD 0.097 0.117 0.028 0.068 0.122 0.151 0.056 0.069
CV 0.025 0.030 0.008 0.018 0.025 0.030 0.011 0.014
Table 9. Diversity metric in problem space.
Rep=11 Rep=19
NSGA-II NSGSA MOGSA MOPSO NSGA-II NSGSA MOGSA MOPSO
Max 0.520 0.600 0.340 0.380 0.522 0.533 0.322 0.300
Min 0.380 0.420 0.160 0.180 0.278 0.322 0.167 0.144
Mean 0.466 0.513 0.222 0.243 0.391 0.392 0.232 0.227
STD 0.048 0.056 0.043 0.042 0.053 0.048 0.041 0.039
Table 10. Spacing metric.
Rep=11 Rep=19
NSGA-II NSGSA MOGSA MOPSO NSGA-II NSGSA MOGSA MOPSO
Max 0.313 0.427 0.442 0.340 0.211 0.323 0.275 0.283
Min 0.179 0.224 0.225 0.094 0.090 0.069 0.184 0.123
Mean 0.234 0.328 0.318 0.264 0.142 0.238 0.217 0.200
STD 0.038 0.061 0.065 0.050 0.038 0.062 0.026 0.031
CV 0.161 0.185 0.205 0.191 0.264 0.262 0.121 0.154
di = min m
X
k=1
fi
k(x) fkj(y)
i; j = 1; ; n; (8) where d is the average of all di, m is the number of
objective functions, and n is the number of points in a Pareto optimal set. A zero value indicates that all members of solutions are uniformly spaced.
The dierent objectives have dierent scales. At rst, the obtained values are normalized between 0 and 1, then the spacing metrics are calculated. The nal results are shown in Table 10. These results show that NSGA-II is the best. NSGSA is close to it but MOPSO and MOGSA are very dierent. In addition, CV values conrm the stability of the results of the rst two algorithms. Although NSGSA focuses on spacing during the run, its spacing metric is not satised. Therefore, more study is needed about it.
7. Conclusion and future work
This paper presented an automatic UML based bot-tleneck improvement solution that optimizes strength bottleneck of the software model. Performance speci-cations of optimized model have been tuned so that strength bottleneck has been minimized. Response time and cost have also been considered. Therefor NSGSA and MOGSA, 2 multi-objective extension of GSA have explored problem space and presented best solutions. NSGA-II and MOPSO have also been applied and comprehensive comparisons and analysis of results have been presented.
Using this method, bottleneck detection and mit-igation are done during the SPE process, and extra evaluation was not required. This approach can be extended considering other quality criteria, such as reliability. Also bottleneck detection and measurement strategy can be improved.
Acknowledgments
This research is supported under contract number 1/1719 by the Institute of Science and High Technology
and Environmental Sciences, Graduate University of Advanced Technology, Kerman, Iran.
References
1. Neilson, J.E., Woodside, C.M., Petriu, D.C. and Majumdar, S. \Software bottlenecking in client-server systems and rendezvous networks", Software Engineer-ing, IEEE Transactions on, 21, pp. 776-782 (1995).
2. Jung, G., Swint, G., Parekh, J., Pu, C. and Sahai, A. \Detecting bottleneck in n-tier it applications through analysis",Large Scale Management of Distributed Sys-tems, pp. 149-160 (2006).
3. Kolia, S., Bendifallah, Z., Tribalat, M., Valensi, C., Acquaviva, J.-T. and Jalby, W. \Quantifying perfor-mance bottleneck cost through dierential analysis", In Proceedings of the 27th International ACM Confer-ence on International ConferConfer-ence on Supercomputing, pp. 263-272 (2013).
4. Dongarra, J.J. and Sorensen, D.C. \SCHEDULE: Tools for developing and analyzing parallel Fortran programs", Argonne National Lab., IL (USA) (1986).
5. Bennett, A.J. and Field, A. \Performance engineering with the UML prole for schedulability, performance and time: A case study", in Modeling, Analysis, and Simulation of Computer and Telecommunications Systems, (MASCOTS 2004), Proceedings. The IEEE Computer Society's 12th Annual International Sympo-sium on, pp. 67-75 (2004).
6. De Rose, L.A. and Reed, D.A. \SvPablo: A multi-language architecture-independent performance analy-sis system", in Parallel Processing, 1999. Proceedings. 1999 International Conference on, pp. 311-318 (1999).
7. Schumann, M. \Automatic performance prediction to support cross development of parallel programs", in Proceedings of the SIGMETRICS Symposium on Parallel and Distributed Tools, pp. 88-97 (1996).
8. Arcelli, D. and Cortellessa, V. \Software model refac-toring based on performance analysis: Better working on software or performance side?", arXiv preprint arXiv:1302.5171 (2013).
9. Franks, G., Petriu, D., Woodside, M., Xu, J. and Tre-gunno, P. \Layered bottlenecks and their mitigation",
in Quantitative Evaluation of Systems, QEST 2006. Third International Conference on, pp. 103-114 (2006).
10. Garousi, V. \UML model-driven detection of perfor-mance bottlenecks in concurrent real-time software", in Performance Evaluation of Computer and Telecom-munication Systems (SPECTS), International Sympo-sium on, pp. 317-324 (2010).
11. Martens, A., Koziolek, H., Becker, S. and Reussner, R. \Automatically improve software architecture models for performance, reliability, and cost using evolution-ary algorithms", in Proceedings of the First Joint WOSP/SIPEW International Conference on Perfor-mance Engineering, pp. 105-116 (2010).
12. Martens, A. and Koziolek, H. \Automatic,
model-based software performance improvement for
component-based software designs", Electronic Notes in Theoretical Computer Science, 253, pp. 77-93 (2009).
13. Koziolek, A., Koziolek, H. and Reussner, R. \Per-opteryx: Automated application of tactics in multi-objective software architecture optimization", in Pro-ceedings of the Joint ACM SIGSOFT Conference-QoSA and ACM SIGSOFT Symposium-ISARCS on Quality of Software Architectures-QoSA and Architect-ing Critical Systems-ISARCS, pp. 33-42 (2011).
14. Amoozegar, M. and Nezamabadi-pour, H. \Software performance optimization based on constrained GSA", in Articial Intelligence and Signal Processing (AISP), 16th CSI International Symposium on, pp. 134-139 (2012).
15. Smith, C.U., Performance Engineering of Software Systems, Addison-Wesley, 1, p. 990 (1990).
16. Smith, C.U. and Williams, L.G., Performance So-lutions: A Practical Guide to Creating Responsive, Scalable Software, 1, Addison-Wesley Boston, MA (2002).
17. OMG \UML prole for MARTE: Modeling and analy-sis of real-time embedded systems", Version 1.0 OMG Adopted Specication formal/2009-11-02 (November 2009).
18. Amoozegar, M. \A solution for performance evaluation of component-based software architecture", A Thesis Submitted in Partial Fulllment of The Requirement for degree of Master of Science in Software Engineering (2008).
19. Wu, X. and Woodside, M. \Performance modeling from software components", ACM SIGSOFT Software Engineering Notes, 29, pp. 290-301 (2004).
20. Franks, G., Maly, P., Woodside, M., Petriu, D.C. and Hubbard, A., Layered Queueing Network Solver and Simulator User Manual, Real-time and Distributed Systems Lab, Carleton University, Ottawa (2005).
21. Franks, G., Hubbard, A., Majumdar, S., Neilson, J.,
Petriu, D., Rolia, J., et al. \A toolset for perfor-mance engineering and software design of client-server systems", Performance Evaluation, 24, pp. 117-136 (1995).
22. Hubbard, A. \SPEX: Software performance exper-iment driver", http://www.sce.carleton.ca/rads/lqn/ lqn-documentation/spex.txt (August 1997).
23. Koziolek, H. \Performance evaluation of component-based software systems: A survey", Performance Evaluation, 67, pp. 634-658 (2010).
24. Woodside, M., Neilson, J.E., Petriu, D.C. and Ma-jumdar, S. \The stochastic rendezvous network model for performance of synchronous client-server-like dis-tributed software", Computers, IEEE Transactions on, 44, pp. 20-34 (1995).
25. Wu, X., An Approach to Predicting Performance for Component Based Systems, Carleton University (2003).
26. Reyes-Sierra, M. and Coello, C.A.C. \Multi-objective particle swarm optimizers: A survey of the state-of-the-art", International Journal of Computational Intelligence Research, 2, pp. 287-308 (2006).
27. Hyun, C.J., Kim, Y. and Kim, Y.K. \A genetic al-gorithm for multiple objective sequencing problems in mixed model assembly lines", Computers & Operations Research, 25, pp. 675-690 (1998).
28. Schott, J.R., Fault Tolerant Design Using Single and Multicriteria Genetic Algorithm Optimization, DTIC Document (1995).
29. Rashedi, E., Nezamabadi-pour, H. and Saryazdi, S. \GSA: a gravitational search algorithm", Information Sciences, 179, pp. 2232-2248 (2009).
30. Nobahari, H., Nikusokhan, M. and Siarry, P. \Non-dominated sorting gravitational search algorithm", in Proc. of the 2011 International Conference on Swarm Intelligence, ICSI, pp. 1-10 (2011).
31. Hassanzadeh, H.R. and Rouhani, M. \A multi-objective gravitational search algorithm", in Com-putational Intelligence, Communication Systems and Networks (CICSyN), Second International Conference on, pp. 7-12 (2010).
32. Cagnina, L., Esquivel, S. and Coello, C.A.C. \A parti-cle swarm optimizer for multi-objective optimization", Journal of Computer Science & Technology, 5, pp. 204-210 (2005).
33. Deb, K., Pratap, A., Agarwal, S. and Meyarivan, T. \A fast and elitist multiobjective genetic algorithm: NSGA-II", Evolutionary Computation, IEEE Transac-tions on, 6, pp. 182-197 (2002).
34. Zitzler, E. and Thiele, L. \Multiobjective optimiza-tion using evoluoptimiza-tionary algorithms-A comparative case study", in Parallel Problem Solving from Nature-PPSN V, pp. 292-301 (1998).
35. Burke, E. and Landa Silva, J. \The inuence of the tness evaluation method on the perfor-mance of multiobjective search algorithms", European Journal of Operational Research, 169, pp. 875-897 (2006).
Biographies
Maryam Amoozegar received her BSc degree in Software Engineering from Kharazmi (Teacher Train-ing) University of Tehran in 2003, and her MSc degree in Software Engineering from Iran University of Science and Technology in 2007. In 2012, she joined the Group of Computer and Information Technology at Institute of Science and High Technology and Environmental Sciences, Kerman, Iran, as a researcher. Her interested
research area includes, software modeling, software quality evaluation and soft computing.
Hossein Nezamabadi-pour received his BSc degree in Electrical Engineering from Shahid Bahonar Univer-sity of Kerman in 1998, and his MSc and PhD degrees in Electrical Engineering from Tarbait Moderres Uni-versity, Iran, in 2000 and 2004, respectively. In 2004, he joined the Department of Electrical Engineering at Shahid Bahonar University of Kerman, Kerman, Iran, as an Assistant Professor, and was promoted to Full Professor in 2012. Dr. Nezamabadi-pour is the author and co-author of more than 300 peer reviewed journal and conference papers. His interests include image processing, pattern recognition, soft computing, and evolutionary computation.