Sharif University of Technology
Scientia IranicaTransactions A: Civil Engineering www.scientiairanica.com
Integrating system dynamics and fuzzy bargaining for
quantitative risk allocation in construction projects
F. Nasirzadeh
a;, M. Rouhparvar
b, H. Mazandarani Zadeh
cand M. Rezaie
d a. Department of Civil Engineering, Faculty of Engineering, Payame Noor University, Tehran, P.O. Box 193954697, Iran.b. Department of Project Management and Construction, Science and Research Branch, Islamic Azad University, Tehran, P.O. Box 1683963811, Iran.
c. Department of Technical Engineering, Imam Khomeini International University, Qazvin, P.O. Box 3413863873, Iran. d. Department of Civil Engineering, Iran University of Science and Technology, Tehran, P.O. Box 3671734554, Iran. Received 11 November 2013; received in revised form 7 June 2014; accepted 9 August 2014
KEYWORDS Quantitative risk allocation; Bargaining game theory;
System dynamics; Fuzzy logic; Negotiation.
Abstract. Quantitative approaches to risk allocation have been developed to overcome the limitation of qualitative approaches, and to determine how the responsibility of risk should be shared between contracting parties. This paper integrates a system dynamics simulation scheme with fuzzy bargaining game theory for quantitative risk allocation. The behaviour of contracting parties in the quantitative risk allocation negotiation process is modelled as player behaviour in a game. A system dynamics based model is employed to determine the contractor and client costs (players' payos) at dierent percentages of risk allocation. Having determined the player payos, the common interval between player acceptable risk allocation percentages is determined. The bargaining process is then performed between two parties accounting for the common interval, and a desirable and equitable percentage of risk allocation is determined.
c
2015 Sharif University of Technology. All rights reserved.
1. Introduction
Construction projects are one-o endeavours having many unique features, such as lengthy periods of time, complicated processes, nancial intensity and dynamic organisation structures. Such organisational and tech-nological complexity generates enormous risks [1]. The outcome of all construction projects can potentially be aected, adversely and positively, by these constantly changing risks and opportunities [2]. Employing an eective risk management process plays a vital role in enhancing the performance of the project.
Construction projects involve dierent parties,
*. Corresponding author. Mobile: +98 912 3305032
E-mail addresses: [email protected] (F. Nasirzadeh); [email protected] (M. Rouhparvar);
[email protected] (H. Mazandarani Zadeh); [email protected] (M. Rezaie)
including the client, the contractor and the consultant. Each of these parties is responsible for, and should manage, certain risks. It is, therefore, necessary to allocate risks properly between the contracting parties before starting the risk management process.
Risk allocation is the process of identifying project risks and determining how they may be eq-uitably and realistically shared by all parties in a construction project [3]. Risk allocation is commonly performed through contract conditions and clauses. It is common that the owner tends to contractually pass the responsibility for most of the risks to the contractor under traditional procurement processes [4]. However, a one-sided attitude toward risk allocation, where one party tries to dispatch all risk to the other, most likely has unfavourable results for both transferees and transferors [5,6].
The risk allocation process can be performed qualitatively and quantitatively [7]. In qualitative
approaches to risk allocation, a matrix is developed to identify what type of risk is allocated to which party. However, qualitative approaches are limited in addressing issues, such as determining to what extent the involved parties share risk [5]. Therefore, quan-titative approaches to risk allocation, which determine how the responsibility of risk should be shared between contracting parties, have been developed.
There has been little research conducted in the area of quantitative risk allocation. Yelin et al. devel-oped a fuzzy synthetic evaluation model to determine an equitable risk allocation between the government and the private sector in Public Private Partnership (PPP) projects. The critical criteria for equitable risk allocation associated with PPP projects were identi-ed, and a quantitative model for risk allocation was developed by transforming the linguistic risk allocation principles into a quantitative decision making pro-cess [8]. Jin and Zhang proposed a model in which the determinants of ecient risk allocation were identied based on the transaction cost economic theory and a resource-based view of organisational capabilities. Accordingly, a theoretical framework was proposed to model the risk allocation decision-making process in PPP projects [9]. Medda developed a process of risk allocation between the public and private sector in transportation PPP infrastructure agreements, as a bargaining process between the two agents. The model analyzes the behaviour of players in a game framework when confronted with opposing objectives in the allo-cation of risk [10]. Yamaguchi et al. proposed a con-ceptual model of risk allocation developed for Private Finance Initiative (PFI) projects. They focused on how cost and prot are allocated between the government client and the private PFI contractor [7]. Nasirzadeh et al. proposed an integrated fuzzy-system dynamics approach for quantitative risk allocation. Using the proposed model, the project cost was simulated at dif-ferent percentages of risk allocation, and the optimum percentage of risk allocation was determined as a point at which the project cost is minimized [11,12].
In previous research, the behaviour of contracting parties in the quantitative risk allocation process that is similar to player behaviour in a game is not accounted for. Moreover, the quantitative risk allocation process is not performed on a cost-benet basis.
This research presents a new quantitative risk allocation approach by integrating a System Dynamics (SD) simulation scheme and fuzzy bargaining game theory. A system dynamics based model is employed to determine the contractor and client costs (player payos) at dierent percentages of risk allocation. The proposed SD model simulates the contractor and client costs, taking into account all inuencing factors, as well as the contractor's defensive strategies against unfair risk allocation.
Having determined the contractor and client costs at dierent percentages of risk allocation, an acceptable interval of risk allocation percentages is determined by each of the contracting parties (the players). The common interval between the players' acceptable risk allocation percentages is then determined. The players' discount factor is determined using a fuzzy inference mechanism. A bargaining process is then performed between two parties considering the common interval, and a desirable and equitable percentage of risk alloca-tion is determined. To evaluate the performance of the proposed method, it is implemented in a real pipeline project, and a quantitative risk allocation is performed for ination risk, which is one of the most signicant identied risks.
2. Model structure
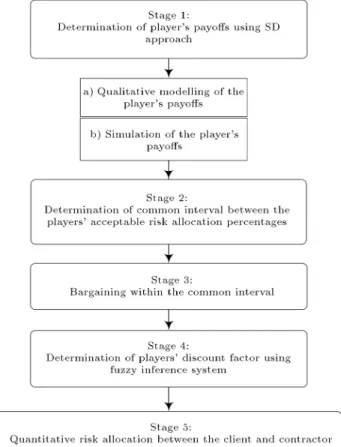
A owchart representing the dierent stages of the quantitative risk allocation process, performed using the proposed integrated SD-bargaining game model, is shown in Figure 1. Each stage is explained in detail in the following sections.
Stage 1: Determination of players' payos using SD approach. Payos are numbers that represent
Figure 1. Flowchart of the dierent stages of quantitative risk allocation process by the proposed integrated SD-bargaining game model.
the outcome of players' combination of strategies. Payos may represent prot, quantity, utility, or other continuous measures (cardinal payos), or may simply rank the desirability of outcomes (ordinal payos) [13]. In this research, the costs imposed onto the client and contractor at dierent percentages of risk allocation are considered as the players' payos.
There are various factors aecting the client and contractor costs in dierent risk allocation strategies. SD introduced by Forrester [14] is an object-oriented simulation methodology enabling one to model the complex inter-related structure of dierent factors aecting the contractor and client costs (the play-ers' payos) [11]. It is adequate for the modelling and simulation of systems that consist of multiple interdependent components, are highly dynamic, and which involve multiple feedback processes and non-linear relationships with both \hard" (quantitative) and \soft" (qualitative) data [15]. Therefore, SD is best suited for simulating player costs (players' payos) at dierent percentages of risk allocation [11]. The players' payos at dierent percentages of risk allocation are determined using the SD approach in two stages. First, a qualitative model of dierent factors aecting player payos is constructed. Having constructed the qualitative model of players' payos, the mathematical relationships (model equations) that exist between dierent factors are determined, and the qualitative modelling of the players' payos is performed. Thus, players' payos can be eciently modelled, simulated and quantied for dierent risk allocation strategies using the proposed SD modelling approach.
Stage 2: Determination of a common interval between the players' acceptable risk allocation percentages. In order for there to be bargaining between the client and contractor regarding risk allo-cation strategies (Stage 3), a common interval between the players' acceptable risk allocation strategies should be determined. If a common interval does not exist, the bargaining process between the two sides will not succeed, and they will not reach an agreement.
It should be stated that in order to determine the common interval between two players, rst, an acceptable interval of risk allocation percentages is selected by each player, accounting for his/her rational behaviour. The common interval between the players' acceptable risk allocation strategies is then determined.
Stage 3: Bargaining within the common in-terval. Quantitative risk allocation is often a multi-criteria, multi-decision-maker problem. Therefore, the behaviour of contracting parties in the risk allocation negotiation process is similar to players' behaviour
in a game. The bargaining process is similar to a negotiation process that may be modelled using the tools of game theory [16]. A bargaining situation is a situation in which players have a common interest to cooperate, but have conicting interests over exactly how to cooperate [13]. The bargaining process involves \alternating oers", where the client commences the bargaining by making an oer that the contractor can then accept or reject. Rejection leads to a counteroer by the recipient [17].
The main component in the bargaining process is the \bargaining cost". The bargaining cost will be induced in each bargaining round in order to make a counteroer if one player rejects the oer by his counterpart. It also reects loss due to costly delayed agreements [13].
During the bargaining process, each player is aware of the maximum and minimum values of the other player's payos. Each player knows that if his/her oer is unfair, the other player will reject it, and the bargaining will continue to another stage. It is obvious that in order to avoid bargaining costs, it is better to reach an agreement at the rst stage of bargaining.
Let Mo and mo denote the maximum and
mini-mum value of the client's payo, respectively, and Mc
and mc denote the maximum and minimum value of
the contractor's payos, respectively. The client makes the rst oer, and knows that the contractor can obtain the maximum payo of Mc and minimum payo of mc
at the second stage if he rejects the client's oer at the rst stage. If the client wants his oer to be accepted by the contractor, his oer should be between the present value of the maximum (PVMc) and minimum
(PVmc) contractor's payos at the second stage, where
PVMc = cMc and PVmc = cmc. i is the ith player
discount factor. This transfers the value of the next stage to the present value and is dened as i= 1+r1i,
where ri is the rate of return or time preference for
player i, and 0 i 1. A larger i, means that
the player is more patient and, in fact, indicates the bargaining power of the players [18]. The maximum and minimum of the client's payos are calculated as given below:
Mo S cmc; (1)
mo S cMc; (2)
where S is the total benet for which the players are bargaining. If the contractor rejects the client's oer, he will make a counteroer. At the second stage, the contractor is aware of the maximum (PVMo) and
minimum (PVmo) of the client's payos at the third
stage. Therefore, the contractor's reasonable oer should be between PVMo = oMo and PVmo = omo.
The maximum and minimum of the contractor's payos are given below:
Mc S omo; (3)
mc S oMo: (4)
If the bargaining process were continued, the odd and even stages would be similar to the rst and second stages, respectively. By applying ( c) to Eq. (3) and
comparing with Eq. (2), the results are as follows: S cMc S Sc+ como; (5)
mo S cMc S Sc+ como; (6)
mo(1 1 c) S
oc : (7)
Additionally, by applying ( c) to Eq. (4) and
com-paring with Eq. (1), the results are as follows:
S cmc S Sc+ coMo; (8)
Mo S cmc S Sc+ coMo; (9)
Mo (1 1 c) S
oc : (10)
Therefore:
Mo= mo=(1 1 c) S
oc ; (11)
Mc = mc= S (1 1 c) S oc =
c(1 o) S
1 oc : (12)
So, if at the rst stage of the bargaining process, the client who initiates the bargaining makes an Sc =
c(1 o)S
1 oc oer, it would be acceptable for the
con-tractor, and the client payo would be So= (1 1 co)Sc .
Stage 4: Determination of players' discount factors using a fuzzy inference system. The nal results of the bargaining are highly dependent on the players' discount factors. In the other words, the value of the discount factor plays an important role in the nal results and whether an equitable agreement is reached.
In this research, the value of the discount factor is assessed using a Fuzzy Inference System (FIS), based on the values of the input factors. The FIS performs approximate reasoning with imprecise or vague depen-dencies and commands. A fuzzy inference method consists of all the steps required to map some input to a crisp output by using fuzzy logic [19]. In this research, a \Mamdani style" inference mechanism [20]
is implemented to determine the value of the players' discount factors. The fuzzy inference system consists of three major components: fuzzication, inference mechanism and defuzzication [21].
These stages will be explained below, in Stage 3 of the case study.
Stage 5: Quantitative risk allocation between the client and contractor. Having performed stages 1 to 4, a bargaining process is performed between the contractor and client considering the common inter-val, and, nally, a desirable and equitable percentage of risk allocation is determined.
3. Model application
To evaluate the performance of the proposed risk allo-cation model, it was implemented in a 150 km pipeline project, namely, the Dez-Qomrood Water Transmission Tunnel Project, which was carried out to transfer water from the sources of Dez and Karoon. The project is located in Iran and was constructed in 2012. The contract is on a unit price basis equal to 650,000 dollars per kilometre. According to preliminary estimates, the project would be executed within 930 days. In this project, the quantitative risk allocation process was performed for ination risk; one of the most signicant identied risks.
Stage 1: Determination of players' payos using SD approach. To determine the players' payos at dierent percentages of risk allocation, rst, a quali-tative model of dierent factors aecting the players' payos was developed. The qualitative model of the players' payos for ination risk, which is one of the most important identied risks, is presented in Figure 2 [22]. SD consists of components, including the causal loop diagram, the stock and ow diagram and level and rate variables [23]. As shown in this gure [22], both the client and contractor costs consist of workforce, equipment and material costs. In the event of ination risk, the workforce, equipment and material costs will increase, leading to an increase in the client and contractor costs (Figure 2).
The client and contractor costs are also inuenced by the defensive strategies that may be implemented by the contractor against one-sided risk allocation. As shown in Figure 2, the amount of cost overrun arising from the ination risk is shared by the contractor and client, based on the specied risk allocation percentage. Because of the cost overrun caused by the occurrence of ination risk, the contractor may implement alterna-tive defensive strategies, such as lowering work quality, lodging claims, dispute and litigation (Figure 2).
These defensive strategies may reduce contractor cost overruns arising from ination risk. However, the
Figure 2. The cause-eect loops of qualitative model of players' payos at dierent percentages of risk allocation.
client costs arising from ination risk are increased due to these defensive strategies.
Having constructed the qualitative model of player payos at dierent risk allocation strategies, the mathematical relationships (model equations) that exist between dierent factors were determined, so that the player payos at dierent risk allocation strategies could be eciently modelled, simulated and quantied using the proposed SD modelling approach. Table 1 represents the simulated values of player payos at dierent percentages of risk allocation.
Stage 2: Determination of a common interval between the players' acceptable risk allocation percentages. Having determined the values of the players' payos at dierent percentages of risk alloca-tion, the acceptable interval of risk allocation percent-ages was chosen by the client (Ro) and contractor (Rc)
as follows:
25 Ro 60; (13)
50 Rc 100: (14)
The common interval existing between the players' acceptable risk allocation percentages was nally de-termined to be from 50 to 60.
Stages 3, 4: Determination of players' discount factors and bargaining within the common in-terval. The fuzzy inference system was rst used to determine the value of the players' discount factor,
Table 1. The payos for the client and contractor (consequences of ination risk) at dierent percentages of risk allocation.
Risk allocation to the client
Client costs ($)
Contractor costs ($)
0% 24672000 23999300
5% 24177000 22777300
10% 21723000 21247300
15% 21607000 20451300
20% 21503000 19433300
25% 19610000 17817300
30% 19608000 16885300
35% 19180000 15606300
40% 19140000 14543300
45% 18572000 13382300
50% 18722000 12044300
55% 19722000 10946300
60% 19766000 9660300
65% 20641000 8524300
70% 21119000 7335300
75% 21301000 6098300
80% 21681000 4821300
85% 22376000 3648300
90% 22739000 2426400
95% 23462000 1226000
Table 2. The value of input factors aecting the client's discount factor (the values are based on a scale from 1-10).
Input factors Value
Contractor's past performance 7
Work specialty 8
The signicance of project commencement date 3 Table 3. The value of input factors aecting the contractor's discount factor (the values are based on a scale from 1-10).
Input factors Value
Contractor's expertise in specic works 4 Demand to a new project 6 Contractor's past performance 7
based on the values of dierent inuencing factors. Based on the interview conducted for this project, the most important factors aecting the client's discount factor were determined to be the signicance of the project commencement date, work skills and the past performance of the contractor. Similarly, the most important factors aecting the contractor's discount factor were determined to be the contractor's expertise in specic work; the demands to a new project and the past performance of the contractor. Tables 2 and 3 show the values of the input factors aecting the client's and contractor's discount factors, respectively.
The players' discount factor was determined us-ing three steps, namely, fuzzication, inference and defuzzication, as explained below.
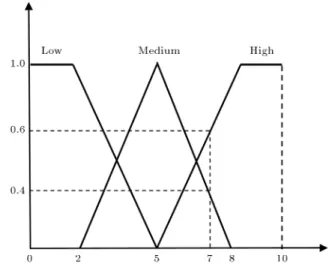
Fuzzication: On the basis of fuzzy set theory, the possibility for a variable to belong to a group is the degree of membership of the variable in the fuzzy set [24]. The fuzzication module transforms the input data into a linguistic form. The terms of the linguistic variables are fuzzy sets with a certain shape [25]. It is popular to use trapezoidal or triangular fuzzy sets because of computational eciency [21].
Figure 3 shows the membership function values for the variation of three input factors that aect the client and contractor discount factors. For example, if the contractor's past performance is chosen as 7 by the expert, it means that the contractor's past performance belongs to high and medium, with a condence level of 0.6 and 0.4, respectively (Figure 3). Similarly, Figure 4 shows the membership function values for the variation of the output variable (discount factor).
Fuzzy inference mechanism: The fuzzy inference mechanism identies the rules that apply to the fuzzi-ed values of the input variables and dfuzzi-educts the output linguistic terms that describe the status of
Figure 3. Membership functions of input factors aecting the client and contractor discount factors.
Figure 4. Membership functions of client and contractor discount factors.
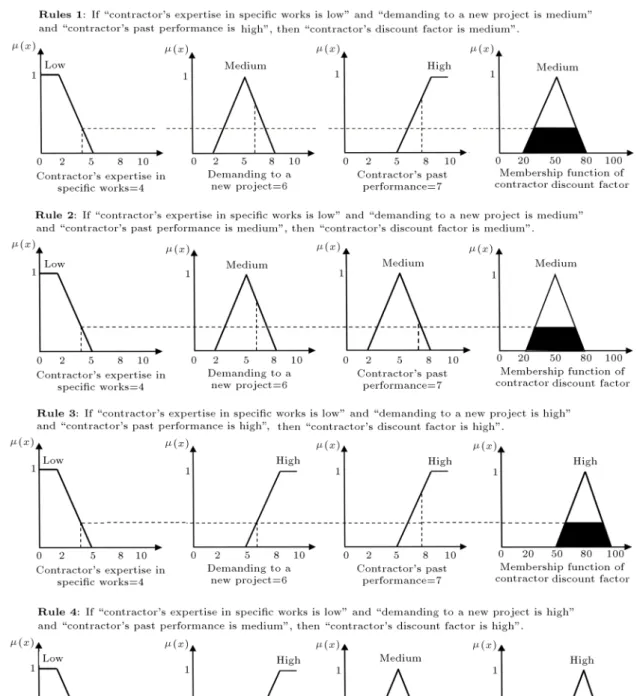
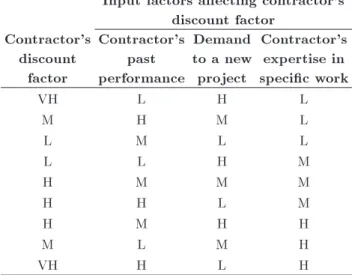
the output variable [26]. In other words, these rules connect the fuzzied inputs to fuzzy outputs. Tables 4 and 5 show the rules used for determining the client and contractor discount factors, respectively. In these tables, VH is \very high", H is \high", M is \medium", L is \low" and VL is \very low". There exist a total number of 27 fuzzy control rules for each player. As an example, rule 1 is expressed as follows.
If the signicance of the project commencement date = Low, work specialty = Low and contractor's past performance = Low, then, the client's discount factor = Very High (Table 4).
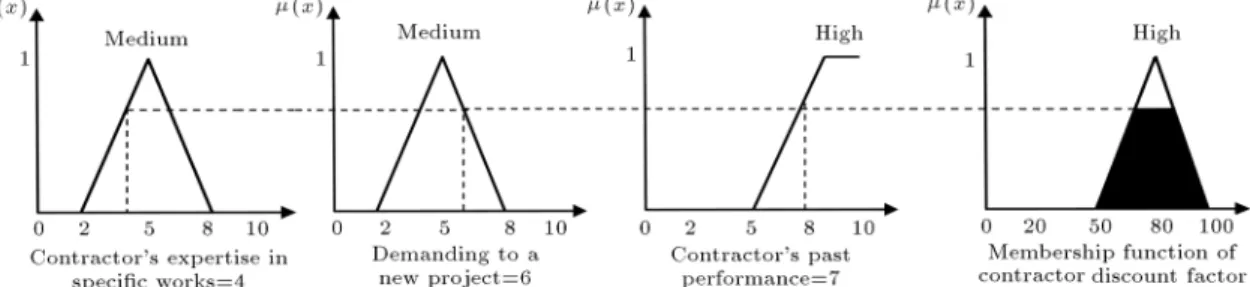
Defuzzication: Defuzzication is the process of producing a non-fuzzy number; a single value that adequately represents the fuzzy number [27]. The centre of area method was utilized for defuzzication of the fuzzy sets determined by the inference mechanism. Using the proposed defuzzication method, the value of the client's discount factor (o) was calculated
as 70.1%. Similarly, the value of the contractor's discount factor (c) was calculated as 45.8%. Figure 5
graphically depicts the fuzzication, inference and defuzzication process performed for determining the contractor's discount factor.
Figure 5. Fuzzication, inference and defuzzication process performed for determining contractor's discount factor (continued).
Having determined the client and contractor dis-count factors, bargaining was performed on the com-mon interval existing between the players' acceptable risk allocation percentages to produce a desirable and equitable risk allocation strategy. The common interval existing between the players' acceptable risk allocation percentages was nally determined to be from 50 to 60. Therefore, the desirable and equitable percentage of risk allocation will be in the range of 50 to 60, and the bargaining would be performed within this com-mon interval to determine the desirable and equitable percentage of risk allocation.
In fact, the players bargain on the benet of S = 10%. This benet is shared between the client and contractor using Eqs. (11) and (12) as follows:
So= (1 (1 c) S oc) ;
So= 80% 10% = 8%; (15)
Sc= (1 1 o) S oc ;
Table 4. Fuzzy inference rules for the client's discount factor.
Input factors aecting client discount factor Client's discount factor Contractor's past performance Work specialty Signicance of project commencement date
VH L L L
H L M L
L H H L
M M M M
M L H M
L H H M
L H L H
L M M H
VL H H H
Notes: L: Low, M: Medium, H: High.
Table 5. Fuzzy inference rules for contractor's discount factor.
Input factors aecting contractor's discount factor Contractor's discount factor Contractor's past performance Demand to a new project
Contractor's expertise in specic work
VH L H L
M H M L
L M L L
L L H M
H M M M
H H L M
H M H H
M L M H
VH H L H
Notes: L: Low, M: Medium, H: High.
where So and Sc denote client and contractor shares
from the benet, respectively.
Stage 5: Quantitative risk allocation between the client and contractor. Finally, the percentages of the risk allocated to the client and contractor are calculated as follows:
Ro= 60% 8% = 52%; (17)
Rc= 50% + 2% = 52%; (18)
where Ro and Rc denote the percentages of the risk
allocated to the client and contractor, respectively. It is, therefore, concluded that to have a desirable and equitable risk allocation strategy, 52 percent of the
consequences associated with the ination risk should be allocated to the client, and the remaining 48 percent should be allocated to the contractor.
The achieved result may represent the desirable and equitable percentage of risk allocation eciently, since the behaviour of contracting parties in the risk allocation negotiation process is taken into account. It is believed that the proposed integrated SD-fuzzy bargaining model oers a powerful tool by which a win-win sharing of risk responsibilities between the client and contractor may be achieved.
Acknowledgment
The authors are grateful for the nancial support received for this research from Payame Noor University.
Conclusions and remarks
Construction projects involve dierent parties, such as the client, the contractor and the consultant. Each of these parties is responsible for, and should manage, certain risks. It is, therefore, necessary to allocate risks properly between the contracting parties before beginning the risk management process.
In this research, a new quantitative risk allocation approach was presented by integrating a system dy-namics simulation scheme and fuzzy bargaining game theory. A system dynamics based model was employed to determine the contractor and client costs (the play-ers' payos) at dierent percentages of risk allocation. The proposed SD model simulated the contractor and client costs, taking into account all inuencing factors, as well as the contractor's defensive strategies against unfair risk allocation. Having determined the contractor and client costs at dierent percentages of risk allocation, an acceptable interval of risk allocation percentages was determined by each of the contracting parties (the players). The common interval between the players' acceptable risk allocation percentages was then determined. The players' discount factor was determined using a fuzzy inference mechanism. A bargaining process was then performed between the two parties considering the common interval, and a desirable and equitable percentage of risk allocation was nally determined.
To evaluate the performance of the proposed risk allocation model, it was implemented in a pipeline project, and quantitative risk allocation was performed for ination risk; one of the most signicant identied risks. It was concluded that a desirable and equitable risk allocation strategy is attained with 52 percent of the consequences associated with ination risk al-located to the client, and the remaining 48 percent allocated to the contractor.
of contracting parties in the risk allocation negotiation process. It is believed that the proposed integrated SD-fuzzy bargaining model oers a powerful tool by which a win-win sharing of risk responsibilities between the client and contractor may be achieved.
References
1. Zou, P.X.W., Zhang, G. and Wang, J. \Understanding the key risks in construction projects in China", International Journal of Project Management, 25(6), pp. 601-614 (2007).
2. Loosemore, M. and McCarthy, C.S. \Perceptions of contractual risk allocation in construction supply chains", Journal of Professional Issues in Engineering Education and Practice, 134(1), pp. 95-105 (2008). 3. The American Council of Engineering Companies
and the Associated General Contractors of America (ACEC), Enlightened Risk Allocation (2005).
4. Lam, K.C., Wang, D., Lee, P.T.K. and Tsang, Y.T. \Modeling risk allocation decision in construction con-tracts", International Journal of Project Management, 25(5), pp. 485-493 (2007).
5. Levitt, R.E., Logcher, R.D. and Ashley, D.B. \Allocat-ing risk and incentive in construction", Journal of the Construction Division, 106(3), pp. 297-305 (1980). 6. Pipattanapiwong, J. \Development of multi-party risk
and uncertainty management process for an infras-tructure project", PHD Thesis, Kochi University of Technology, pp. 1-236 (2004).
7. Yamaguchi, H., Uher, T.E. and Runeson, G. \RISK allocation in PFI projects", Proceedings of 17th AR-COM Annual Conference, University of Salford, UK (2001).
8. Yelin, X.U., Albert, P.C.C. and Yeung, J.F.Y. \Devel-oping a fuzzy risk allocation model for PPP projects in China", Journal of Construction Engineering and Management, 136(8), pp. 894-903 (2010).
9. Jin, X.-H. and Zhang, G. \Modeling optimal risk allocation in PPP projects using articial neural net-works", International Journal of Project Management, 29(5), pp. 1-13 (2010).
10. Medda, F. \A game theory approach for the allocation of risks in transport public private partnerships", International Journal of Project Management, 25(3), pp. 213-218 (2007).
11. Nasirzadeh, F., Khanzadi, M. and Rezaie, M. \Dy-namic modeling of the quantitative risk allocation in construction projects", International Journal of Project Management, 32(3), pp. 442-451 (2014). 12. Nasirzadeh, F., Khanzadi, M. and Rezaie, M. \System
dynamics approach for quantitative risk allocation", International journal of industrial engineering and production research, 24(3), pp. 237-246 (2013).
13. Shen, L.Y., Bao, H.J., Wu, Y.Z. And Lu, W.S. \Using bargaining-game theory for negotiating concession pe-riod for BOT-type contract", Journal of Construction Engineering and Management, 133(5), pp. 385-392 (2007).
14. Forrester, J., Industrial Dynamics, MIT Press, Cam-bridge, England (1961).
15. Sterman, J.D., System Dynamics Modeling for Project Management, MIT Press, Cambridge, England (1992). 16. Osborne, M.J. and Rubinstein, A., A Course in Game Theory, Fifth Ed., MIT Press, Cambridge, England (1998).
17. Rubinstein, A. \Perfect equilibrium in a bargaining model", Econometrica, 50(1), pp. 97-109 (1982). 18. Fishburn, P.C. and Rubinstein, A. \Time preference.
International economic review", 23(3), pp. 677-694 (1982).
19. Sabounchi, N.S.Z., Triantis, K., Sarangi, S. and Liu, S. \Fuzzy modeling of linguistic variables in a system dynamics context", Proceedings of 29th International Conference of the System Dynamics Society, Washing-ton, DC: System Dynamics Society (2011).
20. Mamdani, E.H. and Assilian, S. \An experiment in linguistic synthesis with a fuzzy logic controller", International Journal of Man-Machine Studies, 7(1), pp. 1-13 (1975).
21. Zimmermann, H.J., Fuzzy Set Theory and Its Applica-tion, Forth Ed., Kluwer Academic Publishers, Boston, Drodrecht and London (2001).
22. Nasirzadeh, F., Khanzadi, M. and Rezaie, M. \System dynamics approach for quantitative risk allocation", International Journal of Industrial Engineering and Production Research, 24(3), pp. 237-246 (2014). 23. Yousse, H., Saeid Nahaei, V. and Nematian, J. \A
new method for modeling system dynamics by fuzzy logic: Modeling of research and development in the national system of innovation", Journal of Mathemat-ics and Computer Science, 2(1), pp. 88-99 (2011). 24. Shen, L., Wu, Y. and Zhang, X. \Key assessment
indi-cators for the sustainability of infrastructure projects", Journal of Construction Engineering and Manage-ment, 137(6), pp. 441-451 (2011).
25. Nasirzadeh, F., Afshar, A., Khanzadi, M. and How-ick, S. \Integrating system dynamics and fuzzy logic modeling for construction risk management", Journal of Construction Management and Economics, 26(11), pp. 1197-1212 (2008).
26. Li, J., Moselhi, O.P.E. and Alkass, S.P.E. \Forecasting project status by using fuzzy logic", Journal of Con-struction Engineering and Management, 132(11), pp. 1193-1202 (2006).
construction project risk assessment", International Journal of Project Management, 29(2), pp. 220-231 (2011).
Biographies
Farnad Nasirzadeh has a PhD degree in construction engineering and management. He is currently an associate professor at the Department of Civil Engi-neering in Payame Noor University (PNU). His main prociency is in the area of project risk management and modeling and simulation of construction projects. Mehdi Rouhparvar has an MSc degree in con-struction engineering and management. His main
prociency is in the area of claim management, site layout, game theory and project risk management. Hamed Mazandarani Zadeh has a PhD degree in water resources planning and management. He is currently an assistant professor at the water engi-neering group in engiengi-neering and technology faculty, Imam Khomeini International University (IKIU). His main prociency is in the area of conict resolution, optimization and fuzzy decision making.
Mehdi Rezaie has an MSc degree in construction engineering and management. His main prociency is in the area of modeling using system dynamics and project risk management.