Genetic Algorithm Based Fuzzy Multi-Objective
Approach to FACTS Devices Allocation
in FARS Regional Electric Network
M. Gitizadeh
1;and M. Kalantar
1In this investigation, a novel approach is presented to nd the optimum locations and capacity of Flexible AC Transmission Systems (FACTS) devices in a power system using a fuzzy multi-objective function. Maximising the fuzzy satisfaction allows the optimization algorithm to simultaneously consider the multiple objectives of the network to obtain active power loss reduction; i.e., new FACTS devices cost reduction, robustifying the security margin against voltage collapse, network loadability enhancement and a voltage deviation reduction of the power system. A Genetic Algorithm (GA) optimization technique is then implemented to solve the fuzzy multi-objective problem. Operational and control constraints, as well as load constraints, are considered for optimum device allocation. Also, an estimated annual load prole has been utilized in a Sequential Quadratic Programming (SQP) optimization sub-problem to nd the optimum location and capacity of FACTS devices, accurately. A Thyristor Controlled Series Compensator (TCSC) and a Static Var Compensator (SVC) are utilized as series and shunt FACTS devices in this study. The Fars regional electric network is selected as a practical system to validate the performance and eectiveness of the proposed method.
Keywords: FACTS devices allocation; Multi-objective optimization; Genetic algorithm; Fuzzy.
INTRODUCTION
These days, the importance of a power system design and operation with high eciency, maximum reliability and security has to be considered more than ever. Some diculties, such as right of way and transmission line expansion, force the use of the maximum capacity of transmission lines and, therefore, providing voltage stability, even under normal conditions, becomes more dicult. This problem is serious, due to the fact that the main duty of generation units is based on active power generation rather than reactive power compensation.
Flexible AC Transmission Systems (FACTS) de-vices, as modern compensators of active and reactive powers, can be considered viable options in providing
1. Center of Excellence for Power System Automation and Operation, Department of Electrical Engineering, Iran University of Science and Technology, Tehran, 16844, Iran.
*. To whom correspondance should be addressed. E-mail: [email protected]
voltage security constraints and their feasibility in power systems, simultaneously, because of their fast re-sponses against perturbations in urgent circumstances, exible performance under normal conditions and their ability to be used in dynamic situations. Note that it is also possible to consider the global voltage stability indicator in FACTS devices allocation problems.
In order to allocate the FACTS devices accord-ing to their characteristics, various objectives have been considered. For instance, static voltage stability enhancement [1-4], violation diminution of the line thermal constraints [5], network loadability enhance-ment [6,7], power loss reduction [8], voltage prole improvement [6] and the fuel cost reduction of power plants using optimal power ow [9] are some objectives for tasks reported in the literature. Furthermore, to approach these objectives, some simplications, such as using single objective optimization, neglecting the investment budget as a part of the objective function, and allocation, based on decoupled active and reactive components in the presence of a multi-objective func-tion [9], have been made. These assumpfunc-tions cause some problems such as, an inability to use the powerful
advantages of FACTS devices, impractical allocation results and inaccurate solutions of the problem. It is noted that each of the mentioned objective improves the power system network operation and approaching them is the aim of all power system networks. It is obvious that minimum power loss leads to the optimum operation of power system lines. Therefore, none of the mentioned objectives can be neglected for FACTS devices allocation. On the other hand, the allocation of unlimited FACTS devices, according to one or more objectives, without considering the cost of devices cannot be justied [6].
The aim of this investigation is to improve previ-ous research in the eld of FACTS devices allocation in power systems. That means, static voltage stability enhancement, network loadability enhancement, power loss reduction and voltage prole improvement are considered as allocation objectives, and the reduction of power loss and FACTS devices investment costs are also considered in the objective function. Note that the alleviation of both cost factors is taken into account in the allocation problem. Despite previous work and in an eort to approach a practical solution, an estimated annual load prole has been considered to calculate power loss and voltage violation. The FACTS devices are assumed to be the Thyristor Controlled Series Compensator (TCSC) and the Static Var Compensator (SVC) in this study. Therefore, the logical solution of allocation is to satisfy the mentioned objectives in a multi-objective optimization.
One of the necessities of a multi-objective op-timization problem is providing a scheme that can simultaneously translate all the objectives into a sin-gle optimization problem. The optimization problem needs to have the ability to take all the predetermined objective values by the designer. In this paper, an approach based on a fuzzy evaluation technique [10], combined with a genetic algorithm, is used to com-promise between contradictory objectives. Also, in order to implement an estimated annual load prole to accurately nd the optimum location and capacity of FACTS devices, a Sequential Quadratic Programming (SQP) optimization sub-problem has been used as part of an overall optimization procedure.
The article is organized as follows: First the math-ematical concept of multi-objective allocation is pre-sented, and the models of TCSC and SVC are described that have been used for static security enhancement. Then, a fuzzy evaluation technique into GA, to replace the tness function for constituting a multi-objective optimal model and implemented optimization proce-dure, has been described. After that, the results of the proposed method, on the IEEE 14-Bus test system and the Fars regional electric network, are presented and analyzed. The locations and amounts of the nominated devices that satisfy the mentioned objectives are also
determined and nally, the conclusion of the paper is presented.
PROBLEM FORMULATION AND OBJECTIVE FUNCTION
In this section, the mathematical formulation of FACTS devices allocation is presented. The procedure is based on multi-objective optimization, which is concerned with an attempt to minimize each objective, simultaneously.
Objective Functions
Three objective functions have been considered in this article. The rst one is related to active power loss, investment cost and peak point power generation. This objective minimizes active power loss cost, the investment cost of proposing FACTS devices and peak point power generation. It can be expressed as:
f1(x; u; z) = Ke
X
i
(Plossi(x; u; z)Ti)
+ KiCinvestment(z) + KpPpeak(x; u; z); (1)
where Cinvestment(z) is dened as follows:
Cinvestment(z) =
X
i
CMvar SVCiSSVCi
+X
j
CMvar TCSCjSTCSCj; (2)
where, SSVCi and STCSCj are complex powers of ith
SVC and jth TCSC, respectively, and CMvar SVCi and
CMvar TCSCj are the cost of one Mvar related to ith
SVC and jth TCSC, respectively, and are determined as [11],
CMvar T CSC= 1:5STCSC2 713STCSC+ 153750;
CMvar SVC= 0:3S2SVC 305SSVC+ 127380: (3)
It is noted that the comparison between power loss cost reduction and devices investment cost should be carried out in the same year of the allocation study. Therefore, after the calculation of power loss, according to the load curve of the mentioned year, other costs, such as necessary investment in new devices and benets from peak point power generation reduction on the basis of interest rate, the life time of new devices and power plants are combined in a single objective function. This is carried out using Kp and Ki factors with the
following denitions: Ki= (1 + B)
nfactsB
Kp= A (1 + B) nplantB
(1 + B)nplant 1: (4)
The next objective function is related to the security margin of the system. This objective function depends on the static voltage stability and investigates how the risk of voltage collapse is alleviated. Voltage collapse means a system is unable to provide the load demand and this situation is considered as a critical state. By knowing this critical state, the system can be secured against voltage collapse. The security rate of a system, according to the critical state, can be expressed as follows [12]: SM = P j2JL Slimit j P j2JL Sinitial j P j2JL Slimit
j : (5)
SM takes a value between zero and one for a system with normal operating conditions. A negative value of SM means the system cannot provide the initial load and the voltage will denitely collapse.
Since minimization is the aim of optimization rather than maximization, the objective function is rewritten as the following equation:
f2(x; u; z) = 1 SM =
P j2JL Sinitial j P j2JL Slimit
j : (6)
The minimization of this objective function causes an escape from voltage collapse. The objectives of loadability and SM enhancement are consistent and only the nominal power line constraint needs to be integrated into the optimization problem of SM.
The third objective function is regarding the voltage violation of the system. This voltage violation is dened for each bus as follows [13]:
V Di= vi v ideal
i dvi
vi ;
and: (x) =
(
0 if x < 0
x otherwise (7)
Therefore, the third objective function is: f3(x; u; z) =
X
i2JL
V Di=
X
i2JL
vi viideal dvi
vi :(8)
Minimization of this objective function forces the volt-age to remain in the specied range.
In the proposed multi-objective optimization, some constraints, such as compromising between the
active and reactive powers of load buses, permitted range of the active and reactive generating power of power plants, the allowed tap range of transform-ers, maximum power transmission of lines and the permitted range of FACTS devices changing, have been considered. In the following sub-section, the proposed strategy is presented to solve the multi-objective FACTS devices allocation problem with var-ious nonlinear constraints, which have already been dened.
Methodology
The proposed method tries to minimize all the ob-jectives, simultaneously. The goal of the problem is to nd an optimum conguration, , among feasible
congurations, , through installing new devices or only on the basis of current devices, in such a way that all objective force is optimum and the operational, load and control constraints are satised. The mathematical description can be written as:
min
u;z2ff1(x; u; z); f2(x; u; z); f3(x; u; z)g; (9)
where is the set of feasible solutions. The constraints of this nonlinear multi-objective optimization have been described previously.
TCSC AND SVC MODELS, AND
MODIFICATION OF VOLTAGE SECURITY EQUATIONS
There are two possible characteristics for TCSCs, capacitive and inductive, to increase or decrease the transmission line reactance. These devices can cause an increase in the transmission power capacity of the lines, static voltage security margin enhancement, voltage prole improvement and decreasing power loss (power division between parallel lines). SVCs have also capacitive and inductive characteristics and are predominantly utilized to improve and amend voltage under static and dynamic conditions, reduce reactive network power loss and enhance the static voltage security margin. In order to use TCSCs and SVCs in satisfying the mentioned allocation criteria, the injection power model and variable susceptance model shown, respectively, in Figures 1 and 2, have been considered. Figure 1 shows the lumped model of compensated linek, between buses t andf. The injected active and reactive powers to the mentioned buses are as follows [14]:
PTCSC
injf = G00ffVf2+ (G00ftcos ft+ Bft00 sin ft)VfVt;
Figure 1. Injection power model of a TCSC.
Figure 2. Variable susceptance of a SVC [15].
QTCSC
injf = B00ffVf2+ (G00ftsin ft Bft00 cos ft)VfVt;
(11) PTCSC
injt = G00ttVt2+ (G00tfcos tf + Btf00 sin tf)VfVt;
(12) QTCSC
injt = B00ttVt2+ (G00tfsin tf Btf00 cos tf)VfVt;
(13) where G00
ft and B00ftare dened as:
G00
ft= (R2+ XXc2R(2X + X)(R2+ (X + Xc) c)2);
B00
ft= Xc(R
2 X(X + X
c))
(R2+ X2)(R2+ (X + Xc)2): (14)
Also, Z = R + jX is transmission line impedance, Xc
is the magnitude of XTCSC and ft= f t= tf,
Y00
ff = Ytt00 = G00ff+ jBff00 = Yft00, Yft00 = Ytf00 = G00ft+
B00 ft.
According to Figure 2 [15], the drawn current by SVC can be expressed in the following equation:
ISVC= jBSVCVk: (15)
The reactive power drawn by SVC that is the same as
the injected power to bus k is written in the following equation:
QSVC= Qk= BSVCVk2: (16)
Also, in using [12], the following extra constraints are considered for determining the security margin, while t and f belong to JL,
gf = P0fVfpf + Pinjf
+
n
X
j=1
VfVjYfjcos (f j fj) = 0; (17)
gt= P0tVtpt+ Pinjt
+
n
X
j=1
VtVjYtjcos (t j tj) = 0; (18)
hf= Q0fVfqf + Qinjf
+
n
X
j=1
VfVjYfjsin (f j fj) = 0; (19)
ht= Q0tVtqt+ Qinjt
+Xn
j=1
VtVjYtjsin (t j tj) = 0; (20)
[t; f] 2 JL:
These constraints are related to the power balance in load buses in locations where injection power exists. P0Vp and Q0Vq represent the voltage dependency of
loads and p; q 2 f0; 1; 2g.
Note that the minimum and maximum con-straints of TCSC and SVC values should be imposed to determine the security margin and network loadability,
Xmin
TCSCiXTCSCiXTCSCimax ; i=1; ; nTCSC;
(21) Bmin
SVCj BSVCj BmaxSVCj; j = 1; ; nSVC: (22)
GENETIC ALGORITHM BASED FUZZY EVALUATION TECHNIQUE
Fuzzy Based Multi-Objective Formulation The fuzzy evaluation technique is a suitable tool for nding the best compromise in multi-objective opti-mization problems and can be used in both convex and non-convex problems [10]. To achieve trade-o amtrade-ong the three ctrade-ompeting trade-objectives described previously, under dierent operating conditions and
uncertainties, a fuzzy evaluation method has been applied to transform the multi-objective optimization into a single objective function (known as the fuzzy performance index). To obtain a single objective function, the objective functions, f1, f2 and f3, must
rstly be fuzzied. The membership functions for active power loss and FACTS investment cost, security margin, loadability improvement and load bus voltage violations have been displayed in Figure 3.
In Figure 3, uf1, uf2 and uf3 represent the
membership values of f1, f2 and f3. The overall fuzzy
performance index is dened as:
F = min(uf1; uf2; uf3): (23)
Optimization Approach
A global optimum solution, the best compromise between conicting constraints, can be obtained us-ing a fuzzy evaluation technique based on genetic algorithms. A Genetic Algorithm (GA) is a search technique based on a specic class of evolutionary algorithms. It is capable of solving various kinds of constrained/unconstrained optimization problems, in which the objective function is discontinuous, nondif-ferentiable, stochastic or highly nonlinear. Standard optimization algorithms, such as gradient based meth-ods, are not appropriate for such problems. GAs use operators inspired by evolutionary biology, such as mu-tation, natural selection and crossover (or recombina-tion). The concept of genetic algorithms is based on a simulation process, in which a population of individual solutions is generated and repeatedly modied in order to evolve the optimization problem toward a better
Figure 3. Fuzzy membership functions for f1, f2 and f3.
fini
i and fiobjrepresent unaccepted and desired levels for
each objective function, respectively.
solution. Applying selection, crossover and mutation operators to an initial randomly generated population produces a new generation to approach the optimal solution. Due to the probabilistic constitution of a new generation, a genetic algorithm, based on a random search process, is conducted by the tness function of chromosomes (a set of individuals). Therefore, the search space can be expanded to avoid being trapped in a local optimum.
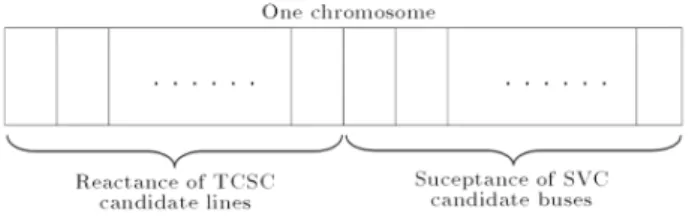
Here, a two-point crossover and roulette wheel selection [16] have been utilized to generate the next generation. Each chromosome has been formed from the reactance of TCSC candidate lines and the suscep-tance of SVC candidate buses, as shown in Figure 4. In order to prevent fast convergence of the population to a specic value and getting stuck in a local optimum, mu-tation rate Pmhas been used. If the random variable,
xi 2 [0; 1], is greater than Pm, the individual in the
chromosome remains unchanged, otherwise its value changes in such a way that the assigned individual posi-tion between its minimum and maximum is calculated using the dierence between maximum dened position and current position. The new calculated position determines the new value for the individual between its minimum and maximum. This procedure applies to each individual of all chromosomes.
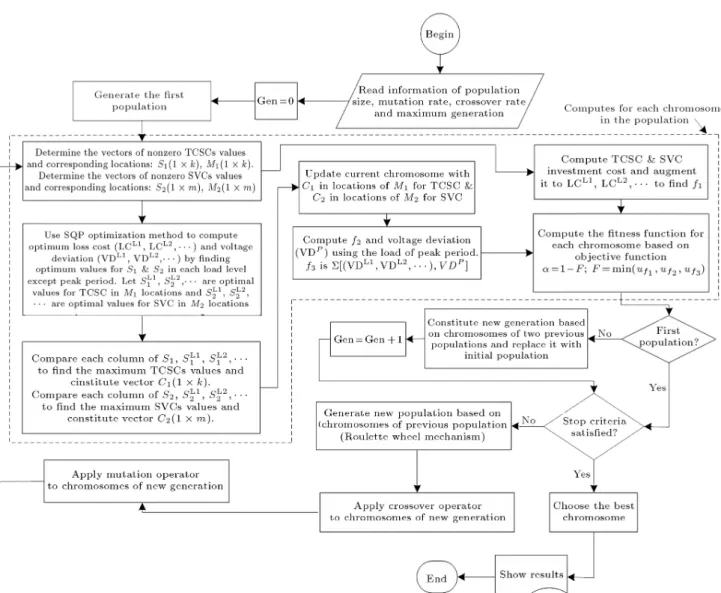
The genetic algorithm terminates when the maxi-mum number of generations are reached. If the quality of the best member of the population, according to the problem objectives, is not acceptable, the genetic algorithm will be restarted or a fresh search initiated. Figure 5 illustrates the optimization procedure, which is a combination of the described genetic algorithm and fuzzy evaluation approaches.
As is clear from Figure 5, after initialization and randomly generating the rst population, optimization proceeds to nd objective functions for each chromo-some in the population. At this stage, dierent load levels are taken into account to consider the estimated annual load prole. It can be helpful to nd accurate solutions when the optimization process runs on a practical network. To nd the investment costs of TCSC and SVC, their capacities have to be known, according to Equation 2. The capacity of TCSC and SVC in nonzero locations of the current chromosome determines, through a sequential quadratic program-ming approach [17], to have optimum loss and voltage
Figure 5. Combination of genetic algorithm and fuzzy evaluation method in the optimization process.
deviation at each load level. The maximum TCSC and SVC capacity of all load levels in each nonzero individual of the current chromosome, in addition to each level optimized cost of loss, determines the f1
objective function. With the updated TCSC and SVC values, security margin objective function f2 computes
just for peak load duration. Voltage deviation objective function f3 calculates through the sum of each load
level optimized voltage deviation and peak load voltage deviation. Computing all objectives, one can nd and optimize using fuzzy multi-objective technique as follows:
8 > < > :
min
= 1 F and F = min(uf1; uf2; uf3)
(24) subject to system constraints, which have been de-scribed previously.
Note that a similar multi-objective optimization, which is a combination of SQP and fuzzy evalua-tion methods, is needed as a sub-problem during the computation of optimum loss cost and voltage deviation of each chromosome. Although, SQP may get stuck into a local optimum, it is much faster than a genetic algorithm. Due to this benet, and the fact that the SQP method uses just in sub-problems, the accuracy of the optimization procedure is not mainly aected.
CASE STUDIES
In this section, the gained simulation results, for an IEEE 14-Bus test system with a week initial operating condition, by the proposed method, are presented and analyzed. In the next stage, this method is implemented to a practical system to allocate the FACTS devices satisfactorily.
Implementation on IEEE 14-Bus Test System The standard IEEE 14-Bus test system has been used to show the validation and eectiveness of the proposed hybrid method. Figure 6 shows the single line diagram of the test system. The information related to lines, transformers, generators, synchronous condensers, net-work peak load, initial compensators, and lines nominal powers of the test system, is available in the Appendix. Starting with a weak initial operating condition and an approach to satisfactory results, the condenser on Bus 3 has been omitted. The participation factors of generators are chosen according to their initial MW. In Equations 17-20, loads are assumed to be independent of bus voltages (pf = pt= qf = qt= 0) and increased
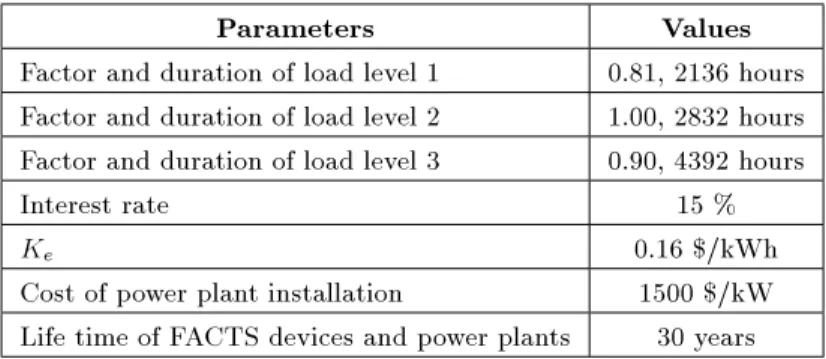
uniformly to determine the stability limit. Table 1 lists the necessary information for economic study. The estimated annual load prole has been determined in this table to nd the allocation results, accurately.
In this study, all branches (except transformers) have been nominated for TCSC installation, and all load buses have been considered for SVC installation. TCSC compensation degree constraints have been
as-Figure 6. Standard IEEE 14-Bus test system.
sumed to be 80% for TCSC in capacitive mode and 20% in inductive mode [6]. In addition, considering the voltage of 1 pu for all buses, the susceptance of SVC can be changed between 1 and -1 pu in a power base of 100 MVA. The voltage magnitude of the buses should vary in the band of 0.95 and 1.05 pu. Desired and unaccepted levels for objective functions f1, f2
and f3 have been initialized as fini= [1:1; 0:001; 0:05]
and fobj = [0:9; 0:24; 0:001]. The parameters of GA
i.e. number of generations, size of population and mutation rate, are set to 30, 30 and 0.2, respectively. It must be mentioned that the mutation rate is increased adaptively when the possibility of convergence into a local optimum is increased. In addition, two-point crossover (crossover fraction is 0.8) and roulette wheel selection [16] have been utilized to generate the next generation.
The results of optimal allocation of FACTS de-vices have been denoted in Table 2. The optimum solution includes type of FACTS devices, their size and their locations for dierent load levels. In Table 3, op-timum results, based on allocated devices at each load level, have been presented. These results conrm that a better system performance could be achieved at all load levels after installing the allocated devices. It can be seen that in Table 4, after optimum allocation and installation of FACTS devices, the cost of installation will be refunded from a reduction in the cost of the system performance (5.81% loss reduction and 0.81% power generating reduction in the load peak resulted in 1.46% additional saving). In addition, the loadability and voltage prole have been improved, compared to an initial weak condition. Figure 7 shows the tness function evaluation during the optimization procedure. Implementation on Fars Regional Electric Network
The Iran Power Grid consists of 33780 km of transmis-sion (400 and 230 KV) lines, which are geographically distributed through sixteen major Regional Electric Companies (RECs). The Fars Regional Electric Com-pany (FREC) is one of these companies with an
approx-Table 1. Information for economic study. Parameters Values Factor and duration of load level 1 0.81, 2136 hours Factor and duration of load level 2 1.00, 2832 hours Factor and duration of load level 3 0.90, 4392 hours Interest rate 15 %
Ke 0.16 $/kWh
Cost of power plant installation 1500 $/kW Life time of FACTS devices and power plants 30 years
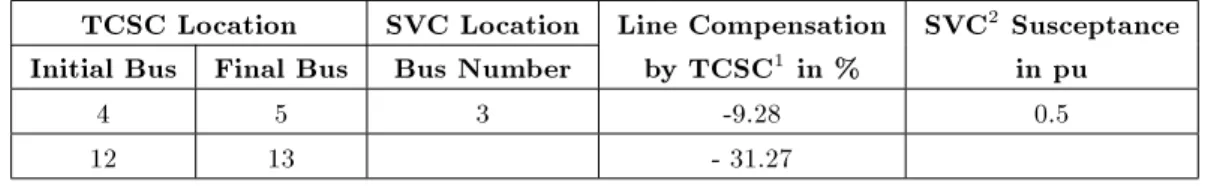
Table 2. The amount, type and location of FACTS devices in IEEE 14-Bus test system. TCSC Location SVC Location Line Compensation SVC2 Susceptance
Initial Bus Final Bus Bus Number by TCSC1 in % in pu
4 5 3 -9.28 0.5
12 13 - 31.27
1: TCSC: Negative means operation in capacitive mode. 2: SVC: Positive means operation in capacitive mode.
Table 3. Optimum results based on allocated devices at each load level (IEEE 14-Bus).
Before Allocation After Allocation Reduction in % Load Levels L1 L2 L3 L1 L2 L3 L1 L2 L3 Loss (LS
i) 0.1856 0.3294 0.2428 0.1846 0.2986 0.2306 0.538 9.350 5.024
Generated Power (P
Gi) 2.9931 3.7954 3.3622 2.9921 3.7646 3.3500 0.033 0.812 0.363
Voltage Deviation 0.0000 0.1957 0.0035 0.0000 0.0000 0.0025 - 100.0 28.57 Cost Based on LS
i & PGi 74.720 98.460 93.870 74.580 97.580 93.660 0.187 0.894 0.224
*: Base power: 100 MVA **: Base cost: 1 M$
Table 4. The results before and after installation of FACTS devices in IEEE 14-Bus test system. Before
Allocation
Objective Values
After Allocation
Reduction in % Loss 0.7578 - 0.7138 5.81
Peak Point
Power Generation 3.7954 - 3.7646 0.81
Cost 1 0.900 0.9854 1.46
1-SM 0.9322 0.760 0.9223 1.06 VDi 0.1992 0.001 0.0025 98.7
0.9962 - 0.6790 31.8
*: Base power: 100 MVA **: Base cost: 121.88 M$
Figure 7. Fitness function evaluation during GA optimization in IEEE 14-Bus test system.
imated peak power demand of 2800 MW, recorded in the summer of 2007. FREC possesses 890 and 2618 km of transmission lines of 400 and 230 KV, respectively. The transmission network of FREC has been used to illustrate the performance and eectiveness of the proposed hybrid method. The information of lines, transformers, generators, network forecasted annual load prole and initial compensators in the summer of 2010 are available in [18]. There are 52 buses of 230 and 400 KV, 75 transmission lines, 9 generators and 7 transformers, based on an existing and accepted plan to supply customers in a target year. Seven tie lines connect FREC to its neighbours. The impact of neighbour networks is considered in this study for more accurate analysis. Therefore, the nearest power plants and all overhead lines which transmit the power to tie lines have been involved in this study. According to these eects, 14 buses, 22 transmission lines, 9
Table 5. The amount, type and location of TCSC and SVC in FREC network.
SVC Location TCSC Location Line Compensation SVC2 Susceptance
Bus Name Initial Bus Final Bus by TCSC1 in % in pu
DANESHGAH230 LAR230 JAHROM1 230 - 62.71 0.01562 DARAB230 SHIRAZ230 GHAEMIYE230 19.68 0.5048
LAR230 0.8437
MARVDASHT230 0.4453
SHIRAZ2 230 1.0000
1: TCSC: Negative means capacitive and positive means inductive. 2: SVC: Negative means inductive and positive means capacitive.
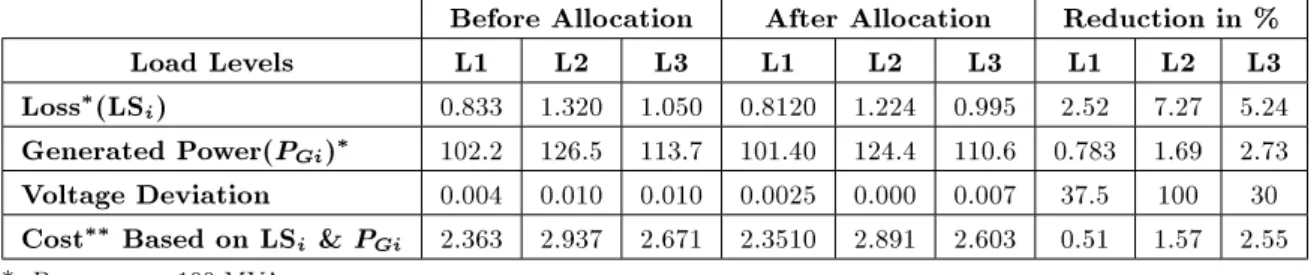
Table 6. Optimum results based on allocated devices at each load level (FREC network). Before Allocation After Allocation Reduction in % Load Levels L1 L2 L3 L1 L2 L3 L1 L2 L3 Loss(LS
i) 0.833 1.320 1.050 0.8120 1.224 0.995 2.52 7.27 5.24
Generated Power(PGi) 102.2 126.5 113.7 101.40 124.4 110.6 0.783 1.69 2.73
Voltage Deviation 0.004 0.010 0.010 0.0025 0.000 0.007 37.5 100 30 Cost Based on LS
i& PGi 2.363 2.937 2.671 2.3510 2.891 2.603 0.51 1.57 2.55
*: Base power: 100 MVA, **: Base cost: 1000 M$
Table 7. Optimum multi-objective results for FREC network. Before
Allocation
Objective Values
After Allocation
Reduction in % Loss 3.203 - 3.0310 5.37
Generation at peak 126.5 - 124.36 1.69
Total Cost (f
1) 1.000 0.900 0.9978 0.22
1-SM (f2) 0.902 0.760 0.8740 3.10
VDi(f3) 0.024 0.001 0.0095 60.42
0.496 - 0.4890 1.43
*: Base power: 100 MVA, **: Base cost: 3038.5 M$
generators and one transformer of neighbouring RECs have been added to the FREC network. Similar to the previous case study, Table 1 lists the necessary information for economic study. In this table, the forecasted load curve, which is modelled by three load levels and their durations, have been considered, in order to calculate power loss and voltage violation in the year of study for the allocation problem. The lines nominal powers of the FREC network are based on their types, which are Martin, Squab, Curlew, Canary, Cardinal and Drake. In this investigation, all lines and all load buses in the FREC network have, respec-tively, been nominated for TCSC and SVC installation. TCSC reactance constraints have been considered in such a way that it compensates 70% reactance of the line where TCSC is located in a capacitive mode and
20% in an inductive mode [6,11]. Also, by considering the 1 pu voltage of the bus where SVC is located, the susceptance can be changed between 1 and -1 pu in the power base of 100 MVA. Desired and unaccepted levels for objective functions f1, f2 and f3, GA parameters
(except number of generations, which is set to 100), participation factors of generators, voltage dependency of loads and their increasing strategy, and the voltage magnitude variation limits, are the same as in the previous case. Allocation results have been listed in Tables 5, 6 and 7.
Based on allocated devices in Table 5, the min-imum loss and voltage deviation of each load level have been presented in Table 6. In this table, gen-erated power and cost, which are related to minimum loss and voltage deviation, have also been presented.
Comparing data before and after allocation shows that optimum allocation caused loss reduction, generated power reduction, voltage prole enhancement and cost reduction for all load levels.
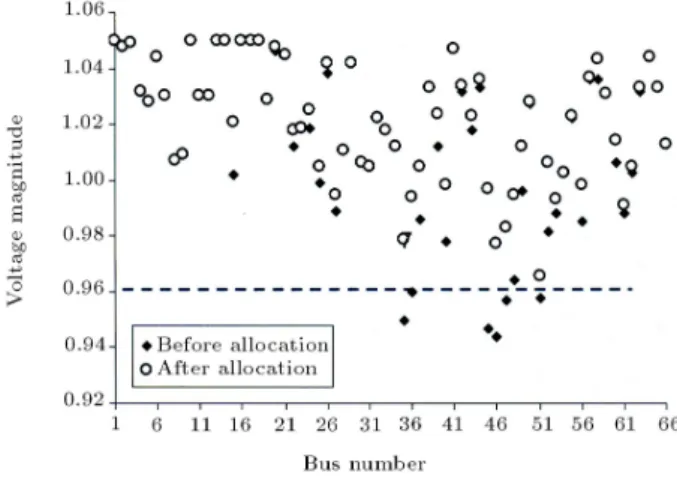
From Table 7, it is clear that, after the optimum allocation and installation of FACTS devices, the total cost of installation will be refunded from reducing the cost of the system performance (5.37% loss reduction and 1.69% peak power reduction) and, in addition to this, 0.22% savings (about 6684700 $) will be achieved. It can be seen from Table 7 that the security margin and voltage prole have simultaneously been improved with the cost reduction of the FREC network. Figure 8 shows the tness function evaluation during the opti-mization procedure described in Figure 5. The voltage prole has been enhanced during the peak period after using FACTS devices, as shown in Figure 9. The security margin and loadability improvement, due to 3.1% reduction in f2, implies that the FREC network
becomes more robust against voltage collapse after the installation of FACTS devices. The six most severe single line outages have been shown in Figure 10. It is obvious that, after each outage, SM is greater
Figure 8. Fitness function evaluation during GA optimization in FREC network.
Figure 9. Voltage magnitude of FREC buses in peak load.
than initial values, without the installation of FACTS devices.
Although, genetic algorithms are considered as time consuming methods, due to the o-line charac-teristic of planning problems, this deciency has no negative eect on the optimization procedure. Finding the optimum solution to simultaneously reduce all the objectives in a FACTS devices allocation problem is really vital for the prospective system and, therefore, it is worth spending more time on such an important decision. A comparative study between the proposed method and previous studies in [2,3,5,6] reveals that, in order to carry out a comprehensive study of FACTS de-vices allocation, it is feasible to satisfy all the objectives simultaneously. On the other hand, using unlimited FACTS devices to reach the maximum loadability of a network [6] cannot be practical and it is possible to use a limited number of devices, according to economic considerations.
CONCLUSION
In this paper, a novel approach has been proposed to determine the optimum amounts and locations of TCSCs and SVCs, based on a multi-objective function. In this method, the allocation problem has been in-vestigated according to practical considerations. One of these considerations is using an estimated annual load curve, which causes the allocation to become more accurate. Also, in contrast to some previous research, the cost objective function has been considered, besides other objectives, to reach a precise and practical solution. In addition, a fuzzy evaluation method has been utilized to nd the best compromise between conicting objectives, even if the problem is non-convex. According to the obtained results on the FREC network, the combination of genetic algorithm and fuzzy evaluation methods cause allocation objectives, such as power loss reduction, investment cost
reduc-Figure 10. The six most severe single line outages and their related security margin with and without FACTS.
tion, security margin improvement, network loadability enhancement and voltage violation alleviation, to be satised. It is also concluded that all the invested budget of FACTS devices is refunded, plus 0.22% savings are made. Also, the cost reduction of peak point power generation in this study implies that power plant expansion, providing the demand load, can be postponed.
NOMENCLATURE
A power plant installation cost in $/kW B refundable investment rate in percent BSVCj susceptance of jth SVC in pu
CMvar SVCi cost of one Mvar related to ith SVC in
$/Mvar
CMvar TCSCj cost of one Mvar related to jth TCSC
in $/Mvar
dvi maximum voltage violation tolerance
percent
f1; f2; f3 problem objective functions
fini
i ; fiobj unaccepted and desired level for each
objective function
F fuzzy performance index
JL a set contains all load buses
Ke active power cost in $/kWh
nfacts; nplant life times of FACTS devices and power
plants, respectively in year
Plossi(x; u; z) active power loss of ith load level from
system annual load curve in kW Ppeak(x; u; z) peak point power generation in year of
study in kW PTCSC
injf ; QTCSCinjf injected active and reactive power at
bus f in pu PTCSC
injt ; QTCSCinjt injected active and reactive power at
bus t in pu
P0; Q0 prescribed real and reactive loads at
rated (normal) voltage in pu
pf; qf; pt; qt constants that reect the load-voltage
characteristics at buses f and t Pm mutation rate 2 [0; 1]
Sinitial
j ; Sjlimit demands related to load bus j at initial
and limit (critical) states MVA SSVCi complex power of ith SVC in MVA
STCSCj complex power of jth TCSC in MVA
uf1; uf2; uf3 membership values of f1, f2and f3
u control variables vector
vi voltage of bus i in pu
videal
i ideal voltage of bus i in pu
x state variables vector
xi random variable 2 [0; 1]
Xc magnitude of XT CSC in pu
XTCSCi reactance of ith TCSC in pu
z vector containing amount and type of
FACTS devices
positive scalar variable
set of feasible solutions
REFERENCES
1. Sharma, N.K. et al. \A novel placement strategy for FACTS controllers", IEEE Trans. Power Del., 18(3), pp. 982-987 (2003).
2. Yorino, N. et al. \A new formulation for FACTS allocation for security enhancement against voltage collapse", IEEE Trans. PWRS, 18(1), pp. 3-10 (2003). 3. Chang, C.S. and Huang, J.S. \Optimal multi-objective SVC planning for voltage stability enhancement", IEE Proc.-Gener. Transm. Distrib., 145(2), pp. 203-209 (1998).
4. Song, S.H. et al. \Installation and operation of FACTS devices for enhancing steady-state security", J. of Elect. Power Syst. Res., 70(1), pp. 7-15 (2004). 5. Lu, Y. and Abur, A. \Static security enhancement
via optimal utilization of thyristor controlled series capacitors", IEEE Trans. PWRS, 17(2), pp. 324-329 (2002).
6. Gerbex, S. et al. \Optimal location of multi-type FACTS devices in a power system by means of genetic algorithms", IEEE Trans. PWRS, 16(3), pp. 537-544 (2001).
7. Jurado, F. and Rodriguez, J.A. \Optimal location of SVC based on systems loadability and contingency analysis", in Proc. 7th IEEE Int. Conf. on Emerg. Tech. and Fact. Auto. (1999).
8. Singh, S.N. and David, A.K. \Congestion management by optimizing FACTS device location", in Proc. IEEE Int. Conf. on Elect. Util. Dereg., Restruct and Power Tech.(DRPT) (2000).
9. Ongsakul, W. and Bhasaputra, P. \Optimal power ow with FACTS devices by hybrid TS/SA approach", Int. J. Elec. Power Energy. Syst., 24(10), pp. 851-857 (2002).
10. Huang, Y.-C. \Enhanced genetic algorithm-based fuzzy multi-objective approach to distribution network reconguration", IEE Proc.-Gener. Transm. Distrib., 149(5), pp. 615-620 (2002).
11. Cai, L.J. et al. \Optimal choice and allocation of FACTS devices in deregulated electricity market using genetic algorithms", IEEE-PES: Power Syst. Conf. and Exp. (2004).
12. Obadina, O.O. and Berg, G.J. \Determination of volt-age stability limit in multi-machine power systems", IEEE Trans. PWRS, 3(4), pp. 1545-1554 (1988).
13. Chen, Y.L. and Liu, C.C. \Multi-objective VAR plan-ning using the goal-attainment method", IEE Proc.-Gener. Transm. Distrib., 141(3), pp. 227-232 (1994). 14. Narayana, P.P. and Abdel Moamen, M.A. \Power ow
control and solutions with multiple and multi-type FACTS devices", J. of Elec. Power Syst. Res., 74(3), pp. 341-351 (2005).
15. Ambriz-Perez, H. et al. \Advanced SVC model for newton-raphson load ow and newton optimal power ow studies", IEEE Trans. PWRS, 15(1), pp. 129-136 (2000).
16. Goldberg, D.E., Genetic Algorithms in Search, Opti-mization and Machine Learning, Addison-Wesley, USA (1989).
17. Gill, P.E. et al., Practical Optimization, Academic Press (1981).
18. Akbari, A. et al. \Comprehensive studies of FREC transmission and sub-transmission network in years 2010-2013", Iranian Power Syst. Res. (IPSERC), Tehran, Iran, Tech. Rep. TR-01 (483041-2468) (2005). 19. Freris, L.L. and Sasson, A.M. \Investigation of the load ow problem", IEE Proc., 115(10), pp. 1459-1469 (1968).
APPENDIX
Initial operating conditions and the branches data of the IEEE 14-Bus test system have been presented in Tables A1 to A3, based on the data mentioned in [19,12]. In addition, the assumption for lines nominal power ratings has been added into the branches data in Table A1.
Table A1. Branches data of 14-Bus network. Initial
Bus
Final
Bus R (pu) X (pu) B (pu)
Nominal Power (MW)
TAP Position 1 2* 0.01938 0.05917 0.0528 300 0 1 5 0.05403 0.22304 0.0492 150 0 2 3 0.04699 0.19797 0.0438 150 0 2 4 0.05811 0.17632 0.034 150 0 2 5 0.05695 0.17388 0.0346 150 0 3 4 0.06701 0.17103 0.0128 150 0 4 5 0.01335 0.04211 0 150 0
4 7 0 0.20912 0 60 0.978
4 9 0 0.55618 0 36 0.969
5 6 0 0.25202 0 80 0.932
6 11 0.09498 0.1989 0 60 0 6 12 0.12291 0.25581 0 45 0 6 13 0.06615 0.13027 0 45 0
7 8 0 0.17615 0 45 0
7 9 0 0.11001 0 60 0
9 10 0.03181 0.0845 0 45 0 9 14 0.12711 0.27038 0 45 0 10 11 0.08205 0.19207 0 45 0 12 13 0.22092 0.19988 0 45 0 13 14 0.17093 0.34802 0 45 0
*In the case of Branch 1-2, the presented data are for the combination of the two parallel lines.
Table A2. Regulated bus data.
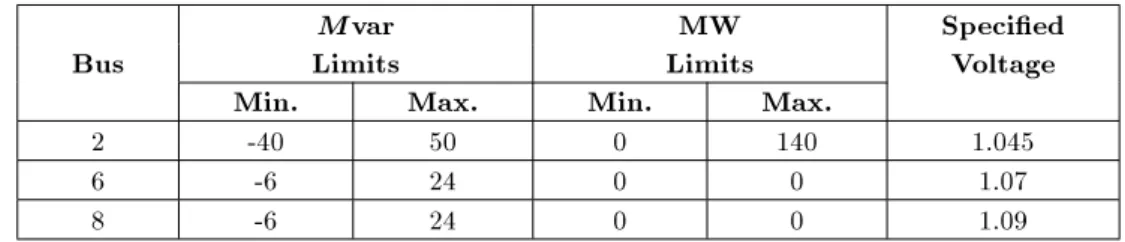
Mvar MW Specied
Bus Limits Limits Voltage Min. Max. Min. Max.
2 -40 50 0 140 1.045
6 -6 24 0 0 1.07
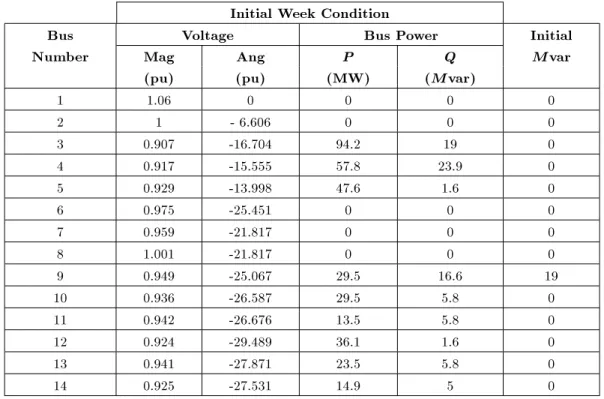
Table A3. Estimation of initial operating conditions of 14-Bus network. Initial Week Condition
Bus Voltage Bus Power Initial
Number Mag Ang P Q Mvar
(pu) (pu) (MW) (Mvar)
1 1.06 0 0 0 0
2 1 - 6.606 0 0 0
3 0.907 -16.704 94.2 19 0 4 0.917 -15.555 57.8 23.9 0 5 0.929 -13.998 47.6 1.6 0
6 0.975 -25.451 0 0 0
7 0.959 -21.817 0 0 0
8 1.001 -21.817 0 0 0
9 0.949 -25.067 29.5 16.6 19 10 0.936 -26.587 29.5 5.8 0 11 0.942 -26.676 13.5 5.8 0 12 0.924 -29.489 36.1 1.6 0 13 0.941 -27.871 23.5 5.8 0 14 0.925 -27.531 14.9 5 0
![Figure 2. Variable susceptance of a SVC [15].](https://thumb-us.123doks.com/thumbv2/123dok_us/8399586.2231721/4.892.482.829.305.715/figure-variable-susceptance-of-a-svc.webp)