ENTERPRISE NETWORKS
by David Whyte
A thesis submitted to
the Faculty of Graduate Studies and Research in partial fulfillment of
the requirements for the degree of DOCTOR OF PHILOSOPHY
School of Computer Science at
CARLETON UNIVERSITY
Ottawa, Ontario September, 2008
c
List of Tables v
List of Figures vii
Abstract ix
Acknowledgements xi
Chapter 1 Introduction 1
1.1 Motivation . . . 1
1.2 Network-based Intrusion Detection Schemes . . . 3
1.3 Contributions . . . 5
1.4 Overview of Chapters . . . 10
Chapter 2 Background 12 2.1 Passive and Active Network Discovery Techniques . . . 13
2.2 Network Scanning Strategies . . . 16
2.2.1 Wide-range Reconnaissance . . . 16
2.2.2 Target-specific Reconnaissance . . . 18
2.2.3 Worm Propagation Methods . . . 19
Chapter 3 Related Work 23 3.1 External Network Scanning Detection Strategies – TRW . . . 23
3.2 External Network Scanning Detection Strategies – Other . . . 38
3.3 Internal Network Scanning Detection Strategies . . . 42
3.4 Summary . . . 45
Chapter 4 Exposure Maps: Approach and Evaluation Methodology 47 4.1 Exposure Maps: Approach . . . 47
4.1.1 Use of Exposure Maps for Scanning Detection . . . 52
4.1.3 Exposure Profiles: Host Discovery and Asset Classification . . 56
4.1.4 Determining the Success of Network Service Enumeration as a Result of Scanning Campaigns . . . 58
4.1.5 Bro Implementation . . . 64
4.2 Evaluation: Datasets and Methodology . . . 68
Chapter 5 Exposure Maps: Evaluation and Discussion 73 5.1 Evaluation of Exposure Maps . . . 73
5.1.1 Results: Scanning Detection – Comparison With Threshold Random Walk (TRW) . . . 80
5.1.2 Results: Advanced Scanning Detection . . . 97
5.1.3 Results: Active Response . . . 100
5.1.4 Results: Exposure Profiles . . . 103
5.1.5 Results: Reconnaissance Activity Assessment (RAA) . . . 104
5.2 Scalability and Stability of Exposure Maps . . . 106
5.3 Further Discussion and Limitations . . . 110
5.4 Summary . . . 116
Chapter 6 Internal Network Scanning Detection Strategy 1: DNS-based 117 6.1 DNS-based Scanning Detection: Approach . . . 117
6.1.1 High-Level System Design . . . 118
6.2 Prototype Evaluation . . . 124
6.2.1 Data Set for Prototype Evaluation . . . 124
6.2.2 CCSL Network Monitoring Analysis . . . 126
6.2.3 IDN Monitoring Analysis . . . 127
6.2.4 Discussion of False Positives and Negatives . . . 127
6.3 Detection Circumvention and Current Limitations . . . 133
6.3.1 Detection Circumvention . . . 133
6.3.2 Current Detection Limitations . . . 135
6.5 Summary . . . 138
Chapter 7 Internal Network Scanning Detection Strategy 2: ARP-based 140 7.1 ARP-based Scanning Detection: Approach . . . 140
7.1.1 High-Level System Design . . . 146
7.2 Prototype Evaluation . . . 150
7.2.1 Data Set for Prototype Evaluation . . . 151
7.2.2 Simulating Scanning Worm Activity . . . 154
7.2.3 Discussion of False Positives and Negatives . . . 156
7.3 Limitations . . . 159
7.4 Suppression and Containment Extensions . . . 161
7.5 Summary . . . 163
Chapter 8 Summary and Future Directions 164 8.1 Summary of Research Contributions . . . 164
8.2 Future Work . . . 168
Bibliography 170 Appendix A Supplementary Material 177 A.1 Acronym List . . . 177
A.2 IANA Port Assignment List . . . 178
Table 3.1 Bro Connection States (adapted from [10]). . . 29
Table 4.1 Details about the Network Datasets. . . 71
Table 4.2 Exposure Maps Capability Evaluation. . . 71
Table 5.1 Parameters Used for Comparing TRW to the Exposure Maps DCA Heuristic (CCSL Dataset). . . 76
Table 5.2 Affect of Hits and Misses on TRW Hypotheses Selection. (θ0 =.80, θ1 =.20, α=.01, β =.99). . . 76
Table 5.3 Expected Number of Connection Events (E[N|H1]) to Confirm a Remote Host is a Scanner With α = .01 and β = .99 Kept Constant. . . 77
Table 5.4 NEM Details for CCSL Network. . . 81
Table 5.5 Scanning Detection Results for CCSL Dataset with the Exposure Maps DCA Heuristic. . . 82
Table 5.6 Scanning Detection Results for CCSL Dataset with the TRW and Modified TRW Techniques. . . 82
Table 5.7 Additional Exposure Maps Results for the CCSL Dataset. . . . 86
Table 5.8 Scanning Detection Comparison LBNL/ICSI 2004-12-15 Dataset. 91 Table 5.9 Additional Exposure Maps Results for the LBNL/ICSI 2004-12-15 Dataset. . . 91
Table 5.10 Scanning Detection Comparison LBNL/ICSI 2004-12-16 Dataset. 94 Table 5.11 Additional Exposure Maps Results for the LBNL/ICSI 2004-12-16 Dataset. . . 94
Table 5.12 Three Detected Distributed Scans. . . 98
Table 5.13 Scan/Attack Activity. . . 98
Table 5.14 Distributed Scan Characteristics. . . 99
Table 5.15 Exposure Profiles Port Assignments. . . 104
Table 5.16 Exposure Profiles. . . 104
Table 5.18 RAA for CCSL Dataset. . . 105
Table 6.1 Network Data Set. . . 125
Table 6.2 DNS Datagrams. . . 126
Table 6.3 IDN Worm Activity. . . 128
Table 6.4 Additional IDN Alerts. . . 128
Table 6.5 CCSL Network Alerts. . . 129
Table 6.6 False Positive Results Analysis. . . 130
Table 6.7 Probability of False Negatives due to Remote DNS Monitoring. 133 Table 6.8 CCSL Network Whitelist. . . 134
Table 6.9 IDN Whitelist. . . 135
Table 7.1 ARP Statistics for Prototype System on CCSL Network. . . 150
Table 7.2 Alarm Threshold Analysis . . . 154
Table 7.3 Network ARP Statistics . . . 155
Table 7.4 Anomaly Factor Triggering Probabilities in Testbed . . . 159
Table A.1 Acronyms. . . 177
Table A.2 IANA Assigned Port Numbers to Specific Network Services. . . 178
Figure 2.1 Network Scanning Activity. . . 17
Figure 3.1 Using Likelihood Ratio to Classify Remote Hosts. . . 25
Figure 3.2 trw-impl.bro Policy Interaction. . . 28
Figure 3.3 Rejected TCP Connection. . . 30
Figure 3.4 Normal TCP Connection. . . 30
Figure 3.5 Host Classification Possibilities for the trw-impl.bro Policy Script. 32 Figure 3.6 trw-impl.bro Pseudo Code - Inputs and Parameters. . . 33
Figure 3.7 trw-impl.bro Pseudo Code - Main Body of Function. . . 34
Figure 4.1 Example NEM. . . 50
Figure 4.2 Scanning Potentials versus Network Exposures. . . 54
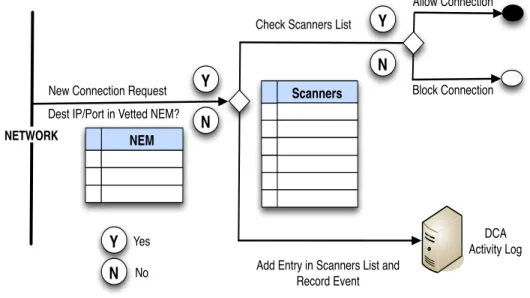
Figure 4.3 Exposure Maps Automated Response Logic. . . 55
Figure 4.4 Exposure Profiles. . . 57
Figure 4.5 Enhanced NEM - RAA Logic. . . 59
Figure 4.6 Basic and Enhanced NEM. . . 60
Figure 4.7 Example of an RAA. . . 61
Figure 4.8 Bro Architecture Implementing Exposure Maps Policies. . . . 65
Figure 5.1 Expected Number of Connection Events to Confirm a Remote Host is a Scanner With α=.01 and β =.99 Kept Constant. . 78
Figure 5.2 DCA Activity for CCSL Dataset (Using Exposure Maps Tech-nique). . . 83
Figure 5.3 Number of Unique Remote Hosts Generating DCAs in the CCSL Dataset (Using Exposure Maps Technique) per Geo-located Country of Origin. . . 84 Figure 5.4 Fraction of Remote Hosts Generating DCAs Against at Mostx
Local Hosts. CCSL Dataset, Using Exposure Maps Technique. 85
sure Maps Technique) – Number of DCAs. . . 86
Figure 5.6 DCA Activity for LBNL/ICSI 12-15 Dataset (Using Exposure Maps Technique). . . 88
Figure 5.7 Fraction of Remote Hosts Generating DCAs Against at Most x Local Hosts. LBNL 12-15 Dataset, Using Exposure Maps Technique. . . 89
Figure 5.8 CDF of DCA Activity for LBNL/ICSI 12-15 Dataset (Using Exposure Maps Technique) – Number of DCAs. . . 90
Figure 5.9 DCA Activity for LBNL/ICSI 12-16 Dataset (Using Exposure Maps Technique). . . 92
Figure 5.10 Fraction of Remote Hosts Generating DCAs Against at Most x Local Hosts. LBNL 12-16 Dataset, Using Exposure Maps Technique. . . 93
Figure 5.11 CDF of DCA Activity for LBNL/ICSI 12-16 Dataset (Using Exposure Maps Technique) – Number of DCAs. . . 95
Figure 5.12 Distributed Scan of the SSH Service on CCSL Network IP Ad-dresses. . . 101
Figure 5.13 Distributed Scan of the SSH Service on Port 22/TCP of CCSL Network IP Addresses. . . 102
Figure 6.1 High-level System Design. . . 119
Figure 6.2 DNS-based Detection Logic. . . 120
Figure 6.3 IDN Worm Activity. . . 129
Figure 7.1 Peer List For a Small Network With Four Active Devices. . . . 143
Figure 7.2 High Level Design of Prototype Implementation . . . 147
Figure 7.3 ARP-based Detection Logic. . . 149
The Internet is saturated with nonproductive network traffic that includes a variety of reconnaissance activities to identify vulnerable systems. Individual systems exhibit anomalous behavior in their interactions with physical and logical interconnections that define the enterprise network when they are scanning or are the target of a scan. We take advantage of this observation through the development of a suite of network scanning detection techniques to detect internal (intra-enterprise) scanning using the address resolution protocols (i.e. Domain Name System (DNS), Address Resolution Protocol (ARP)), and external (inter-enterprise) scanning usingdarkports
– the unused ports on active systems, which we identify during the construction of
exposure maps.
Specifically, to detect intra-enterprise network scanning activity, we note that scanning systems exhibit anomalous behavior when using the address resolution pro-tocols. These techniques offer the possibility to identify local scanning systems within an enterprise network after the observation of only a few scanning attempts with a low false positive and negative rate. To detect external scanning activity directed at a network we make use of the concept of exposure maps that are identified by passively characterizing the connectivity behavior of internal hosts in a network as they re-spond to both legitimate connection attempts and scanning attempts. The exposure maps technique enables: (1) active response options to be safely focused exclusively on those systems that directly threaten the network, (2) the ability to rapidly char-acterize and group hosts in a network into different exposure profiles based on the services they offer, and (3) the ability to perform a Reconnaissance Activity Assess-ment (RAA) that determines what specific information was returned to an adversary as a result of a directed scanning campaign.
In a direct side-by-side comparison with the Threshold Random Walk (TRW) scanning detection technique of Jung (2006, MIT Ph.D., thesis) exposure maps of-fered an equivalent scanning detection capability while arguably being lightweight,
mentation and evaluation of fully functional prototypes to detect internal and external scanning activity at an enterprise network.
I would like to express my sincere gratitude to my advisor Professor Evangelos Kranakis. Your expert knowledge, unfailing encouragement and personal guidance has been a source of inspiration to me for a number of years. You gave me the confidence to pursue this degree and allowed me to follow and realize my dreams.
I am deeply grateful to my advisor Professor Paul C. van Oorschot for the detailed, insightful, and constructive comments he provided not only for this thesis but for all my research and publications. I cannot overstate how important your unfailing support, personal guidance, and excellent advice has benefited me. I especially thank you for the many hours and late nights you spent helping me improve this thesis. You have had a remarkable influence on my academic research.
I would also like to take this opportunity to thank the members of my thesis committee that consisted of Professor Tet Yeap, Professor Anil Somayaji, Professor Ashraf Matrawy and Professor John McHugh. A special mention is warranted for both Professor Somayaji and Professor McHugh whose helpful comments and keen observations have certainly improved the quality of this work.
I extend a special thanks to all the members of the Digital Security Group at the Carleton Computer Security Lab. The lab has proved not only to be a great facility to conduct research but also a wonderful environment where top notch security researchers can both challenge and inspire one another. Thanks to Glenn Wurster and Mohammad Mannan for your continual support and encouragement over the last few years.
I am indebted to my many professional colleagues for whom I have great regard. To all of my colleagues, I appreciate your advice, comments, and support. I extend a special thanks to Griffith Ince, Carl Reid and Deborah Abbott who made it possible for me to devote full-time study at critical points in my research. I would not have been able to complete this degree without these times of focused research. For that, I offer you all my heartfelt thanks and a debt of gratitude. To Donald MacLeod and Joe MacGillivray, your expert technical advice both professionally and academically
Lastly, and most importantly, I wish to dedicate this thesis to my family. To my parents, Donald and Sharon, thank you for instilling in me the importance of education and for always believing in my abilities. To my wife Michelle, this would not have been possible without your love, support, and encouragement. As I completed this work, you spent many nights and weekends alone taking care of our children. In this, as in all things, you enable me to realize my potential. To my children Carter and Kylie, let this serve as proof that if you work hard you too can realize your dreams. Always remember, I will be there to help you along the way.
Introduction
To safeguard an enterprise network, it is desirable that all forms of external and in-ternal scanning activity be detected to identify information leakage to an adversary in an attempt to prevent follow-on attacks. To accomplish this goal, this dissertation presents network scanning detection strategies that: (1) are sufficiently accurate and efficient to support automated countermeasures (e.g. containment by ingress/egress blocking, connection throttling), (2) can detect both new (i.e. zero-day) and sophis-ticated forms of scanning activity, (3) provide a mechanism to determine what type of information about the network has been obtained by an adversary as a result of network scanning, and (4) are suitable to detect inter and intra-enterprise network scanning activity. The remainder of this chapter contains sections on the motiva-tions for this work, an attempt to broadly classify our network detection strategies based on their underlying detection principles, a summary of the contributions of this dissertation, and finally an outline for subsequent chapters.
1.1 Motivation
Networks are under constant bombardment from a variety of unproductive network activity that includes probes from compromised systems (e.g. worms, auto-rooters [66]), misconfigured systems, Internet cartographers, and backscatter traffic [40]. Yegneswaren et al. [79] estimated that there were, already in the 2002 timeframe, 25 billion global intrusion attempts per day and this activity continues to increase. Panjwani et al. [44] estimated in a 2005 paper that 50% of attacks against systems are preceded by some form of network scanning activity. Network reconnaissance or scanning is the first stage of an intrusion attempt that enables an adversary to remotely locate, target, and exploit vulnerable systems. Network scanning activity directed at an enterprise network can occur from systems within (i.e. a host inside
the administrative domain of the network scanning local subnets) or external to the network.
Automated tools (e.g. auto-rooters) methodically probe large blocks of Internet address space seeking vulnerable systems for recruitment into botnets [20, 51, 15, 47, 5]. Large numbers of worm-infected systems randomly scan the Internet searching for susceptible systems to exploit. Over the past few years, and perhaps best character-ized by the the period 2001 – 2003 (with Code Red, Nimda, Slammer, and Blaster), worm outbreaks of very large size and severity have rapidly spread across vulnerable systems destabilizing the Internet. In fact, there have been worm outbreaks that have been able to scan and infect 90% of all the vulnerable host on the Internet in less than 10 minutes [39].
Perhaps most worrisome for a network operator is when a determined adversary di-rects specific scanning activity solely against their network searching for weaknesses that provide an entry vector. This type of reconnaissance is typically precise, de-liberate, and focused. In contrast to the indiscriminate scanning activity typically associated with autorooter and worm propagation activities, skilled adversaries will go to considerable lengths to mask their activities.
Almost all current scanning detection algorithms correlate scanning activity based on the perceived last-hop origin of the scans; we call theseattribution-based detection schemes. However, there are situations (i.e. in cases of remote scanning of an en-terprise network) where determining true attribution (e.g. the actual scan controller, where this differs) is not possible. Furthermore, in some cases the use of attribution-based detection schemes is entirely ineffective as the scans may either be so slow or so broadly distributed that they exhaust the finite computational state of scanning de-tection systems or fail to exceed some predefined alert threshold. Although a network operator may be interested in knowing what type and amount of scanning activity is occurring, this is largely irrelevant if the proper security countermeasures are in place and relevant software patches are available and up-to-date. However, the situation is different if any of the scans are a more likely precursor to a successful attack. Current scanning detection techniques do not take advantage of this observation. Our view is that against a growing array of scanning strategies from remote hosts, attribution
is becoming a quixotic approach to scan detection that overlooks an often critically important question that we suggest should be a much higher focus of scanning detec-tion, namely, “What is the adversary looking for and, are we vulnerable with respect to that resource?”
Our thesis is that network scanning detection techniques can both leverage and benefit from local knowledge obtained from considering an enterprise network’s topol-ogy and the perceived origin (i.e. internal or external to the network) of the scanning activity. Specifically, systems exhibit anomalous behavior in their interactions with physical and logical interconnections that define the enterprise network when they are scanning or are the target of a scan that can provide indications of scanning activity. The research presented in this thesis pursues the following 3 hypotheses.
Hypothesis 1: to better defend the enterprise network, it is possible to design and deploy a suite of practical scanning detection techniques, that improve upon existing approaches, with acceptably low false postive/negative rates, and that are responsive within a very small number of scans (e.g., 1 to 3 scans - as low as a single scanning attempt).
Related to hypothesis 1, this thesis explores 3 new techniques to detect the differ-ing topological vantages of attack (i.e. remote to local, local to remote, and local to local) within an enterprise network.
Hypothesis 2: it is possible to make novel use of address resolution protocols to detect malicious network activity, including some zero-day worms.
Hypothesis 3: it is possible to devise a highly efficient scan detection technique which does not rely on who is doing the scanning, but rather on what service (or in general, what resource) is being scanned for. Here, as one example of efficiency, system state (in terms of main memory consumed) need not increase linearly with bursts in external scanning activity.
1.2 Network-based Intrusion Detection Schemes
Network scanning activities are typically undertaken to locate and identify active hosts in the network and the associated services they offer (i.e. designated by open ports). A variety of complex heuristics have been successfully developed to detect
scanning activity including the observation of connection failures [29, 58], statisti-cal measures [31, 64], abnormal network behaviors [71, 76, 18], and connections to network darkspace (i.e. the unused IP addresses within a network) [19, 36]. Those network scanning detection algorithms that identify remote host (i.e. hosts external to the local network) scanning activity can be considered attribution-based as they focus largely on observing and classifying external network behavior (i.e. incoming network connection attempts) to detect scanning systems and therefore experience the limitations described in the previous section.
Network scanning detection techniques are implemented in a number of network-based intrusion detection systems. A number of definitions exist that attempt to define network-based intrusion detection systems based on a characterization of their underlying detection principles, however, they can be broadly classified into three types (adapted from [59]): (1) misuse detection, (2) anomaly detection, and (3) specification-based detection.
• Misuse detection is implemented by comparing collected network data to known malicious intrusion signatures (e.g. patterns). Misuse detection systems typically do not require any training periods and are fairly simple to use and deploy. They are limited in that they are only able to detect malicious activity based on prior knowledge (e.g. some unique discernible pattern of the attack is known) and therefore new or novel attacks may not be detected.
• Anomaly detectionis implemented by comparing the behavior of the network or systems that comprise it with a model of expected behavior. The model of normal behavior is typically constructed through the use of a training period or datasets and the use of machine learning techniques. In general, an impor-tant consideration for any technique that requires a training period is that any existing malicious activity may become part of the baseline. Techniques based on anomaly detection have the potential benefit of being able to detect new or novel attacks but they usually involve a time intensive endeavor to keep updated and can be complex to use. For instance, additional analysis will be required to identify both the type and severity of any detected attack.
• Specification-based detection is implemented by developing specifications of legitimate system behavior for comparison against observed system behavior. Although this technique is similar to anomaly-based detection, it does not rely on machine learning techniques but rather manually developed specifications of accepted system behavior. In practice, specification-based detection techniques avoid the typically high false positive rate experienced by anomaly-based tech-niques but at the expense of a significant amount of time to develop proper and comprehensive specifications.
The network scanning detection strategies developed in this thesis can be catego-rized as anomaly-based detection techniques. Specifically, our techniques rely on the passive observation of internal network hosts as they interact with hosts both within and external to the local enterprise network.
1.3 Contributions
The overall contributions of this dissertation can be summarized as follows.
1. Internal Network Scanning Detection Techniques: we present two new techniques to detect scanning systems within a local network based on the anomalous behaviors they exhibit when using the address resolution protocols (i.e. Address Resolution Protocol (ARP) [48], and Domain Name Service (DNS) [37]). Based on our evaluation, using datasets obtained from a small university network, these techniques offer a significant improvement over existing scan-ning detection techniques. Specifically, in certain network environments, these techniques can identify scanning hosts within an enterprise network after the observation of only a single scanning attempt with a low false positive and negative rate. Preliminary results appear in two published papers [71, 72].
(a) ARP-based detection: this behavioral signature is based on the ob-servation that a scanning host targeting systems within its own network exhibits anomalous behavior distinct from normal ARP activity; specifi-cally, scanning hosts exhibit discernible behavioral changes in the amount
and pattern of ARP request activity of the scanning host, because a scan-ning host targeting local network hosts triggers the broadcast of anomalous ARP requests.
(b) DNS-based detection: we exploit the observation that the vast major-ity of publicly available services are accessed through the use of DNS as this protocol provides the mapping between numeric IP addresses and the corresponding alphanumeric names. Many fast scanning worms and au-tomated scanning tools use a pseudo random number generator (PRNG) to generate 32-bit random numbers that correspond to an IPv4 address. The use of a numeric IP address, instead of the qualified domain name of the system, obviates the need for a DNS query. If we do not observe DNS activity before a new connection is initiated, we consider this connection anomalous and potential scanning activity.
2. External Network Scanning Detection Strategies: we present a technique that detects network scanning activity (both UDP and TCP scanning) directed against a local network from remote hosts. We exploit, for defensive purposes, the concept of exposure maps and darkports. Exposure maps are tables listing the open ports (ports actively providing service) on active systems. Darkports refer to the unused ports on active systems.
(a) Exposure maps: are built by passively observing and characterizing the connectivity behavior of internal hosts in a network as they respond to both legitimate connection attempts and scanning attempts. Exposure maps differ from current scanning detection techniques as they rely on identifying the services offered by the network instead of tracking external connection events. The result is a scanning detection technique in which the utilized system detection state does not grow in proportion to the amount and fluctuation of external network traffic, but rather increases only with the number of services offered by the network, regardless of the size of the network and the external network activity. Preliminary results of this technique have been published [73, 75]. Unlike most attribution-based
scanning detection techniques (that detect remote scanning systems), the scanning detection approach does not rely on identification of the scanning source to detect scans against a network. Thus, it can detect certain classes of sophisticated scanning techniques that make determining the root cause of the scanning activity impractical. However, this approach does not preclude the use of some form of attributionpost scan detection. Scanning worm propagation and auto-rooters are two prevalent examples of scanning activities where immediately denying the scanning source access to the network is both relevant and important.
(b) Comparison to Threshold Random Walk (TRW): TRW is a scan-ning detection technique [29, 28] and has been positioned as thegold stan-dard in existing scanning detection algorithms [22]. We performed a lim-ited comparison (i.e. only a few selected values of TRW parameters were chosen in our comparison; a more complete analysis would explore a full range of values) with TRW and a modified TRW technique we developed through augmentation with the exposure maps technique, using three dif-ferent network datasets. Our results show that exposure maps offers an equivalent scanning detection capability while offering additional function-ality. Namely, exposure maps can be used to detect sophisticated scanning activity, enable fine-grained automated defense against automated malware attacks, provide a mechanism to identify the network information gained by a successful scanning system, and detect real-time changes in a network that may indicate a successful compromise. As well, the modified TRW technique offers the possibility of better performance than TRW in terms of faster scan detection as the use of the NEM obviates the need to wait in the determination if a connection attempt will succeed or fail.
(c) Use for sophisticated scan detection: unlike existing scanning de-tection schemes that rely on the correlation of multiple network events
(e.g. number of failed or successful connection attempts observed) to de-tect and report scanning activity, the exposure maps technique generates and records individual connection attempts to darkports (i.e. darkport
connection attempts – DCAs) that can be used for further analysis to de-tect sophisticated scanning activity. We define the darkports on a given (populated) host as those ports that have not been observed offering any services, and thus are not expected to accept external connection requests (see Section 4.1). We have developed post-scan parsing scripts that pro-cess and use heuristics to: (1) classify DCAs into their respective scanning campaigns, and (2) identify and correlate the DCAs that comprise a form of distributed scanning. As one example, we analyze in detail a distributed scan involving the coordination between 14 scanners detected by our tech-nique in one of the network datasets. The raw output from exposure maps supports the rapid development of additional heuristics to identify other types of simple or sophisticated scanning activity (e.g. slow scanning).
3. Other Applications of Exposure Maps: the exposure maps technique offers the additional benefit of enabling the following capabilities.
(a) Automated response: the identification of darkports during the con-struction of the exposure maps provides network-centric knowledge en-abling fine-grained automated responses, e.g. to identify and deny specific systems network access when they are found to be both performing scan-ning activity and thereafter trying to access a legitimate service in the net-work (common behavior for auto-rooters and scanning worms [44]). This introduces the ability of selective automated response: a focused real-time active response option that limits the introduction of new access control rules to exclusively deny only those scanning systems known to be directly threatening network assets (i.e. those known to be targeting actual services offered by the network). We emphasize the subtle point, that (using our technique) systems that scan for services not offered by the network may be simply identified (i.e. scan recorded) but otherwise ignored (e.g. no access control rule need be introduced to block the associated source IP address). This ability to initiate selective automated response reduces network con-figuration changes, complexity errors (e.g. by avoiding a dramatic increase
in router/firewall rules, and possibly leading to a self-imposed denial of ser-vice), and avoids unnecessary performance degradation of network security devices [8, 78].
(b) Network asset identification and discovery: the exposure maps tech-nique can be used on both enterprise and backbone networks to logically classify systems into exposure profiles that identify and group systems ac-cording to the services they offer. We provide arisk-based example of how hosts can be grouped into profiles by the services they offer and the per-ceived threat to the network (e.g. a host that offers a service on a known trojan port would be grouped into the high risk profile). The exposure pro-files are configurable and therefore suitable for any network environment. Additionally, we discuss the practical application of exposure profiles and how they can be used to identify malicious network activity (e.g. botnets and worm outbreaks). The technique requires very little computational overhead and easily scales to large enterprise environments or even back-bone networks.
(c) Reconnaissance Activity Assessment (RAA): we extend the basic exposure maps concept to include information obtained by recording ap-plication banners associated with the IP address and port/protocol of the host offering the service (i.e. anenhanced exposure map). Application ban-ners are routinely sent by servers that offer frequently used protocols (e.g. SMTP, HTTP, SSH) responding to client requests. These banners typi-cally contain information such as type of application software and version number. An enhanced exposure map is analogous to an overall catalogue of the host application information (i.e. type and version) divulged by the local network to friend and foe alike. It provides a mechanism to enumerate, record, and report this information leakage in near-real time that enables: (1) confirmation that the applications installed on specific hosts are in compliance with the network security policy and (2) a method to determine what network services (i.e. IP address, port, protocol) and application (e.g. banner, server strings) information was divulged to an
adversary as a direct result of specific network scanning campaigns. The framework developed to passively detect the application banners for inclu-sion in an exposure map is extensible (i.e. using a Bro policy script that contains signatures using special text strings known as regular expressions (regex) [52] that can precisely describe search patterns) and can accom-modate new or custom application identification. Thus, we provide an answer for the question, “What information has been revealed about the network as a result of a specific detected scanning activity?”
The above contributions are supported by prototype implementations. The three scanning detection techniques mentioned above (described in items 1 (a), 1 (b) and 2 (a)) have been fully implemented (including both UDP and TCP scanning detec-tion) and tested in either a software prototype (for the DNS-based and ARP-based techniques) or as Bro [45] policy scripts (for the exposure maps technique) using commodity platforms. Additionally, we built and tested a new variant of the TRW scanning detection algorithm that augments TRW with our exposure maps technique in a Bro policy.
1.4 Overview of Chapters
The overall structure of the dissertation is as follows. Chapter 2 provides basic back-ground on network discovery techniques, and network scanning strategies. Chapter 3 discusses related work in the field and the current state of the art in network scanning detection techniques. Chapter 4 describes our evaluation approach and methodol-ogy for the exposure maps technique including our implementation in a Bro policy. Chapter 5 discusses our evaluation datasets and testing results for all of the expo-sure maps capabilities including a limited side-by-side comparison with TRW and a modified TRW technique that has been augmented with an exposure maps NEM. Chapter 6 describes our evaluation of our DNS-based scanning detection technique that includes a detailed discussion of our implementation, evaluation methodology, testing results, and limitations. Chapter 7 describes our evaluation of our ARP-based
scanning detection technique that includes a detailed discussion of our implementa-tion, evaluation methodology, testing results, and limitations. Chapter 8 summarizes the contributions this dissertation and describes future research directions. Finally, Appendix A contains reference material that includes an acronym list as well as a list of network services with the associated TCP/IP port numbers.
Background
In this chapter we provide a discussion of passive and active network discovery tech-niques as well a variety of network scanning strategies.
Some form of reconnaissance activity often precedes an attack. An effective mech-anism used by an adversary to remotely probe a network isport scanning [16]. Aport scan can be defined as sending packets to a particular IP/port combination to elicit a response in an attempt to discover active systems in the network and the particular services they offer. Even in the instance where no response is given from the host be-ing port scanned, the adversary still learns somethbe-ing about the host or the network where it resides. Namely, the host is either unreachable due to network constraints (e.g. not accessible remotely, behind a firewall) or the service being scanned is simply not offered. Port scans are directed against a host using either the UDP or TCP pro-tocol on one or more of the 217 possible ports (i.e. 216TCP ports and 216UDP ports). Herein when the terms scanning or scan are used in this thesis we are referring to port scanning. Additionally, we refer to a series of connection attempts (i.e. one or more) to IP/port combinations in which there is insufficient evidence to determine if the activity is a scan or simply the result of legitimate connection attempts asambiguous connection attempts.
We define how exposure maps detects scanning activity in Section 4.1.1 and de-scribe two heuristics we developed for analyzing Darkport Connection Attempts (see Section 4.1.1, page 43) generated by the exposure maps technique for use in our side-by-side comparison with TRW and the detection of distributed scanning activ-ity in Sections 5.1 and 5.1.2 respectively. We define how the modified TRW and TRW techniques classify network activity as scanning activity in Sections in 4.1.5 and 3.1 respectively. Finally, we define how the DNS-based scanning detection (i.e. anomalous DNS activity) and ARP-based scanning detection (i.e. anomalous ARP
activity) techniques classify network activity as scanning activity in Sections 6.1 and 7.1 respectively.
2.1 Passive and Active Network Discovery Techniques
Network scanning is a form of active scanning. The term active is used to describe this activity as some stimulus (i.e. packet) is injected in the network to generate a response from the recipient. Active scanning is a technique employed by malicious adversaries to probe a network. However, active scanning has legitimate uses as a part of a robust network security policy that incorporates vulnerability scanning. Active scanning allows a network operator to discover the open services in the network so they can be checked for known vulnerabilities. For instance, Nessus [41] is an active vulnerability scanner that can discover the type of operating system, applications, databases, and network services running on individual hosts. This information can be checked against a database of known vulnerability information to determine if a discovered host is potentially vulnerable to any of these known attacks. In contrast,
passive service discovery is the process of monitoring network layer traffic to detect network topology, offered services, and applications. Passive service discovery does not generate any network traffic between the servers and clients in a network.
Remote operating system fingerprinting is the action of trying to remotely deter-mine the operating system of a particular host of interest. For instance, Nmap [21] is an active OS fingerprinting tool that sends packets to a host so that any responses (or lack of responses) can be analyzed. The responses to these sequences of packets form a signature orfingerprint for the remote operating system that can be compared against a signature database of known operating system versions. Operating system fingerprinting takes advantage of the observation that each operating system’s net-work stack (i.e. software that implements the TCP/IP protocol) has slight variations in the way it responds to certain packets. These variations offer the ability to re-motely determine the type of operating system. For instance, one OS fingerprinting test is to send a TCP SYN packet with no flags set (i.e. known as a NULL packet) to the host being scanned. The type of response (or lack of a response) to this packet gives insight about the type of operating system being scanned. A series of additional
similar tests are performed concurrently (using other forms of unusual packets) and once the results are correlated and analyzed, the type and version of the operating system is usually revealed. In contrast, p0f [81] is a passive operating system finger-printing tool. It can determine characteristics such as the presence of a firewall or proxy, distance (hop-count) to the physical system, host up-time, and the link speed of the remote host. p0f does not generate any packets on the network it is monitoring. Instead, p0f relies on extracting features exclusively from the passive observation of network activity between hosts of interest.
Application fingerprinting is the action of trying to remotely determine the ap-plications or services running on a particular host of interest. Servers routinely send information about the applications they are running to client systems during normal connection activities. The initial text sent by servers during a connection attempt is known as a banner. The act of harvesting banners (i.e. banner grabbing) during passive or active identification of network systems and their applications is a well understood concept. For instance, banner grabbing would be routinely performed during vulnerability testing (e.g. penetration testing) of the network. The software versions advertised in application banners can identify potential security issues if it is determined that the software version contains known vulnerabilities.
An examination of the Server field in the HTTP response header, such as
Apache 2.0.54 (Debian GNU/Linux), provides an example of how banner grabbing can be used to identify HTTP servers. This response exhibits the type of server software, software version, and underlying operating system. The purpose of an application banner is to facilitate determining how a client system can best interact with the server based on the applications it is running. This information also divulges to an attacker potential vulnerabilities in the system associated with the specific version of the software.
Passive Asset Detection System (PADS) [61] is signature-based software used to passively detect network assets using application fingerprinting. It attempts to pro-vide an accurate and current listing of the hosts and services offered on the network. It utilizes the TCP, ARP, and ICMP protocols to perform its signature matching.
One of the methods it uses to perform application layer fingerprinting is banner grab-bing. Trickler is another publicly available (upon request) software tool to do passive network characterization [34]. It can passively fingerprint hosts without the use of signatures and track the state of tens of millions of hosts on commodity hardware.
Considerations for Passive and Active Techniques. Active scanning
techniques are well suited to find the open services currently on a network. However, these techniques are not without their drawbacks. The results from an active scan can only be considered asnapshot in time of the services being offered on the network and may quickly become out of date and inaccurate. Furthermore, the scans generated by these techniques can be invasive and in some instances cause service interruptions due to the type of packets (e.g. malformed, unlikely flag combinations, etc. ) that may be sent when trying to identify a host or service. In contrast, passive network discovery techniques continuously monitor the network providing a near real-time view of the offered services and active hosts. As no packets are injected in the network, there is no risk of unintentional service disruption. Passive monitoring also has the advantage of being able to find intermittently offered or protected services that are often missed by active probing (e.g. behind a firewall) [6]. However, passive monitoring techniques are much slower at detecting inactive hosts and transient services. Additionally, passive network discovery techniques can identify hosts and variations in versions of the services they offer only if it is discernible in network traffic (i.e. the particular software version transmits some type of unique pattern). For instance, if a patch was applied to a new version of an application that did not change its behavior on the network, it would not be possible to determine if the host was using the old or new version of the software. It is important to note that active scanning techniques will also have this limitation if a type of probe cannot be developed to differentiate between software versions. Finally, there have been techniques proposed to defeat OS fingerprinting [62] that could be extended to application fingerprinting. In this scheme, a network scrubber is used in-line to modify packets sent by local network hosts to remote systems thus obfuscating the features required by OS fingerprinting tools.
2.2 Network Scanning Strategies
Network scanning activity in an enterprise network can be characterized as occurring: local to local (L2L), local to remote (L2R), and remote to local (R2L).
L2L network scanning refers to a host that scans systems within the boundaries of the enterprise network in which it resides (see Figure 2.1(c)). Topological scanning worms frequently employ this type of scanning strategy. In larger enterprise networks, it is not unusual for network segments to be either logically or physically separated. In fact, an enterprise network may be comprised of several distinct subnets (often referred to as cells). This separation can occur for a variety of reasons including security, ease of administration, and geographic location. Figure 2.1(a) shows a net-work containing three logical cells. L2L netnet-work scanning activity can occur within or between network cells.
L2R network scanning refers to a host within administrative control of the enter-prise network scanning systems outside the network boundary (see Figure 2.1(d)). In this context, the scanning host is performing network reconnaissance against external systems.
R2L network scanning refers to scanning activity directed at a network by a host outside the target network’s administrative control (see Figure 2.1(b)).
The majority of publicly available research to date has been focused on detecting R2L network scanning activity. We have developed scanning detection strategies that detect R2L as well as L2L, and L2R scanning activity.
The following two subsections describe network scanning approaches that can be broadly characterized into two categories: wide-range reconnaissance, and target-specific reconnaissance.
2.2.1 Wide-range Reconnaissance
Wide-range reconnaissance can be defined as the rapid scanning of large blocks of Internet addresses in the search for a specific service or vulnerability. Typically, there is little human interaction in this type of reconnaissance. This is characteristic of
auto-rooters [66] and worm propagation. Auto-rooters are composite tools that aug-ment basic port scanning functionality by launching an attack as soon as an open
!"#$%"$#
&'()*+,
-./ &'()*+,
(a) Network Cells.
!!!!!!!!!"#$%&#%$
'()*+,!
-./ '()*+,!
'01##2#3
(b) Remote to Local (R2L) Scanning Activity.
(c) Local to Local (L2L) Scanning Activity.
!!!!!!!!!"#$%&#%$
'()*+,!
-./ '()*+,!
'01##2#3
(d) Local to Remote (L2R) Scanning Activity.
port is located on a target system [4]; they are often used for the rapid enrollment of vulnerable systems into botnets of tens or hundreds of thousands of compromised systems [5]. Simple scanning worms propagate by indiscriminately probing the In-ternet as rapidly as possible to locate and infect vulnerable systems. Scans from auto-rooters and scanning worms can usually be attributed to the true source as the scans themselves are the first stage of the actual exploit attempt (e.g. a response, from the target, to a TCP SYN connection request will start the exploit in the same session). The next section explores worm propagation strategies in detail.
2.2.2 Target-specific Reconnaissance
In contrast to such indiscriminate scanning, skilled adversaries may go to considerable lengths to mask their activities. Numerous sophisticated scanning techniques allow stealthy, focused scanning of a predetermined target (host and/or network); some of these make attribution to the scanning source impractical, rendering most current scanning detection techniques ineffective. The following techniques belong to this category.
Indirect scanning occurs when an attacker uses one system (or systems) to scan a target and another system to attack the target. This separation defeats attribution attempts. If the scanning activity from the scanning system is detected (e.g. blocked at a network router, or by system administrator intervention), the attacker simply uses another scanning system. A slightly more sophisticated variation uses throw-away scanning systems, i.e. previously compromised systems that have little value to an attacker other than being able to provide a disposable platform to perform tasks. Any scanning activity traced back to the source, will be attributed to the owner of the compromised system.
Distributed scanning occurs when multiple systems act in unison using a divide and conquer strategy to scan a network or host of interest. Typically, one system will act as a central node and collect the scanning results from all participating systems. Distributing the scanning activity reduces the scanning footprint from any single system and thus reduces the likelihood of detection. An extreme version of distributed scanning involves an attacker using a botnet (see below) to scan a target
in a coordinated manner resulting in very stealthy scans.
Botnet scanning occurs when a collection of compromised systems (bots or zom-bies) are used to scan a target. A botnet can provide an attacker with, in essence, an unattributable method of reconnaissance. For instance, consider a botnet owner that has an exploit capability against a network service. A botnet of approximately 65,000 systems would be able to scan an entire Class B network for this service by sending a single packet from each bot (each with a unique IP address). In this example, even if it were possible to correlate this activity to a single scanning campaign, it still would not reveal the true adversary as the bots are simply zombie participants.
Idle scanning [57] allows an attacker to port-scan a target without sending a single packet from the attacker’s own system.1 The attacker first sends a SYN packet to the port of interest on the target host spoofing the source address of the packet with the IP address of an innocent system (hereafter referred to as a bot). If the port is open, the target responds to the bot with a SYN ACK. The bot does not expect this unsolicited SYN ACK packet so it responds with a RST packet to the target and increments the 16-bit identification field (IPID) it includes in its IP header. The attacker then sends a SYN packet to the bot and observes the IPID field of the RST packet the bot sends back. If the IPID has been incremented, the port on the target was open. Idle scanning utilizes side-channel communication by redirecting the scan and bouncing it off a third-party system. Most scanning detection algorithms will erroneously identify the third-party system as the scanner.
Low and slow scanning occurs when an attacker slowly scans a target host or network (e.g. a single scanning campaign may take days, weeks or months). Slow scans may blend into the networknoise never exceeding detection thresholds or exhausting detection system state.
2.2.3 Worm Propagation Methods
A computer worm is a program that can self-propagate across a network by exploit-ing vulnerable systems [69]. Worms are typically classified based on two attributes: methods used to spread, and the techniques used to exploit vulnerabilities. Every
vulnerability a worm can exploit allows it to self-propagate across a network. Most worms propagate by using indiscriminate scanning of the Internet to identify vulner-able systems. As revealed by Slammer [39], the faster a worm can locate systems the more rapid the infection rate. Staniford et al.’ s study [65] used empirical data from actual worm outbreaks to derive a common effective propagation strategy, the random constant spread (RCS) model, wherein a worm randomly scans through the entire Internet IPv4 address space, of 232 systems, searching for vulnerable systems.
Traditional Propagation Methods. The limiting factors which dictate how fast a worm can spread are [68]: (1) the rate of scanning used to detect vulnerable systems, (2) the population of vulnerable systems, (3) the time required to infect vulnerable systems, and (4) its resistance to countermeasures. The spread of a random scanning worm can be described in three phases [82]: the slow spreading phase, fast spreading phase, and slow finishing phase.
In the slow spreading phase, the worm is building up an initial base of infected systems. Although it is infecting systems at an exponential rate, the small initial population limits the propagation speed. Once a certain threshold of infected hosts is reached, the worm begins the fast spreading phase. Models derived from actual worm data indicate that this threshold is approximately 10,000 systems [65]. Worms can use a number of different techniques to propagate including [65]:
1. Random Scanning. The Internet IPv4 address space consists of 232 unique IP addresses. Using a pseudo random number generator, the worm randomly scans the Internet address space searching for systems to infect.
2. Subnet Scanning. A subnet is a range of logical IP addresses within a defined network address space. Using the host’s own IP address as a reference, the worm scans the IP addresses in that subnet. Generally, systems within a subnet will be located physically close to one another and have a similar security stance.
3. Topological Scanning. Instead of performing random or subnet scanning, the worm uses information resident on the host to find vulnerable systems. This information includes URL caches, peer-to-peer connections, trusted network connections, and email addresses from address books on the host machine.
4. Mass email. Using host-resident emailers, worms can utilize information as in topological scanning, for example harvested email addresses from existing email address books, the inbox of the email client, and web page caches. Copies of the worm are then sent to all the hosts corresponding to the harvested email entries.
5. Network Share Traversal. Through shared network drives, systems often have access to directories on other systems. By placing itself on a host that is part of a shared system, a worm can use this shared access to infect other systems. The worm can also take a more active role and change permissions on directories or add guest accounts. This technique is also related to topological scanning.
6. Web-based Attacks. There are a multitude of web server attacks available that can be used by worm writers to infect systems [50]. Once the worm has infected the system, it can append malicious code to specific or random web pages. Systems that access these modified web pages with a vulnerable web browser will be infected.
7. Hit-list Scanning. A hit-list is a list of vulnerable systems that are high-probabillity-of-success candidates for infection. Typically, a hit-list is generated by previous reconnaissance activities such as: network scanning, web surveys, DNS queries to obtain IP addresses, and web spiders. A hit-list is used to allow a worm to rapidly spread in the first few minutes. This increases its virulence and its chances of survival.
8. Permutation Scanning. Random scanning of the Internet for vulnerable hosts can be inefficient because many addresses may be probed multiple times. One way to address this limitation is to have the worms share a common pseudo random permutation of the Internet address space. Infected systems can start scanning at a specific point in the permutation selected in such a way as to avoid unnecessary duplication in scanning between infected systems. If the worm detects an infected system within its scanning permutation order, it simply picks a new random point in the permutation and begins scanning again. Thus, no communication between infected systems is required to reduce the amount of
redundant reinfection and this technique also imposes a measure of coordination on the worm.
Items 7 and 8 are hyper virulent worm propagation strategies described by Weaver et al. [65]. Prior to 2004, these strategies were apparently not implemented by worm writers. The analysis of the Witty worm [60] suggests that due to the propagation characteristics, simultaneous scanning likely occurred due to the use of a hit-list or because of a timed release from a group of previously compromised systems.
Related Work
In this chapter, we review the relevant literature on techniques and methods to per-form network scanning detection for an enterprise network. Section 3.1 contains an analysis of the Threshold Random Walk (TRW) scanning detection algorithm that includes a description of a specific implementation of the algorithm by Jung et al. [29]. Sections 3.2 and 3.3 respectively, discuss a variety of additional external network scanning detection (i.e. R2L) strategies and internal network scanning detection (i.e. L2L and L2R) strategies.
3.1 External Network Scanning Detection Strategies – TRW
Jung et al. [29] developed an algorithm called Threshold Random Walk (TRW), to identify malicious scanning activity from remote hosts. We summarize their work here. The approach usessequential hypothesis testingto evaluate each new connection request. They based this algorithm on the observation that scanners are more likely to try and access hosts and services that do not exist than legitimate remote hosts. Thus, if a host tries to connect to a system and the destination exists, then there is support for the hypothesis that the source is benign. If the destination does not exist, this is used as support for the hypothesis that it is more likely a scanning system. Once there is enough evidence gathered through observation of ongoing network activity, one of two hypotheses is either accepted or rejected.
Specifically, the algorithm evaluates two possibilities, H0 andH1, where H0 is the hypothesis that the remote source of the connection attempt (r) is benign and H1 is the hypothesis that r is a scanner. Given a remote host r, let Yi be the random
variable that represents the outcome of the connection attempt byr to theithdistinct
local host, where
Yi =
0 ; if the connection attempt is a success
1 ; if the connection attempt is a failure (3.1)
If we assume that conditional on the hypothesis Hj, the random variables Yi, i=
1,2, ... are both independent and identically distributed, then variable Yi can be
ex-pressed as
P r[Yi = 0|H0] =θ0; P r[Yi = 1|H0] = 1−θ0
P r[Yi = 0|H1] =θ1; P r[Yi = 1|H1] = 1−θ1
(3.2)
We would expect θ0 to be relatively high, and θ1 to be relatively low (as discussed further below). As each new connection attempt is observed, the likelihood ratio for the remote host is defined as [29]
Λ(r) = n $ i=1 (P r[Yi|H1] Pr[Yi|H0] ) (3.3)
whereYiis the collection of events observed thus far involving the specific remote host
r, andnis the total number of observed connection attempts byr to the local network. The likelihood ratio is compared to a lower threshold, η0, and an upper threshold,
η1. If Λ(r) ≤ η0 then hypothesis H0 is accepted. If Λ(r) ≥ η1 then hypothesis H1 is accepted. After a certain number of connection attempts or a timeout period is observed if neither η0 or η1 is reached, the remote host is classified as undetermined, i.e. it is not possible to determine if it is a scanner or benign (see Figure 3.1).
The two hypotheses (H0, H1) can generate four possible outcomes.
1. True Positive: this decision occurs when H1 is selected and H1 is true.
2. False positive: this decision occurs when H1 is selected and H0 is true.
3. False negative: this decision occurs when H0 is selected and H1 is true.
4. True Negative: this decision occurs when H0 is selected and H0 is true.
The TRW probability of detection variable, PD, and the false positive probability, PF, are used to bound the performance conditions of the algorithm. The detection
!1 !0 Undecided Scanner Benign
Time
Ratio
Figure 3.1: Using Likelihood Ratio to Classify Remote Hosts.
positive probability, PF is the probability that H1 is selected and H0 is true. The upper threshold (η1) that supports hypothesis H1 is
η1 =
PD PF
(3.4)
When PD and PF are replaced by the user defined values β and α respectively, η1 is defined as
η1 :=
β
α (3.5)
The lower threshold (η0) that supports hypothesis H0 is 1−PD
1−PF
=η0 (3.6)
When PD and PF are replaced by the user defined values β and α respectively, η0 is defined as
η0 := 1−β
1−α (3.7)
The average number of connections a remote host needs to make (N) before a determination of whether it is benign or a scanner can be made is a function ofα,β,
θ0, andθ1. Specifically, the expected number of observations required to determine if a remote host is benign, E[N|H0], or a scanner, E[N|H1], is defined as [29]
E[N|H0] = αlnβ α + (1−α) ln 1−β 1−α θ0ln θ1 θ0 + (1−θ0) ln1−θ1 1−θ0 E[N|H1] = βlnβ α + (1−β) ln 1−β 1−α θ1ln θ1 θ0 + (1−θ1) ln 1−θ1 1−θ0 (3.8)
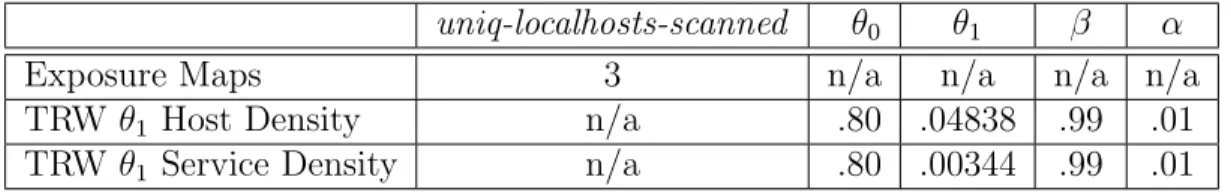
The alert threshold (η0 andη1) is defined based on both the desired detection and false positive/negative rates. The typical assignment for a desired false positive rate (α) is .01 and .99 for the desired detection rate (β) [29]. Theθ0 andθ1 variables define the calculations of the likelihood ratio based on whether a successful connection from a remote host is from a benign or scanning host respectively.
The value chosen for θ1 should be dependent on the network being monitored. A reasonable setting forθ1would be based on a ratio of the number of remotely accessible active hosts in the network (i.e. density of remotely accessible hosts) to total local network address space. For instance, in a quarter class C network (not including broadcast addresses) with 3 remotely accessible servers, a value of θ1 = .04838 (i.e. 3/62) may be appropriate. It is more subjective as to what the value θ0 should be set. However, given that θ0 is the probability that a benign host makes a successful connection attempt it should be set relatively high. In the original paper [29], the authors set the value of θ0 =.80 and θ1 =.20 based on their analysis: that very few benign hosts made connections to more than four distinct IP addresses; the observed differences in the network behavior of scanning and benign hosts within the network datasets; and the knowledge of the host density of the network.
Using these same values if a remote host made four failed connection attempts, in the absence of any successful connection attempts, it would be considered a scanner [29]; there was an additional constraint for this specific implementation in that these failed connection attempts had to occur against unique hosts. Note that from equation (3.3), the smallest positive integer x such that Λ(r) = (1−θ1
1−θ0)
x ≥ η
argued that requiring the observation of at least four failed connection attempts to unique hosts in the network before a remote host could be classified as a scanner would reduce the number of false positives that a lower threshold would produce due to either peer-to-peer (P2P) or backscatter traffic [40]. In the case of a remote host that makes both successful and failed connection attempts to the local network, the likelihood ratio will either be reduced or increased by an amount dependent, in part, on the values of θ0 and θ1. The calculations of the likelihood ratio, and the comparisons to the thresholds, will continue until some threshold (η0 orη1) is reached thereby selecting a hypothesis, or the connection pattern history of the remote host does not allow the algorithm to reach a decision on whether the remote host is benign or a scanner (e.g. an insufficient number of connection attempts are observed or the connection patterns are such that no decision on a hypothesis can be made). It should be noted that the summing of valuesθ0 =.80 and θ1 =.20 to 1 is purely coincidental and leads to symmetries (e.g. in terms of the number of failed or successful connection attempts to declare a remote host is a scanner or benign) that do not hold in general.
TRW, as discussed above, has been implemented as a scanning detection algorithm in Bro. Bro [9] is an open source intrusion detection system developed by Paxson. Bro passively monitors a network link and uses an event engine to generate a variety of events based on the network traffic it intercepts. Events are then processed by user-supplied policy scripts to perform both network and security analysis in near real-time. Policy scripts contain event handlers that can perform various actions based on the corresponding event generated. The event handlers can generate and maintain global state information as well as specify the actions Bro should take (e.g. record activity to log file, update data structures, generate an alert) in response to network events. Bro inspects and groups packets into connections for analysis. This model is a natural fit for the TCP protocol. The UDP and ICMP protocols are connectionless but nonetheless are also modeled as connections using a flow-like
definition. Specifically, a flow can be described as a set of TCP or UDP packets that share the same connection parameters (i.e. source IP, destination IP, source port, and destination port) indicating they are part of the same connection.
for the TCP protocol. In order to understand how TRW is implemented as a Bro policy, we now discuss in detail relevant aspects of Bro as well as the high-level TRW implementation details found in the trw-impl.bro policy.
Bro Monitoring System Bro Policies alarm.bro trw-impl.bro conn.bro trw-impl.bro tcp.bro conn.bro
2. initiate function call
3. return boolean value
generate TRW scan alerts 1. network event
Figure 3.2: trw-impl.bro Policy Interaction.
The TRW algorithm is implemented as a function (i.e.trw-impl.bro) called when any of the following events are handled in the conn.bro policy: event connection _established, event connection_attempt, or event connection_rejected (see Figure 3.2). When these events occur, connection information (i.e. a Bro-defined connection record) as well as a boolean variablereverseis passed to the TRW func-tion for evaluafunc-tion. The reverse variable, if true, indicates that a TCP connection has been established due to the detection of a SYN ACK packet but the associated SYN packet that should have started the three-way TCP handshake has not been ob-served. Although this is a natural possibility, it may also be as a result of SYN ACK scan (i.e. a scan that consists of packets with the SYN ACK flag set) or more likely backscatter traffic [40]. Ordinarily, Bro interprets the end point system that sends the SYN ACK packet as the responding host. In this case, the end point system that sent the SYN ACK packet is actually the originator of the connection (in the context of responding and originating systems). Bro switches the systems roles accordingly. The conn.bro policy is primarily responsible for generating one line summaries of
Table 3.1: Bro Connection States (adapted from [10]). *indicates the state is associated with a failed connection attempt. State Name Description
S0* SYN packet detected, indicating a new connection but no reply was observed.
S1 Connection established, not terminated.
SF Normal connection establishment and termination. REJ* Connection attempt rejected.
S2 Connection established and close attempt by originator seen (but no reply from responder).
S3 Connection established and close attempt by responder seen (but no reply from originator).
RSTO* Connection established, originator aborted (sent an RST). RSTR Connection established, responder aborted.
RSTOS0 Originator sent a SYN followed by a RST, no associated SYN ACK packet was observed from the responder.
RSTRH Responder sent a SYN ACK followed by an RST, we never saw a SYN from the (purported) originator.
SH Originator sent a SYN followed by a FIN, we never saw a SYN ACK from the responder (hence the connection is half open). SHR Responder sent a SYN ACK followed by a FIN, no SYN from
the originator.
OTH* No SYN seen, just midstream traffic (a partial connection that was not later closed).
observed connection information. Each connection is assigned a state as defined in Table 3.1.
Figure 3.4 shows the sequence of events for the establishment and termination of a normal TCP connection. Mapped within the state portion of this figure are seven of the associated states identified in Table 3.1 at the point in the connection attempt where they would be generated if the connection ended at the associated time (t). For instance, the state S0 is generated when a SYN packet is observed at time (t)but no other packets for this connection are seen. State S1 is generated as a result of a TCP connection being fully established (i.e. three-way handshake was completed from time t until time t+5) but no subsequent termination of the connection was observed i.e., FIN and ACK packets expected between time (t+7+n) and (t+13+n) did not occur. The value n ≥0 indicates some arbitrary amount of time has elapsed during


![Table 5.3: Expected Number of Connection Events (E[N |H 1 ]) to Confirm a Remote Host is a Scanner With α = .01 and β = .99 Kept Constant.](https://thumb-us.123doks.com/thumbv2/123dok_us/8928689.2376685/89.918.254.712.205.477/expected-number-connection-events-confirm-remote-scanner-constant.webp)

