Turun kauppakorkeakoulu • Turku School of Economics
BUSINESS INTELLIGENCE – ENABLING
SELF-SERVICE
A case study in a global manufacturing company
Master´s thesis
in information systems science
Author: Henry Liljeström Supervisors: D.Sc. Reima Suomi D.Sc. Matti Mäntymäki 26.10.2015 Espoo
1 INTRODUCTION ... 5
2 BUSINESS INTELLIGENCE ... 8
2.1 Overview of Business Intelligence ... 8
2.1.1 The concept of BI then and now ... 8
2.1.2 Definitions of BI ... 10
2.1.3 Technical BI architecture ... 12
2.1.4 Business analytics – new methods ... 15
2.2 Business intelligence in use at different organizational levels ... 17
2.2.1 The business goals for BI ... 17
2.2.2 Ways of using BI ... 19
3 SELF-SERVICE BI ... 28
3.1 Shift in usage of BI ... 28
3.2 Objectives of self-serviced BI ... 29
3.3 Drivers for self-serviced BI ... 31
3.4 Inhibitors of self-serviced BI ... 32
3.5 Organizing self-serviced business intelligence ... 33
4 EMPIRICAL RESEARCH ... 37
4.1 Methodology ... 37
4.2 Overview of the case ... 38
4.2.1 The case company ... 38
4.2.2 Analysis of the BI solution at the case company ... 39
4.3 Interview findings ... 43
4.3.1 Interview details ... 43
4.3.2 Acquiring information ... 45
4.3.3 Processing and sharing information ... 46
4.3.4 Monitoring performance ... 47
4.3.5 Ad-hoc needs ... 49
4.3.6 Challenges in acquiring and processing information ... 50
4.3.7 Challenges in data quality ... 51
4.3.8 Having the needed resources to develop reporting ... 52
4.3.9 Perception of self-serviced BI ... 54
4.4 Findings: Possibilities of utilizing self-serviced BI ... 57
4.5 Generalizations and limitations of the research ... 60
REFERENCES ... 64
APPENDIX ... 69
List of figures
Figure 1 BI technical process (Hovi et al. 2009, 86) ... 12Figure 2 The five layers of technical BI architecture (Chaudhuri et al. 2011, 90) .... 14
Figure 3 Typical research problem (Carver & Ritacco 2006, 10) ... 18
Figure 4 Standardized business intelligence architecture (Shartiat & Hightower 2007, 43) 21 Figure 5 Structural framework for business analytics (Acito & Khatri 2014, 566) ... 24
Figure 6 Performance management process (Smith & Goddard 2002, 248) ... 27
Figure 7 Objectives of a self-service BI model (Imhoff & White 2011) ... 29
Figure 8 Self-service certification tier example (Based on Parenteau 2013, 5) ... 36
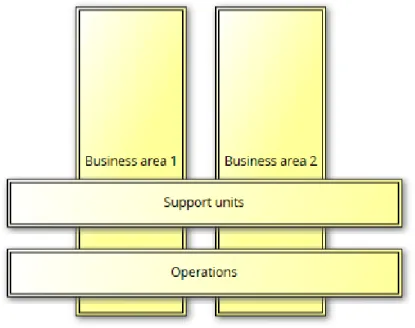
Figure 9 Simplified business structure of the case company ... 38
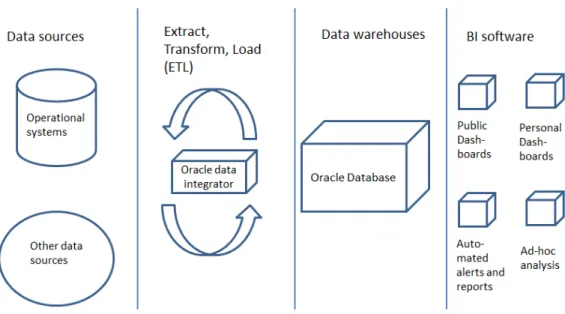
Figure 10 BI structure at the case company ... 40
1
INTRODUCTION
In this global market, businesses are competing in global scale to meet changing customer demands and to provide the best value for potential customers. Effective and timely in-formation for today’s business decision making is not only considered advantageous but essential to survive in the competitive and rapidly changing markets (Lönnqvist & Pirt-timäki, 2006, 32). Today’s enterprises are collecting more detailed data which in turn has increased the amount of business data drastically. Businesses also look to leverage their data assets by introducing modern data analysis and reporting systems to make better, data-based, decisions and to improve performance and to meet customer demands. Most of the businesses today, in fact, have leveraged business intelligence technologies. (Chaudhuri, Dayal & Narasaya 2011, 88.)
Business intelligence can be understood as information processes that include activi-ties driven by the organization’s information needs in the purpose of gaining competitive advantage (Pirttimäki 2007, 92). Business intelligence includes a broad set of applications and technology to gather and store data so business users can access and analyze the data to make better business decisions (Raisinghani 2004, 25).
Traditionally, business intelligence has been designed to support managerial needs. High-level management needed to have an overview of the business and its performance in regards of reaching its strategic goals. Initially business intelligence was considered only as a managerial tool, it was developed from managerial information systems, exec-utive information systems and decision support systems with the goal of supporting stra-tegic level decisions (Arnott & Pervan 2005; Bara et al. 2009.) Nowadays businesses management often measures business performance through a set of performance indica-tors (Bose 2006, 50) with the goal of understanding where it needs to improve to meet its strategic goals. Business performance management (BPM) has been the focus of many BI researches. BPM is way of management controlling and leading the company with the right initiatives to meet its strategic goals by monitoring, analyzing and acting on the results. (Gaiss 1998; Ballard et al. 2005; Quinn 2010.)
On the other hand, the decision making field has moved to ever quicker pace. Increased competition and rapidly changing environments have caused business users not to be sat-isfied with scheduled analytical reports, defined key performance indicators and pre-defined report dashboards. Business users demand ad hoc type queries to be answered quickly with actionable information. The information has to be accessible by the right people and at the right time. (Azvine et al. 2006, 26.)
The recent shift in the business intelligence market has been from highly governed and centralized, IT-authored reporting towards a decentralized BI model empowering busi-ness users with self-serviced analytical and data discovery capabilities (Sallam et al., 2015). According to a TDWI (The Data Warehousing Institute) research by Imhoff &
White (2011) 78% of the questionnaires responded that in their businesses there is a need for faster time value from BI solutions. Software companies and major industry research companies such as Gartner and TDWI have focused much of their recent research in BI are on self-serviced BI and data discovery capabilities. According to Gartner’s prediction (Parenteau et al. 2014) by 2017 most business users and analysts in organizations will have access to self-serviced BI tools to prepare data for self-analysis. Already businesses are focusing their BI investments into decentralized, self-serviced analytical tools with the intention to expand the scope of BI within organizations to broader range of consum-ers and non-traditional BI usconsum-ers (Sallam et al. 2015).
Young workers who have grown up with computers and the use of internet are used to finding answers quickly and easily using search tools such as Google. Their expectation of being able to gather needed information differs drastically compared to more old-fash-ioned workers. They are also used to communicating and collaborating together through different technologies, such as social media. Businesses need to provide the capabilities to easily access information without delays and sharing and enhancing together that in-formation within the company. BI tools and governance models focused on self-service try to provide such capabilities. It is also important to understand that, even though soft-ware companies offer products for self-service or discovery capabilities, it is more of an organizational change in regards of business intelligence. (Imhoff & White 2011, 31.) Academic research, however, on self-serviced business intelligence is almost totally ab-sent. During literature review the researcher was unable to find relevant studies on self-service BI model through the most common search tools and databases. As the shift in the BI market has recently been towards BI self-serviced industry (Sallam et al., 2015) it is important to gain understanding on how self-serviced BI could help businesses in terms of decision making and what possibilities and challenges may self-serviced BI bring. There is a clear research gap for self-serviced BI in the academic literature; hence it has been taken as a focus research problem for this thesis. The subject is approached with a case company study where the company has a business intelligence tools in use but works in mostly centralized manner. The goal of the case study is to gain understanding how the business users find information, how they use business intelligence and what the chal-lenges in those are. Business users are also inquired on their opinion on de-centralized self-service BI model.
Self-serviced business intelligence aims to empower a bigger user base to use business intelligence tools to analyze and generate insights from business data. The basic factors enabling it are for example very easy to use BI tools, ability to access and choose source data more freely, such as including user’s own spreadsheets, and making data warehouse solution easy to deploy and manage. The fundamental goal is to make information pro-duction and consuming as easy as possible for the end-users so businesses can use BI more for their daily information needs without the need of a centralized IT or BI team
expertise. Usually businesses are driven to self-service BI because centralized team is causing a bottleneck in producing information. Business needs change constantly and so do the information needs. The self-serviced BI initiatives are challenged by users’ lack of skills related to BI or difficulty in understanding the data. (Imhoff & White 2011.)
This study shows that business users often require information to support their deci-sions but getting information may be laborious and difficult. Business intelligence is a set of tools trying to get information out of vast amounts of data (Sharthi & Hightower 2007). Business intelligence, however, has often been taken into use for higher level manage-ment to measure its business performance (Bara et al. 2009, 100). This study suggests that business intelligence could be also used to help all business users to address their information needs by having information in one place and enabling easy and understand-able access to businesses data to all decision makers. Enabling self-service BI may enunderstand-able fast and easy access to information and therefore enable faster decision making, however, businesses intelligence has to present the data in an understandable format so it can be easily understood by average business users. Benefits of self-service should not be taken for granted. Misunderstanding data can cause false conclusions which may become costly. Businesses must design their BI systems to be easy-to-use and have easily under-standable data, which will require a lot of groundwork for BI system before self-service can be enabled.
This study’s research goal is to understand how enabling self-service could help busi-nesses meet their information needs.
• Research objective: Can self-serviced BI help businesses to meet their
infor-mation needs?
To answer the research question we try to understand what businesses use BI for and what the challenges in acquiring business information are. This brings us to how self-service BI model tries to resolve those challenges and what drives businesses to enable self-service. Our research questions are the following:
• RQ1: Why do companies use business intelligence? • RQ2: What are self-serviced BI objectives and drivers?
• RQ3: What are the business information challenges at the case company?
Research questions one and two are answered in both the literature review as well as the empirical study. Research question three is answered in the empirical study to try understanding what challenges the case company faces and how self-service BI could help resolve those challenges.
2
BUSINESS INTELLIGENCE
The literature review is focused on Business Intelligence (BI) research area which is a follow up term to decision support systems, executive information systems and manage-ment information systems (Thomsen 2003, 21). The purpose of this chapter is to review how academic research views the BI concept. How traditional BI has been understood and where business intelligence is going. One of the goals is to understand what the tra-ditional BI offers to companies and how it has been utilized to enhance business perfor-mance. Secondly new concepts to BI are being discussed and how those further help busi-nesses to generate information at the right time and place. In order to make decision mak-ing even faster and at the point of decision, while keepmak-ing up with the quality of infor-mation and decisions.
2.1
Overview of Business Intelligence
2.1.1 The concept of BI then and now
Today’s enterprises collect more detailed data, which therefore comes in even bigger data volumes. Businesses look to leverage their data assets by introducing modern data anal-ysis and reporting systems to make better, data-based, decisions and to improve their of-fering to their customers. Most of the businesses today have leveraged business intelli-gence technologies. (Chaudhuri et al. 2011, 88.)
The Business Intelligence concept has its roots in the history of DSS (Decision Support Systems) and has been evolving throughout time. More and more concepts are introduced under the business intelligence area. Here we briefly go through the history of DSS area to better understand how the BI concept has evolved. One of the goals of this study is to analyze and discuss how the BI concept is evolving currently.
In the 1960s database management systems (DBMS) became used by businesses to run operations and record transactions. Later in the 1970s DSS was introduced with the goal of providing data-based decision making support. The 1980s introduced Executive Information Systems (EIS) with goal of providing executives with information within their organization. Also tools like OnLine Analytical Processing (OLAP) and Data Ware-houses (DW) were introduced in 1980s. The purpose of OLAP was to query and summa-rize information. Data Warehouses on the other hand were meant to combine data from different sources. These technology concepts and goals are the foundation of current BI structure. (Shariat & Hightower 2007, 40-41.)
Business intelligence has been built originally to serve as an executive-level manage-rial tool (Arnott & Pervan 2005, 71). The main characteristics of BI have been tradition-ally understood as (Bara et al. 2009, 100):
• representing information to high-level management
• setting strategic goals • strategic planning
• setting KPIs (Key Performance Indicators) for measurement of business
perfor-mance.
Executives have had the need to have an overview of business performance. BI has been developed to meet that need so that companies have the capability to react and make decisions accordingly so they can meet the strategic goals they have set.
The traditional business intelligence model is lacking in terms of providing infor-mation available to all levels of business decision makers at the right time and place. In the modern era of globalization companies around the world compete with each other, hence businesses must be even quicker to react to changing environment and new cus-tomer needs. Scheduled analytic reports, pre-configured key performance indicators (KPI) or fixed dashboards no longer satisfy the business decision maker’s needs. Busi-nesses require quick access to ad-hoc type queries and information they can act on from analytical applications with real-time business data and they need the information to be available to the right people and at the right time. Business intelligence as a concept tries to address this problem. However, the traditional BI solutions with pre-defined data ware-houses or pre-defined reporting often fall short of this goal. These solutions often do not have real-time data and also do not allow user to choose data sources that they need to analyze and generate the information needed for the business decision at hand. Also these solutions often require experts to analyze and generate reports for business users. This causes a time gap between the business user’s initial information need and having the report available. (Azvine, Nauck & Majeed 2006, 26.)
The importance of having information and analytic capabilities available at all times and at the point of decision is also emphasized by Karbhari (2006, 1). He points out that today’s enterprise needs require business decision makers to make decisions in real-time by sorting through increasing volumes of information quickly while not losing opera-tional efficiency. A few years ago users would be satisfied in waiting periods of time to have their information needs fulfilled, but today they require the ability to have their own intelligence dashboards, control their embedded analytics and generate their own reports through a standard web browser interface. To overcome the fast-paced changes in infor-mation needs some companies are moving towards self-serviced BI capabilities. Self-serviced BI is reviewed in chapter 3 of this study.
2.1.2 Definitions of BI
According to Arnott & Pervan (2005, 71) Business Intelligence is poorly defined through-out the industry. Software companies and consultancies try to define BI so that it supports their own products and needs. Database vendors define BI as extraction of data from dif-ferent systems to integrate the data and to transform it. Analytical vendors, on the other hand, focus on statistical analysis and data mining or discovery (Azvine et al. 2006, 26) Popovič, Tomaž & Jaklič (2010, 7) point out that on the scientific research field the busi-ness intelligence terms are broadly defined as well. The definition of BI in a given study determines the scope and approach to the given subject. Hence it is important to review different BI definitions and decide the scope and approach that is taken in this study.
The term “Business Intelligence” was first introduced by Gartner Group, a major con-sultancy company within the IT industry. According to Sharthi & Hightower (2007) Gart-ner Group in 1996 first stated that BI is a set of tools which includes Data analysis, re-porting and query tools that help businesses to synthesize valuable information from a sea of data. The technology approach to BI is also taken by Raisinghani (2004, 25): “Business intelligence (BI) is a broad category of applications and technologies for gathering, stor-ing, analyzing and proving access to data to help enterprise users make better business decisions”. Negash (2004) defines BI as systems that combine data gathering, storage and knowledge management with analytical tools so planners and decision makers can re-trieve and present internal and competitive information from the data.
Negash & Gray (2008, 175) further argue that competitive intelligence (CI), the anal-ysis and monitoring of competitors and competitive environment, is part of the BI concept as a subset. However, according to Hovi, Hervonen & Koistinen (2009, 79) international market analyzing companies such as Gartner and IDC have usually considered BI only in relation with internal information management. Using internal data organizations try to understand what and how they are doing in order to develop their business. This excludes externally available information and CI.
The general approach seems to understand BI as a technology which combines data from different sources and includes the tools to analyze it and generate information to support decision making. However, some researchers take this concept further from the technology aspect.
English (2005) wants to point out that the focus should not be on the tools and tech-nology. BI is about understanding what is happening inside and outside of the organiza-tion. English states that there is no intelligence without the human factor of BI. A human will interpret the meaning and significance of the data to generate information and intel-ligence for the business.
Pirttimäki (2007, 92) concludes BI as an information process including systematic ac-tivities that are driven by the organization’s information needs and the goal of gaining
competitive advantage. She also highlights BI as a managerial philosophy or tool and that the technology aspect of BI is only the enabler of generating information that can be used for the company to gain competitive advantage. Also Azvine et al. (2006, 27) see that BI is a process where one of the most valuable assets of a company, data, is captured, ac-cessed, understood, analyzed and turned into information in order to improve business performance.
Sharma & Dijaw (2011, 114) define BI as a set of processes, both dynamic and con-tinuous, where individuals, groups or even organizational structures continuously try to view their businesses’ health status. According to this, organizations try to understand how they are performing in each area so they can make information-based decisions to improve in each area or business function to keep up with the competition or even gain competitive advantages. In fact, EPM (Enterprise Performance Management) system for BI is seen as a must have for an organization who wants to monitor its business activities’ performance. Such systems would generally include setting up metrics such as KPIs in order to measure the performance of each process or activity (Bose 2006, 51). Also Arnott & Pervan (2005, 71) highlight the managerial approach of BI and define BI as a model and data oriented decision support system that focuses on management reporting. In other words BI is an Executive Information System (EIS) which purpose is to serve and support high-level management’s decision making.
Some of the later academic research makes a small distinction between business intel-ligence and business analytics (BA). Generally BA can be treated as a subset of BI. Wil-liams (2014) summarizes BI as an umbrella term that includes provision of relevant re-ports, scorecards, dashboards, e-mail alerts, pre-structured user-specified queries, ad hoc query capabilities, statistical analyzes, forecasts, models and simulations. He further spec-ifies business analytics (BA) as BI subset which includes statistical analyzes forecasts models and simulations. Also Davenport & Harris (2007, 7-8) define analytics as a subset of BI which includes statistical and quantitative data analysis, explanatory and predictive models and fact-based management to drive decisions and actions. They see analytics as either input to human decisions or even as driver to automated decisions. Analytics try to understand why is something happening, what happens if it continues and what will hap-pen next. Business analytics seems to be understood as a subset of business intelligence concept, where historical data is analyzed to predict the future.
To conclude business intelligence definitions, it can be seen as a process where busi-ness data from internal or external sources is transformed with the help of BI technology into relevant information to support business decisions.
2.1.3 Technical BI architecture
In this section the technical architecture of business intelligence is reviewed. Firstly the traditional data warehouse structure is introduced and secondly new technological com-ponents as part of the technical BI process are reviewed. New technological advantages have been introduced to technical BI architecture for it to better meet the demands of today’s businesses. As information and analytical capabilities are needed at all times with real-time data and at the point of decision making, there should not be any delays in data and analytics availability (Karbhari 2006, 1).
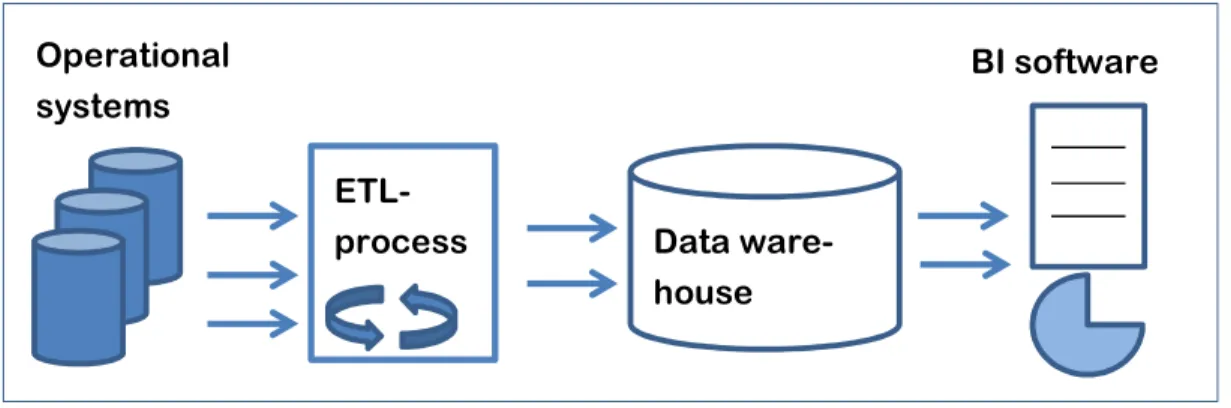
The basic architecture is defined by Hovi et al. (2009, 86) as a technical process con-sisting of four different parts (Figure 1). This approach to BI is a more of the traditional model, which has later on expanded with more capabilities.
Figure 1 BI technical process (Hovi et al. 2009, 86)
The first part consists of operative systems and databases. These usually include ERP (Enterprise Resource Planning), CRM (Customer Relationship Management) and other operational systems. The operative systems have traditionally been the main data sources of a business intelligence solution, however as a concept is not limited to operative data-bases. (Hovi et al. 2009, 86.) The data in the operative systems is highly structured and repetitive (Shariat & Hightower 2007, 44). In terms of BI this would mean that businesses can monitor and measure the repetitive and structured data to be able to identify changes in business processes and performance in different functions usually though a set of KPIs (Bose 2006, 50–51).
Second part of the process is typically called the ETL-process (Extract-Transform-Load). The purpose of this process is to retrieve data from multiple operative systems and transform it into one, unified format (Hovi et al. 2009, 86). Companies may have multiple versions of the same information, like a customer record, in multiple databases. Hence the ETL process is needed to format, combine and aggregate the data. ETL often also includes data cleanse, so only relevant data is transformed forward so it can be better
ETL-process Data ware-house Operational
systems
understood and analyzed. Data warehouse vendors often offer ETL middleware custom-ized for specific environments or industries. (Shariat & Hightower, 2007, 44.) Jordan & Ellen (2006, 17–18) also emphasize the importance of common understanding of data. A common format of data helps businesses to understand the same things in the same man-ner and make decisions according information geman-nerated from the same data. If business users come to different conclusions because they are looking at different view of the same data they might not trust the data quality anymore, in which case the business intelligence program loses value in the eyes of decision makers.
Third part of the structure is called data warehouse (DW). Data warehouse is the place where the information is gathered and stored by the ETL-process. Data warehouse can include data which has been unified and cleansed by the ETL-process as well as data which has been calculated or consolidated during the ETL-process. Pre-calculated and summarized data is often structured so that it is easier for the users to understand and analyze the data. (Hovi et al. 2009, 68.)
The last layer of the process includes the actual BI-tools that the business users use. In this layer the methods and interfaces, which the user is able to use to analyze the data, are defined. Typically this part includes pre-defined reports and dashboards, ability to do new queries, making use of multidimensional analyzes and having a look at pre-calculated metrics through scorecards. (Hovi et al. 2009, 68.)
According to Hovi et al. (2009, 6–7) the benefits of data warehousing are many. Firstly business could rely on operative system reporting. Operative systems often include stand-ardized reporting, but those are often generalized and might not meet the need of the business. Generating new reports directly for operative systems is seen difficult as it re-quires in-depth knowledge of the usually very complex database structure. The design of such reports often needs to be outsourced to an external partner, which can be costly and time consuming. Combining data from multiple source systems also is not possible in such a case. Some companies, usually smaller, rely on spreadsheet reporting where data is manually added or data files from multiple systems are combined. Such work includes a lot of human work and is prone to human errors. Excel-based reporting systems often also include custom-coded and complex macros which often are only understood by the designer, hence it proposes a risk for the business if the expert is not available or leaves the company. The benefits of data warehouse as part of BI program are listed below (Hovi et al. 2009, 15–16):
• Integration of data from multiple sources into one, unified and understandable
format. Function level view of same data, such a customer, is unified into one whole business level view
• Data warehouse is independent of business processes and less dependent on
• Data can be pre-calculated and structured so that business users can understand
the data more easily. More easily understandable data allows faster interpreting of data into information as well as allows business users to analyze it themselves without the need of experts in database structures.
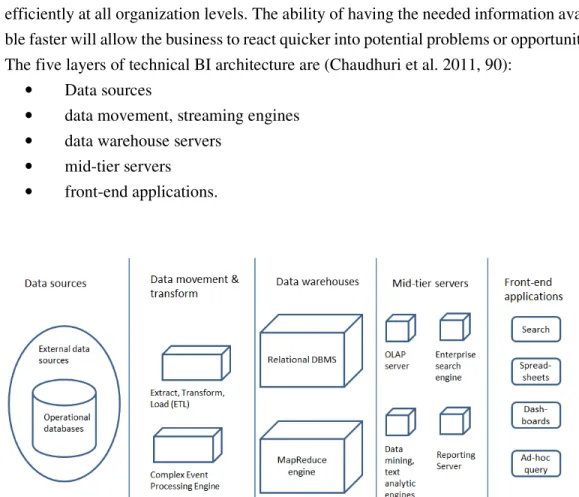
Chaudhuri et al. (2011, 90) view the BI technical architecture as five different parts (Fig-ure 2), and introduces how new technological advantages are being implemented into the existing parts to better serve the today’s businesses information needs. There is an in-creasing need for even faster data access and ability to analyze information faster and efficiently at all organization levels. The ability of having the needed information availa-ble faster will allow the business to react quicker into potential proavaila-blems or opportunities. The five layers of technical BI architecture are (Chaudhuri et al. 2011, 90):
• Data sources
• data movement, streaming engines • data warehouse servers
• mid-tier servers • front-end applications.
Figure 2 The five layers of technical BI architecture (Chaudhuri et al. 2011, 90)
Chaudhuri et al (2011, 90) state that there is an increasing need for supporting real-time business intelligence capabilities. New complex event processing (CEP) engines have been introduced to support those needs. Real-time decision support capabilities pro-vide suggestions on how to speed up the information flow from data into decisions seam-lessly (Azvine et al. 2006, 30 ; Sahay & Ranjan, 2008, 34).
Traditional data warehouses are often RDBMS (Relational Database Management Systems) which work by executing complex SQL queries. During the last decades there have been different developments and optimizations to allow analyzing of increased data volumes. More data is being produced and gathered by businesses today and there is a need to analyze that data in a cost-effective and efficient manner; this is often described as the Big Data challenge. New technologies such as MapReduce have been introduced to support those needs in BI environment. These technologies were originally developed for web search environments but nowadays part of some modern BI solutions. (Chaudhuri et al. 2009, 90.) RDBMS can still be seen as effective manner to gather and analyze struc-tured and repetitive data, which often comes from internal data sources. Paraller RDBMS queries help the system to produce the data in a prompt manner. However if data becomes more complex and the variety changes (for example if analyzing text documents such as e-mails or external sources such as social media) MapReduce technologies become more effective (Ebner, Bühnen & Urbach 2014, 3750).
Mid-tier servers provide the technological tools that the BI applications use to retrieve and analyze the needed data from the data warehouse. These tools include traditional OLAP (On-Line Analytical Processing), which serves as analyzing data in a multidimen-sional view of data to enable user to filter, aggregate, drill-down and pivoting of data. Increasingly businesses deal with unstructured data such as text for example e-mails to and from customers, customer product reviews and complaints. New tools such as enter-prise search engines or text analytics have emerged to easily provide the user with rele-vant information, including data in text format. As an example, a customer service repre-sentative could be having a meeting with a customer and he or she would like to have all related information of that customer available fastly. (Chaudhuri et al. 2011, 90.)
In short the basic technological structure consists of data sources, transformation of data, warehousing and front-end user tools. The basic structure overall has remained the same but new technological tools have been introduced to meet the challenges of in-creased volume of data, inin-creased complexity of data and inin-creased variety of data.
2.1.4 Business analytics – new methods
Even though the business intelligence research is quite well established, emerging re-search areas under BI are being introduced. Recently some of focus has been on new business analytics methods that analyze non-structured data and especially data sources outside of the enterprise borders, this is often referred to as Big Data (Baars et al. 2014, 13-14). Chen et al. (2012, 1172-1175) categorize new emerging topics for business intel-ligence & analytics (BI&A) under five critical technical areas. He also points out that these five different analytic areas may utilize similar underlying techniques:
• (Big) data analytics • text analytics • web analytics • network analytics
• mobile analytics.
Data analytics or big data analytics refers to BI technologies that are related to data mining and statistical analysis. This includes data mining algorithms, quantitative ana-lyzes, heuristics and optimization techniques. More recently data analytics area has de-veloped from traditional structured content analysis into big-data-based semi-structured content analysis. While RDBMS-based data can be analyzed repeatedly, semi-structured data may require ad-hoc, one-time data extraction, parsing, processing, indexing and an-alytics using MapReduce or Hadoop environments. (Chen et al. 2012, 1174-1175).
Text analytics refers to methods of analyzing data in textual format such as documents, e-mails, social media content and communications between organizations and customers. A lot of data collected by today’s businesses is in text format. Text analytics can be used for example as a basis of enterprise search systems (a Google like search of enterprise internal data). Text analytics is also used as a question & answer system such as IBM’s Watson or Apple’s Siri. Web or Network analytics focuses on analyzing external data such as social media and websites, often this kind of data is also in text format. Businesses may use such methods to identify business opportunities from social media chatter, the possibilities can be quite limitless. Lastly mobile analytics is similar to the previous ones but focuses on mobile platform analysis such as apps. (Chen et al. 2012, 1174-1178.)
Traditional BI was designed to measure structured data to monitor performance and identify problems (see chapter 2.2). These new tools, however, are analytical methods designed to provide new business supporting insights and analyzing markets, current and potential customers or other business stakeholders. New methodologies may allow busi-nesses become even more analytical in business decision making and even in defining business opportunities and strategies. These methods speak of expanding usage of BI as part of everyday business decision making.
2.2
Business intelligence in use at different organizational levels
2.2.1 The business goals for BI
In chapter 2.2 the academic research on businesses utilizing BI at different organizational levels is reviewed. High-level management might require an overview of what the com-pany is doing, insights on its business performance and insights on changing customer needs. Strategic management tries to look for a longer term viewpoint so they can make strategic business decisions. Then again, the business users at lower management levels or even the individual workers of the company might require different kind of information for their decision making. Certainly, the lower levels of the company hierarchy would need to look at more detailed process levels and analyze the design of those in order to meet the goals of the strategic leadership. At lower managerial levels the scope of intel-ligence is more focused and more has an operational time-frame.
Measuring the effects of business intelligence is important for the businesses. If ex-pensive business intelligence programs do not meet the information needs of the company the whole BI investment becomes very costly for the company. Businesses should, in fact, regularly review of business intelligence meeting the needs of business users. (Hočevar & Jaklič 2010, 97.) Hence, it is important to understand what the information needs at different organizational levels are and analyze if the BI program itself meets those needs or not. Firstly the general goals for BI are reviewed after which literature on business intelligence at different organizational levels is reviewed to gain an understanding on what is the purpose of BI for strategic management as well as how the whole organization and BI is linked to that. Business intelligence is about having the information available to make decisions and to understand what is happening around you within and outside the organization. In section 2.2.2 an example framework, on explaining how BI is used in organizations, is reviewed.
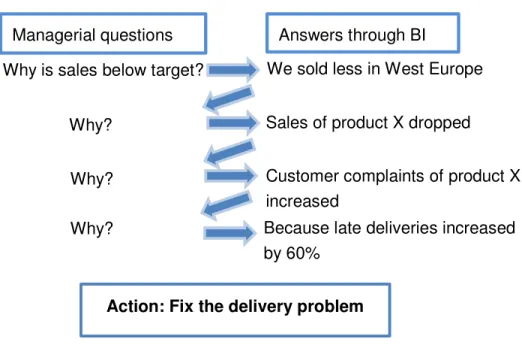
Business intelligence aims to create efficiency and effectiveness to the business organ-ization. Generally basic idea is providing easier and faster access to information of the company. Businesses can identify key success factors that help management to under-stand situations, in fact the one of the main goals of BI is to provide an overview of what is happening and why. (Hočevar & Jaklič 2010, 95.). A general business intelligence case is presented in Figure 3.
Figure 3 Typical research problem (Carver & Ritacco 2006, 10)
At first the strategic management asks the question why sales are below target. Sec-ondly they could go into business intelligence to analyze where the sales have dropped. After noticing sales of a given products dropped in a certain area they ask the middle management to analyze why this was the case. The next organizational level of the com-pany tries to find out what were the reasons behind this by doing analytics in business intelligence tool, they notice that customer complaints increased because the deliveries were late. Lastly the sales management will ask the operations team why the deliveries were late. Operations tries to find out the root causes of late deliveries of a given product to a given market area, after thrilling down and running analytics they might find the underlying cause and take operational actions to fix the cause and avoiding the problem in future. The given example suggests that different levels of the organization need dif-ferent information and need to ask difdif-ferent questions and take difdif-ferent actions to meet the goals of the businesses. Also it emphasizes how business intelligence is required at all levels of the business organization so that the real root causes of the problems can be analyzed and fixed. The ability of drilling down through the initial problem into the final root cause and solution through the whole business organization is one of the key benefi-cial factors of BI (Hočevar & Jaklič 2010, 95-96). Being aware of what happens in the business processes and being able to analyze the problem areas for root causes of prob-lems can benefit the company greatly in different aspects. Example benefits of business intelligence are (Thompson 2006; Carver & Ritacco 2006; Atre & Moss 2003)
• Increasing revenue
Why is sales below target?
Why?
Why? Why?
We sold less in West Europe
Sales of product X dropped
Customer complaints of product X increased
Because late deliveries increased by 60%
Managerial questions Answers through BI
• Improving customer satisfaction • Improving internal communication • Improving decision making
Elbashir, Collier & Davern (2008) emphasize the link between organizational perfor-mance and business process perforperfor-mance. The organizational perforperfor-mance comes from process performance and BI helps the management to understand why organizational per-formance is / is not improving. Management needs to understand which part of the value chain is improving or hindering the organizational performance. Businesses can generate different organizational benefits that thrive from different process-level performance im-provements which can be categorized as following (Elbashir et al. 2008):
• Supplier or partner relations are improved by having more efficient inventory
management with reduced transaction costs and better coordination with suppli-ers and partnsuppli-ers
• Internal process efficiency is improved from increased staff productivity,
re-duced decision making costs and rere-duced operational costs
• Customer intelligence benefits are improved by reduced marketing costs,
re-duced time-to-market from better understanding of customer needs and reduc-tion of cost from unhappy customers. Customer aspect in fact is usually the most relevant improvement aspect from BI. More understanding of customer needs, reacting quicker to raising problems such as delivery problems, the ability to identify common complaint causes or faulty products from customer complaint forms etc. These can help businesses to create more value to their customers in longer term.
To concise, BI can help businesses to serve their customers more effectively by under-standing the internal performance and having the ability to identify and fix problems faster. While at the same time it is not enough for the strategic leadership to notice that deliveries were late and it caused customer dissatisfaction, the operational and middle-management must be able to gather information and gain intelligence so they can react to the operational problems and improve their processes and fix problems.
2.2.2 Ways of using BI
The business justification for a business intelligence investment should be that business intelligence program supports strategic goals of the business. Without a good business justification the management is not as likely to support the program. Business should identify the business drivers, strategic goals and define what the business analysis issues
are. Also business should identify the information needed at strategic level to meet stra-tegic goals and to do strastra-tegic level business decisions. (Atre & Moss 2003, 31.)
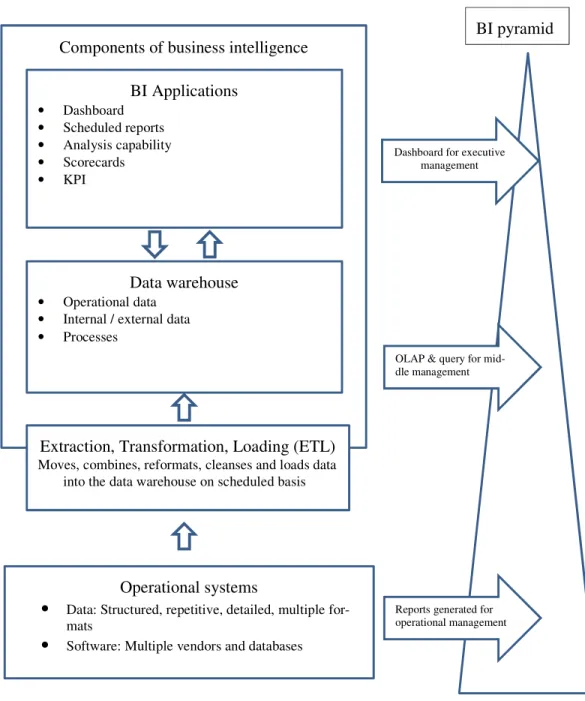
Traditionally business intelligence has been seen as a managerial tool, the BI concept has been developed from managerial information systems (MIS), executive information systems (EIS) and to support strategic decisions (Arnott & Pervan 2005; Bara et al. 2009). The information levels are often visualized as a pyramid. Shartiat & Hightower (2007, 43) proposed a conceptual information architecture on how information and reporting is used at different levels (Figure 4).
At the top of the pyramid executive management has the ability of using pre-made dashboards. Where the manager can see an overview of a given business defined meas-urement, such as sales of last month in Europe. And the ability to drill-down into more detailed levels within the dashboard. For middle-management the model proposes OLAP-based analytical capability as well as ad-hoc-OLAP-based query capabilities. Operational man-agement uses pre-defined and standardized reports to do daily tasks. (Shartiat &
High-BI pyramid
OLAP & query for mid-dle management Dashboard for executive
management
Reports generated for operational management
Components of business intelligence BI Applications • Dashboard • Scheduled reports • Analysis capability • Scorecards • KPI Data warehouse • Operational data
• Internal / external data • Processes
Extraction, Transformation, Loading (ETL) Moves, combines, reformats, cleanses and loads data
into the data warehouse on scheduled basis
Operational systems
• Data: Structured, repetitive, detailed, multiple for-mats
• Software: Multiple vendors and databases
tower 2007, 43-44.) It could be argued that the model is based on the high-level manage-rial approach to BI. According to the model, the operational management has to rely on pre-defined reports to run daily operations without the ability of ad-hoc-based analysis and investigations. The problem of relying on pre-defined reports raises a problem when information is needed that is not yet provided by pre-made reports. Generally, operative reports are run straight from operational systems or databases. Azvine et al. (2006, 26) argues that they also require an expert to develop such reports and the process of gener-ating a new report is often time consuming. Such an approach from operational user per-spective is time consuming and non-adaptive, hence it is important to understand how those needs can be taken care of as part of the business intelligence solution in a given environment.
Further research also speaks of the problem of relying on pre-defined reporting. Karlöf (2002, 225) mentions that as business environments are ever more dynamic so are the information needs for the decision making. In a case where a person is not able to gather all the needed information there will be an information gap between the available infor-mation and inforinfor-mation needed. Vitt, Luckevich, Misner (2002, 15, 29) call this gap the analysis-gap, the idea is that decisions makers have loads of different information avail-able but struggle having the needed information availavail-able. The business problem is how it can provide the right information available for each employee. In case when pre-defined reporting will not fulfill that need, should the user be able to do data-based analyses on its own to fulfill the information need? This point is further discussed in the chapter 3 of the literature review.
A business works from day to day executing the strategy set by the top management. The alignment of the whole business and the way of working with desired ways and strategy is important for a business to succeed. Top management will seek to execute its strategy with different desirable behaviors using business performance management together with analytical task and capabilities (Acito & Khatri 2014, 566).
The concept of business performance management (BPM), corporate performance management (CPM) or enterprise performance management (EPM) has been studied by many researchers and many business intelligence vendors offer frameworks and software to support them. Those concepts are important part of understanding how businesses use BI for business management. According to Ballard et al. (2005, 13) BPM is a process that enables alignment of business goal business measurements. In general BPM is viewed as a continuous process where a business (Gaiss 1998; Ballard et al. 2005; Quinn 2010)
1. monitors its performance 2. analyze problems and solutions 3. acts accordingly.
To measure performance a company can identify a set of Key Performance Indicators (KPI) with the goal of measuring financial or non-financial key measurement that best
can monitor on how business is executing the strategy in a given area, hence the meas-urement must be derived and aligned with the business strategy (Bose 2006, 50). KPIs should be quantifiable measures, often agreed beforehand, and should reflect the critical factors of the organization. KPIs must be based on organizational goals derived from the business strategy, hence also KPIs often differ between organizations. KPIs are usually set for a long term and generally change as the strategy is changed. The KPIs are usually measured using a business intelligence technology and are often included in an executive BI dashboard with the capability of drilling down further into the metrics to find cause and effect links. (Bose 2006, 50.)
Gaiss (1998, 45-46) emphasizes how a business will continuously have to do opera-tional analysis to optimize its operations and to identify causes and solutions to underly-ing issues identified by the KPI measurunderly-ing. This also further speaks for enablunderly-ing and sharing the measurement view to the whole organization. As well as enabling the analyt-ical capabilities through the organization so all the organization parts can optimize work, identify issues and develop better and new ways of doing things.
Quinn (2010, 9) underline that in order to realize performance management benefits a business has to use BI to communicate and monitor strategic business performance at all organizational levels in a cycle of continuous improvement linking strategic, analytical and operational initiatives. The goal is to keep each individual informed on how the busi-ness is progressing on meeting specific strategic goals. If busibusi-ness performance is lacking, it can be identified by using the analytical capabilities of BI to detect problems and to find cause and effect. Then business can set operational initiatives to design solutions to those problems.
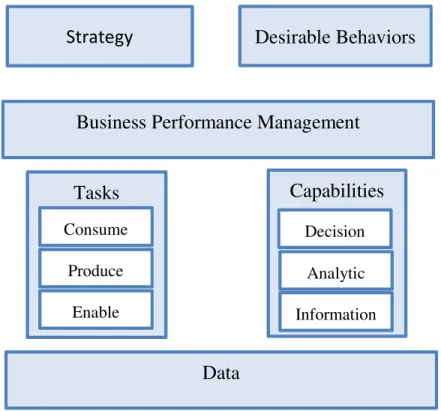
Acito & Khatri (2014, 566-567) have developed a framework of deriving value from business analytics in conjunction with business performance management (Figure 5).
Figure 5 Structural framework for business analytics (Acito & Khatri 2014, 566)
Strategy refers to the business strategy, working as a basis context and justification for the analytics program of the business. Analytical capabilities should be designed based on the business strategy. Desirable behaviors refers to the beliefs and organization culture that is included in the mission statement, values, rituals and organization structure. Davenport et al. (2001, 125) point out that according to their study cultural factors are the biggest barrier in getting returns out of the BI investments. Enabling data-based analytical capabilities and data-based decision making culture in the organization is important for the analytical capability investments to succeed (Davenport et al. 2001, 127).
Business performance management tries to understand how business can be measured and what factors can include those measurements. Analytical capabilities can be seen as a close tie to BPM as businesses often invest in BI to be able to measure their performance and have a better overview of the business processes and functions’ performance. In this given framework it could be seen as a link between the technical analytical capabilities as well as the human analytical tasks and the business strategy and desired behaviors. Businesses have strategies and desired missions and values that they try to follow. BPM helps the business to measure how well it is executing those goals. Then again users can use analytical capabilities to further understand which factors affect the capability of ex-ecuting the strategy as best as possible.
Strategy
Business Performance Management
Tasks
Data
Desirable Behaviors
Consume Produce EnableCapabilities
Decision Analytic InformationAccording to Chandler et al. (2011) analytically engaged employees can perform three potential tasks
1. consume insights generated by others 2. produce insights from data
3. enable creation of insights.
These tasks orient from Gartner’s business analytics framework (Chandler et al. 2011) which have been implemented to this framework by Acito & Khratri. Consuming intelli-gence means utilizing analytics for decision making purposes and producing intelliintelli-gence refers to defining and doing analysis. Enable refers to all technologies and cultural factors that enable users to go and produce information out of the data using different BI related tools. The focus of the framework is on tasks that users can take instead of specific or-ganizational roles. (Chandler et al. 2011; Acito & Khatri 2014.)
Chandler et al. (2011, 7) also introduce the multi-task role called prosumer which means an analytically enabled person can have all the three roles. A person could consume information from others, produce information out of that. The business intelligence trend and new capabilities are more and more enabling the self-serviced way of doing analytics. The more a business enables users to do self-serviced analytics and act as prosumers the more insights a company can produce and even further develop the BPM metrics of the business. This will also further enable a business culture of data-based decision making and utilization of BI technologies. Enabling data-based insights within decision making processes will benefit the company with making fact-based choices which would result in better decisions in a long run. (Chandler et al. 2011, 7-10.)
The three capabilities are supported by different BI technologies. Decision capabilities are tools, for example pre-defined dashboards and reports. These tools support delivering of information for decision making purposes by enabling sharing of information and mak-ing data easier to understand through visualization. Analytical capabilities refer to tools as well as methods that business uses to do predicative analyzes, statistics, ad-hoc queries, simulations and optimizations. Information capabilities are technologies that organize, aggregate, describe, and most importantly, share data to the organization at the right time and at the right place for business users to make information-based decisions. (Acito & Khatri 2014, 567.)
The framework helps to understand how business data acts as part of enterprise man-agement where the business tries to execute its strategy with the desired values and meth-ods. Business users and factors enabling business users to produce and consume infor-mation as part of their decision making process helps business to make better, fact-based decisions. Business performance management is a link between the data and the human work of getting information out of that data and strategic management. Business users analyze their processes trying to gain understanding of process performance, based on the data. This can enable new insights on what factors influence a given performance in a
given functional area. Therefore enabling of business users to analyze data and doing data discovery can enable the business to find out new measures and critical factors that affect the current measurement. This in turn will enable strategic management to consume that information to gain better understanding of its business performance and potential chal-lenges. On the other hand, looking from top to bottom, when a business is executing a strategy and measures how it is doing so it (with BPM) may notice problems and lack of performance within its processes. In such a case it is important for the business to identify in more detail what is causing the problem or lack of performance to fix the problem and to improve its operations. Business users can dwell deeply into the problematic situation using the analytical capabilities of the company to find out the cause of the problem. The challenge businesses face is how they can enable users to analyze data, discover new links and insights and gain better understanding of the data to produce information for them-selves as well as others. (Acito & Khatri 2014 ; Chandler et al. 2011.)
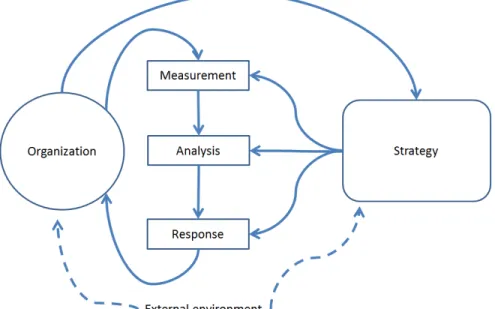
Smith & Goddard (2002, 248) also speak of the continuous development of perfor-mance management. A business will continuously aim to monitor its activities and meas-ure how they are doing in executing the strategy, analyzing the results and responding accordingly. Performance management can be seen as a continuous and looping process. The process is illustrated in figure 6. The process also illustrates the importance of being able to analyze the results and figure out the root causes and figure out ways to improve and respond. A business must also continuously review its performance management con-text. A business, through analysis, can recognize if the environment or customer needs are changing. A business can also find ways of doing things more efficiently or identify new ways of providing value to the customers. This again can give input to change the whole strategy of the company. (Smith & Goddard 2002, 248.)
Figure 6 Performance management process (Smith & Goddard 2002, 248)
Literature review on managing business and its performance highlights the importance of having abilities to conduct processes analysis. In order to identify sudden problematic situations, changing customer needs or changing environment. Hence it can be said that the information and analytical needs of the company can’t be fulfilled truly with pre-defined reporting and operational systems only. Business, throughout, has to be able to do produce and consume the information it has available to provide new insights and to be able to adapt to changing environments and needs. The ability to understand potential problems and reacting quickly to fix potential problems speaks for the importance of en-abling business intelligence capabilities throughout the organization.
While the role of business intelligence as part of the organizational business perfor-mance management has been researched a lot it’s still something that requires further research and is still developed currently. BI tries to offer more and more end-user analyt-ical methods to analyze processes, to further enhance the link between process analytics and performance management. (Baars et al. 2014, 13.)
3
SELF-SERVICE BI
3.1
Shift in usage of BI
The recent shift in the business intelligence market has been from highly governed and centralized, IT-authored reporting towards a decentralized BI model empowering busi-ness users with self-serviced analytical and data discovery capabilities (Sallam et al., 2015). According to a TDWI research (Imhoff & White 2011, 5) 78% of the question-naires responded that in their businesses there is a need for getting value out of BI solu-tions faster. Azvine et al. (2006, 26) also emphasize how business users struggle getting the right information available for their daily decision making purposes, they are depend-ent on IT or other analysts to provide the information they need. Imhoff & White (2011, 5) say that nowadays businesses are trying to find alternative solutions to improve infor-mation easy and fast inforinfor-mation availability. One suggested approach has been to enable users with access to BI reports, queries and analytical capabilities themselves without the need of IT specialist intervention. The approach’s goal is to wider the use of business intelligence to meet more business information needs and problems. Enabling better BI usability and consumability are critical factors of self-serviced BI culture. Kosambia (2008, 20) argues that for a business to gain competitive advantages organizations must find new ways of quick and easy information access. In the information age anyone has the ability with a single Google search to find vast amount of information very easily. However, getting information out of internal business data is far more complex. Busi-nesses should try to enable self-serviced BI environment where minimum intervention from specialists is needed. (Kosambia 2008, 20.)
Academic research has not much addressed the concept of self-serviced business in-telligence, even though it has been a hot, emerging concept within the BI industry and amongst the software companies. During the literature review the researcher was unable to find academic research papers on self-service BI model through the most common and biggest databases and search tools. Much of the self-service review has been taken on by major commercial research businesses. In this section the following subject areas will be covered:
• objectives and drivers for self-serviced BI
• challenges with self-serviced BI • governing of self-serviced BI.
3.2
Objectives of self-serviced BI
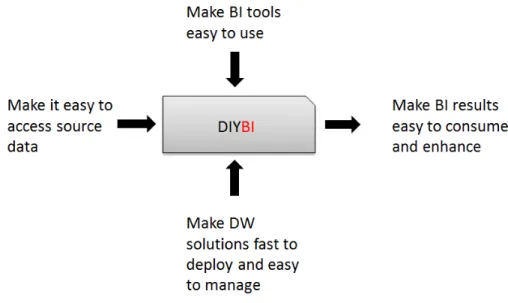
So that business can enable self-serviced BI it has to design the BI so that business users can themselves consume and produce information and enable others to further enhance that information to discover further insights Acito & Khatri (2014, 566). Imhoff & White (2011, 6) describe the self-service BI initiatives critical objectives in figure 7.
Figure 7 Objectives of a self-service BI model (Imhoff & White 2011)
The most critical factor is the ease of use of the BI tool. The tool has to be as user-friendly as possible so even persons not familiar with complex IT systems can produce simple reports and queries and more advanced users can discover and solve more complex problems. Secondly the results have to be easily consumed and enhanced. Information has to be easily understood; generally visualization and presentation are key factors in BI to help understand data and context. Another key element of information management in a business is enhancing the information results further. A self-service BI solution could enable more efficient knowledge management by providing interaction within the tool so people can give more context, comments and feedback on the analysis or reports and hence further enable others to generate further insights. Imhoff & White (2011, 6.)
Recently the variety and volume of business related data has increased (Williams 2014, 10-11) and new emerging analytical tools have emerged to meet those needs (Chen et al. 2012, 1167). Imhoff & White (2011 ,7) point out that self-service BI data warehouses must support agile data warehousing methods to meet all those needs. Software-as-a ser-vice (SaaS), cloud warehousing and analytic DBMSs may offer solution for business to easily implement new technical DW solutions to meet new and changing analytical needs. Kosambia (2008, 21) argues that with self-serviced BI business users should be able to
make text-based search, like in Google, to get the needed results. Analytical tools using the warehouse should be designed so that it hides the complexity of the data warehouse.
Lastly the fourth objective of self-serviced BI is to enable source data access for users. One of the key elements of BI is the ability to combine data from different sources. How-ever, as different users might need different kinds of data to meet their personal data needs this rises a problem of what should and what should not be available in the data ware-house. While data warehouses often include data from company internal sources such as ERP or CRM systems data there are needs to combine small external data sources with systems’ data. Imhoff & White (2011, 7) during their interviews found out that if the data was not accessible then nothing else mattered. While it might be impossible for IT to arrange all the data needs in the ready-made data warehouse. The self-serviced BI solution should allow of combining new data sources with the existing data warehouse, for exam-ple customer product reviews, customer satisfaction results, e-mails and others. Typically new BI tools aimed at self-serviced BI usage allow users to import such data on the go. For BI to be effective, agile and quick a user will not be satisfied with waiting for IT to import the data to the warehouse, also including all the user specific data needs in a com-mon data warehouse could get out of hand quickly.
In the framework by Acito & Khatri, reviewed in chapter 2.2.2, the three business analytical tasks are to produce, consume and enable insights. Self-serviced BI could sup-port those tasks more efficiently versus traditional centralized and IT-led analytics. To conclude this chapter the concept of self-service is linked to the business analytics frame-work to better understand how self-service BI can enhance business analytical capability.
Producing analytics and information is one of the business tasks within the framework. Self-serviced business intelligence supports more production of information by making producing information as easy as possible to allow more users to produce information. Information production process also becomes faster and more agile as the bottleneck of centralized BI team is removed from ad-hoc type information needs and doing analytics.
A business analytical task of consuming information is enhanced as more information is produced. One of the goals is also to be able to present information in a format that is most easily understood. Only by understanding the data and results can information and knowledge be obtained. In terms of information consumption, however, self-service BI can bring a problem in report quality and trustworthiness. The user might not have the necessary understanding of the subject and the data model to produce.
A self-service BI solution in itself is an enabler of information production within an organization. It includes both a technological tool that is designed to be as easy to use as possible and a culture of enabling business users to produce analytical insights on their own. In a self-service BI solution businesses have to design methods of enabling BI to be used without IT intervention. Such methods can be training the usage of the tool, helping
understanding of data, process of validating results and methods of sharing insights within the organization.
3.3
Drivers for self-serviced BI
An important aspect is to understand what drives businesses into adapting self-serviced BI i.e. what are the business reasons of investing into self-service BI. According to the survey results by TDWI study (Imhoff & White 2011, 9) the most substantial drivers were:
• constantly changing business needs (65%)
• IT’s inability of providing reports in timely manner (57%)
• goal of more analytical-driven business (54%) • slow information access (47%).
Imhoff & White (2011, 9) argue that self-service BI helps businesses to meet these challenges. Constantly changing business needs becomes a problem when reports are pre-defined and users to not have the ability of modifying them to suit new needs. As such, they must request a specific person to modify it or provide a new version of it. Addition-ally different users might be willing to see different versions of the same. Self-service BI business needs to build up an infrastructure for self-analysis capability, including data models and pre-made models or templates to build up reports. As business users must wait for others to produce the reports for them, they might be forced to go around the problem by start building up their own analytic solution to get the information. A single unified system available for such is often more cost-efficient than multiple self-built so-lutions in different business units. The need to be an analytic-driven organization drives from the tough global business competition. Decisions made per factual information in-stead of intuition can ensure better results in long term. Enabling users to produce infor-mation on their own for their decisions is the basis of truly analytical-driven organization. (Imhoff & White 2011, 9)
One important driver for self-service BI is to reduce the load on the centralized IT or BI team. According to the survey results by Logi ananalytics (2014, 9) respondents on average reported 37% less requests on IT for BI. It shows that self-service BI model will not be fully self-dependent but instead easier and quick results can be acquired by end-users directly and so the centralized expert team can focus on the more difficult challenges and BI development. Major drivers for self-service initiative identified by Logi Analytics (2014, 7) were:
• business users want to acquire information on their own and on their own time • more analytical organization
Both questionnaires highlight the need that businesses want to be more analytical and want to be more independent in acquiring information. Nowadays business environment is more dynamic and hence the information needs for businesses change more rapidly. Business users are not satisfied with pre-defined reporting and demand more and more frequently new reports, enabling of self-service is a way businesses try to solve that prob-lem.
3.4
Inhibitors of self-serviced BI
According to survey by Imhoff & White (2011, 32) businesses felt the following factors being the biggest inhibitors of successful self-serviced BI culture:
• business user skills (59%)
• lack of data quality and control (55%) • lack of training (39%).
This shows the importance of proper training as well as setting up a culture of sharing knowledge and best analytics practices within the organization. Making BI as easy as possible and enabling it for the user in the end is the only way for business users to de-velop such skills. Centralized BI team should also focus on data governance within the data warehouse, even though less governance is possible in a de-centralized BI environ-ment (see chapter 3.3) some level of control should be kept. Other factors included lack of budget, management support, and confidence in the possibility of self-serviced BI or suitable BI tool.
A survey study on self-service BI adoption has also been conducted by Logi Analytics. According to their report (Logi analytics 2014, 11) business IT teams saw the following factors being the biggest inhibitors:
• limited budget (48%) • business user skills (48%)
• data security and access control (38%).
Other factors were lack of support from IT or management, however, only 23% felt the tools were hard to use.
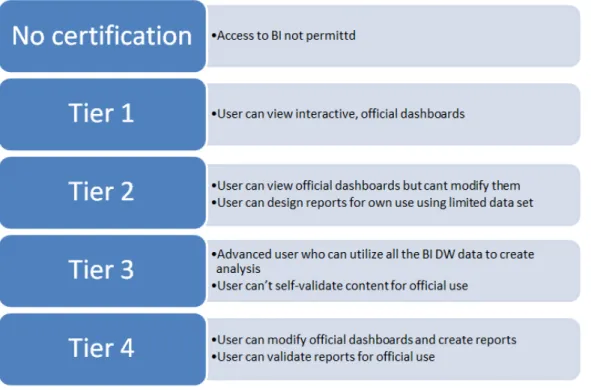
Both studies show that lack of business user skills and training are perhaps the biggest inhibitors of self-serviced BI. Hence, for a self-serviced business intelligence initiative to work, businesses need to focus on training of both the actual tool and especially on the business data. While the tool itself can be made as simple and friendly as possible, it is the business data that can often be so complex and difficult to understand that users can’t build analysis on their own from it. It is also important to realize that any organization going into self-serviced BI cannot expect an adoption overnight but should see it as a learning process moving towards more and more self-serviced capability.