THE DIVIDENDS OF A QUALITY AND
GROWTH FACTOR APPROACH
+ Co-authored by JEREMY SCHWARTZ [ CFA®, WisdomTree Director of Research ]
Warren Buffett’s 2015 annual shareholder letter for Berkshire Hathaway was released on February 28. There is one passage that—more than any other—reveals how Buffett thinks about attractive investment options. In addition to things like large size and having management in place, the following items are of note:
BERKSHIRE HATHAWAY INC. ACQUISITION CRITERIA1
+Demonstrated consistent earning power
+Businesses earning good return on equity2 while employing little or no debt
The key phrase is “businesses earning good returns on equity while employing little or no debt.”
WisdomTree offers a series of Indexes—our “Quality Dividend Growth” family—that employ this “Buffett factor” of return on equity (ROE) and return on assets (ROA)3 as a driving force for stock selection. The reason
WisdomTree included ROA in powering stock selection is that it penalizes the use of debt (leverage4) in delivering
ROE; therefore, the resulting list of companies that qualify for our Indexes tend to also employ little debt.
GETTING DIVERSIFIED EXPOSURE THAT PASSES BUFFETT’S ROE RULE
Warren Buffett is always going to be a master stock picker, and he is able to get special acquisitions due to the terms he can offer. For the rest of us, getting diversified exposure to stocks that have those characteristics via an index-based strategy can be compelling. The WisdomTree Quality Dividend Growth Indexes are built with this framework in mind.
In this paper, we review the literature and proponents of quality investing before going into greater detail on WisdomTree’s approach.
IDEA OF QUALITY INVESTING HAS A LONG HISTORY
While Buffett’s record is certainly impressive, his teacher, Benjamin Graham, who is known as one of the fathers of value investing, also had a rigorous focus on quality traits. Many focus on Graham’s criteria for finding inexpensive companies, but looking at his list of seven purchase criteria, he was at least equally focused on attributes of quality, if not more so.
1 Source: Berkshire Hathaway annual letter to shareholders from Warren E. Buffett, 2/28/15.
2 Return on equity (ROE): Measures a corporation’s profitability by revealing how much profit a company generates with the money
shareholders have invested.
3 Return on assets (ROA): Firm profits (after accounting for all expenses) divided by the firm’s total assets. Higher numbers indicate greater
profits relative to the level of assets utilized to generate them.
4 Leverage: Total assets divided by equity. Higher numbers indicate greater borrowing to finance asset purchases; leverage can tend to make
BENJAMIN GRAHAM’S ATTRIBUTES OF QUALITY5
+“Adequate” enterprise size, as insulation against the “vicissitudes” of the economy
+Strong financial condition, measured by current ratios6 that exceed 2 and net current assets7 that exceed
long-term debt8
+Earnings stability, measured by 10 consecutive years of positive earnings
+A dividend record of uninterrupted payments for at least 20 years
+Earnings-per-share growth of at least one-third over the last 10 years
A full five of the seven points could be said to focus more on quality than on valuation9, with the final two points
indicating that, given that these criteria were met, one should not see either a price-to-earnings (P/E) ratio10 or
price-to-book11 (P/B) ratio too high in order to access them. GRANTHAM’S ATTRIBUTES OF QUALITY
One of the long-standing investment practitioners of quality investing has been Jeremy Grantham’s firm, GMO. In a paper written in 2004,12 GMO wrote of quality firms:
...even though many of these corporations tend to generate high profits year after year, they are systematically underpriced because they lack volatility13. Instead of overpaying for these companies, as
finance theory would suggest—given their low risk profile—shareholders in fact do just the opposite: they underpay. The result is that investors in high-quality companies get to forge ahead with 15+% returns year after year without overpaying. Of course, in any given year, low-quality stocks can and do stage rallies and high-quality stocks can underperform. But the high-quality stocks have always won over longer holding periods. No matter what metric is used to identify quality stocks—leverage, profitability, earnings volatility or beta14—high-quality stocks have beaten out low-quality stocks.
5 Source: Benjamin Graham, “The Intelligent Investor” (4th revised edition), Harper & Row, 1973.
6 Current ratio: Measures whether or not a firm has enough resources to pay its debts over the next 12 months, with higher values indicating
a greater potential for future debt payment capability.
7 Net current assets: Also known as working capital, helps to gauge a company’s short-term financial health by measuring liquid assets, like
cash and short-term investments, against liabilities coming due over the next 12 months.
8 Long-term debt: Debt with maturity greater than one year.
9 Valuation: Refers to metrics that relate financial statistics for equities to their price levels to determine if certain attributes, such as earnings
or dividends, are cheap or expensive.
10 Price-to-earnings (P/E) ratio: Share price divided by earnings per share. Lower numbers indicate an ability to access greater amounts of
earnings per dollar invested.
11 Price-to-book ratio: Share price divided by book value per share. Lower numbers indicate an ability to access greater amounts of earnings
per dollar invested.
12 “The Case for Quality—The Danger of Junk,” GMO white paper, 3/04.
13 Volatility: A measure of the dispersion of actual returns around a particular average level.
14 Beta: Measure of the volatility of an index or investment relative to a benchmark. A reading of 1.00 indicates that the investment has moved
More recent academic research has also supported these practitioner ideas. Robert Novy-Marx wrote “The Other Side of Value: The Gross Profitability Premium” in June 2012. In that paper, he wrote:15
Profitability, as measured by the ratio of a firm’s gross profits (revenues minus cost of goods sold16) to its
assets, has roughly the same power as book-to-market predicting the cross-section of average returns. … Strategies based on gross profitability generate value-like average excess returns, even though they are growth strategies that provide an excellent hedge for value. The two strategies share much in common philosophically, however, despite being highly dissimilar in both characteristics and covariances17. …
Because the value and profitability strategies’ returns are negatively correlated, the two strategies work extremely well together. In fact, a value investor can capture the full profitability premium without taking on any additional risk.
FAMA-FRENCH OPERATING PROFITABILITY FACTOR
Research done by Kenneth French and Eugene Fama arrives at a similar place. In their draft of “A Five-Factor Asset Pricing Model” from September 2014, they cite operating profitability, defined as annual revenues minus cost of goods sold, interest expense18 and SG&A19, all divided by book value of equity20. Note, this is similar to
Buffett’s criteria in the opening of the piece: a company earning a good return (profits) on its equity (book value)— in other words, a high ROE.
Arranging the U.S. market into quintiles based on operating profitability further emphasizes that high-quality stocks have won over longer holding periods.
15 Robert Novy-Marx, “The Other Side of Value: The Gross Profitability Premium,” 6/12.
16 Cost of goods sold: This amount includes the cost of the materials used in creating the good along with the direct labor costs used to
produce the good.
17 Covariance: Measure of how two or more variables move in relation to one another, with positive values indicating general movement in a
similar direction and negative values indicating general movement in an opposite direction.
18 Interest expense: Expense incurred due to taking on debt.
19 SG&A: Specifically, selling, general and administrative expenses; in other words, the costs related to running a company’s day-to-day
operation.
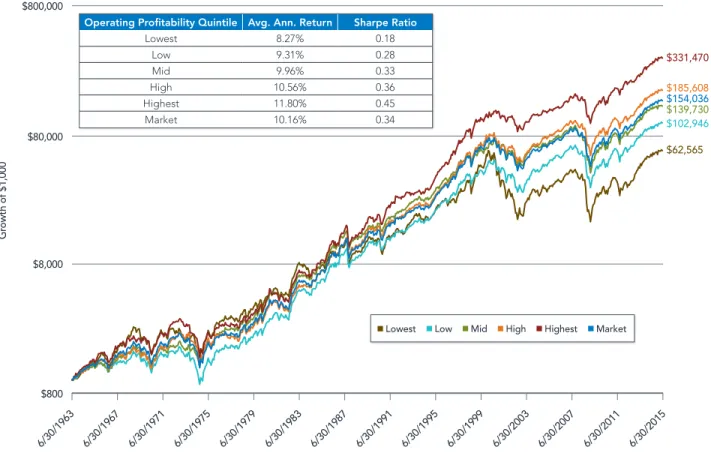
FIGURE 1: HIGHER OPERATING PROFITABILITY HAS OUTPACED LOWER OPERATING PROFITABILITY
Source: Kenneth French Data Library, with data as of 6/30/2015. Period based on availability of operating profitability returns sorted into quintiles, which begins 6/30/1963. Past performance is not indicative of future results. You cannot invest directly in an index.
+The market delivered 10.16% average annual returns, leading to a Sharpe ratio of 0.34. Only two quintiles bested this figure—the two highest—and they won on the basis of both average annual return and Sharpe ratio.
HOW ARE RETURNS BEING ACHIEVED?
One important aspect of the outperformance of the highest quintile based on operating profitability is how this quintile is not all driven by its sensitivity to the “value” factor. We use the original Fama-French three-factor model to show the factor loading to the value factor.
The highest-quality basket actually had a negative loading on the value factor—which suggests it was more of a growth portfolio and also was a headwind, given that value strategies outperformed growth over this period.
$331,470 $185,608 $154,036 $139,730 $62,565 $102,946 $800,000 $80,000 $8,000 $800 Gr owth of $1,000
Lowest Low Mid High Highest Market
Operating Profitability Quintile Avg. Ann. Return Sharpe Ratio
Lowest 8.27% 0.18 Low 9.31% 0.28 Mid 9.96% 0.33 High 10.56% 0.36 Highest 11.80% 0.45 Market 10.16% 0.34 6/30/1963 6/30/1967 6/30/1971 6/30/1975 6/30/1979 6/30/1983 6/30/1987 6/30/1991 6/30/1995 6/30/1999 6/30/2003 6/30/2007 6/30/2011 6/30/2015
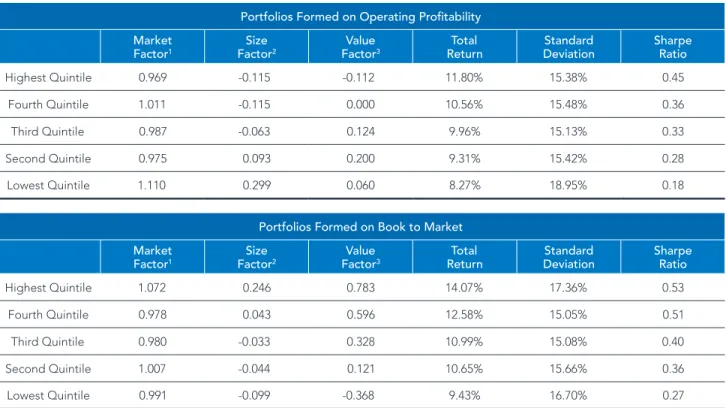
FIGURE 2: PUTTING OPERATING PROFITABILITY & BOOK TO MARKET THROUGH THE 3-FACTOR MODEL
[ 6/30/1963–6/30/2015 ]
Portfolios Formed on Operating Profitability Market
Factor1 FactorSize 2 FactorValue 3 ReturnTotal DeviationStandard Sharpe Ratio
Highest Quintile 0.969 -0.115 -0.112 11.80% 15.38% 0.45 Fourth Quintile 1.011 -0.115 0.000 10.56% 15.48% 0.36 Third Quintile 0.987 -0.063 0.124 9.96% 15.13% 0.33 Second Quintile 0.975 0.093 0.200 9.31% 15.42% 0.28 Lowest Quintile 1.110 0.299 0.060 8.27% 18.95% 0.18
Portfolios Formed on Book to Market Market
Factor1 FactorSize 2 FactorValue 3 ReturnTotal DeviationStandard Sharpe Ratio
Highest Quintile 1.072 0.246 0.783 14.07% 17.36% 0.53 Fourth Quintile 0.978 0.043 0.596 12.58% 15.05% 0.51 Third Quintile 0.980 -0.033 0.328 10.99% 15.08% 0.40 Second Quintile 1.007 -0.044 0.121 10.65% 15.66% 0.36 Lowest Quintile 0.991 -0.099 -0.368 9.43% 16.70% 0.27
1 Market Factor: Component of the Fama-French three-factor model meant to denote sensitivity to the movements of the broad equity market.
Values above 1.0 indicate a greater degree of sensitivity; values below 1.0 indicate a lesser degree of sensitivity.
2 Size Factor: Component of the Fama-French three-factor model meant to denote size exposure, with higher values indicating greater exposure
to the returns of small stocks and lower, especially negative, values indicating greater exposure to the returns of large stocks.
3 Value Factor: Component of the Fama-French three-factor model meant to denote exposure to value or growth stocks; greater positive values
indicate greater exposure to the returns of value stocks, and lower negative values indicate greater exposure to the returns of growth stocks. Source: Kenneth French Data Library, with data as of 6/30/2015. Period based on availability of operating profitability returns sorted into quintiles, which begins 6/30/1963. Past performance is not indicative of future results. You cannot invest directly in an index.
+ Top Quintile Outperformance: In both cases, the highest quintile delivered strong performance. While the book-to-market option did deliver the stronger performance, it came with higher risk. Why? Well, first the market factor loading was 1.07, indicating the potential for greater-than-market volatility. The size factor loading was 0.25, leading us to see a tilt toward mid- and small-cap companies. The operating profitability option had a market factor loading below 1.0 and a size factor loading of -0.12, meaning below-market volatility AND exposure predominantly to large-cap firms.
Our point is not necessarily to say that focusing on operating profitability is better or worse than focusing on book to market—each has potentially positive attributes. Given the outperformance of both, understanding the tilts resulting from achieving each respective focus and how they can complement each other is of prime importance.
MSCI’S QUALITY INDEXES
MSCI has a family of Indexes that focus on both value and quality and can be used to make further comparisons between these factor approaches. The specific quality metrics are very closely related to how GMO defined quality companies in 2004:
+Return on Equity (ROE): Trailing 12-month earnings per share21 divided by the current book value per share22 + Debt to Equity: Latest fiscal year total debt divided by the total book value
+ Earnings Stability: Standard deviation23 of year-over-year earnings-per-share growth over the past five fiscal years
MSCI defines a focus on value as:
+ Book-value-to-price ratio (note the parallel to the Fama and French book to market that we looked at earlier)
+ 12-month forward earnings-to-price ratio24 + Dividend yield25
Within the United States, we aimed to see what the risk/return picture has looked like focusing on quality as MSCI defines it, as opposed to just looking at the broad market. We also brought in the MSCI USA Value Index to facilitate comparisons between “quality” and “value.”
21 Trailing 12-month earnings per share: Earnings per share measured over the prior 12-month period.
22 Book value per share: Shareholders’ equity divided by the number of shares outstanding. Higher numbers indicate greater shareholders’
equity per unit of share price.
23 Standard deviation: measures the spread of actual returns around an average return during a specific period. Higher risk indicates greater
potential for returns to be farther away from this average.
24 12-month forward earnings-to-price ratio: Captures a measure of analyst expectations of earnings over the next 12 months divided by the
current share price. Higher values indicate greater levels of earnings expected relative to the current share price.
25 Dividend yield: Also, the trailing 12-month dividend yield, which Dividends over the prior 12 months are added together and divided by the
FIGURE 3: MSCI’S USA QUALITY, VALUE AND BROAD BENCHMARK [ 11/30/1975–6/30/2015 ]
Avg. Ann.
Return Avg. Ann. Std. Dev. Sharpe Ratio DrawdownMaximum Information Ratio CaptureUp CaptureDown Alpha Beta Correlation
3-Year
MSCI USA Quality Index 15.84% 9.13% 1.73 -4.13% -0.59 94.50% 105.16% -1.65% 1.02 0.95 MSCI USA Value Index 16.08% 8.82% 1.82 -4.08% -0.53 96.92% 108.97% -0.91% 0.98 0.95
MSCI USA Index 17.51% 8.56% 2.04 -3.39% 0.00 100.00% 100.00% 0.00% 1.00 1.00
5-Year
MSCI USA Quality Index 17.89% 11.20% 1.59 -9.43% 0.11 92.61% 82.63% 2.08% 0.89 0.96 MSCI USA Value Index 15.71% 11.96% 1.31 -17.96% -0.66 96.12% 106.23% -0.99% 0.96 0.97
MSCI USA Index 17.53% 12.08% 1.45 -16.41% 0.00 100.00% 100.00% 0.00% 1.00 1.00
10-Year
MSCI USA Quality Index 9.36% 13.12% 0.61 -40.49% 0.35 90.42% 83.86% 2.03% 0.86 0.97 MSCI USA Value Index 6.81% 15.07% 0.36 -54.59% -0.36 97.91% 103.57% -1.05% 0.99 0.97
MSCI USA Index 8.05% 14.79% 0.45 -50.65% 0.00 100.00% 100.00% 0.00% 1.00 1.00
20-Year
MSCI USA Quality Index 10.48% 14.42% 0.55 -40.49% 0.37 93.53% 86.80% 1.89% 0.91 0.97 MSCI USA Value Index 8.35% 15.30% 0.38 -54.59% -0.13 93.35% 96.14% -0.22% 0.95 0.95
MSCI USA Index 9.00% 15.28% 0.42 -50.65% 0.00 100.00% 100.00% 0.00% 1.00 1.00
30-Year
MSCI USA Quality Index 12.42% 15.00% 0.58 -40.49% 0.40 97.38% 89.65% 1.79% 0.95 0.97 MSCI USA Value Index 10.16% 15.02% 0.43 -54.59% -0.15 94.13% 96.67% -0.20% 0.94 0.96
MSCI USA Index 10.84% 15.21% 0.47 -50.65% 0.00 100.00% 100.00% 0.00% 1.00 1.00
Full Period
MSCI USA Quality Index 12.23% 14.99% 0.49 -40.49% 0.25 99.51% 94.85% 1.04% 0.97 0.97 MSCI USA Value Index 11.56% 14.60% 0.46 -54.59% 0.06 94.60% 92.37% 0.65% 0.94 0.96
MSCI USA Index 11.30% 14.92% 0.43 -50.65% 0.00 100.00% 100.00% 0.00% 1.00 1.00
Sources: MSCI, Zephyr StyleADVISOR. Period based on data availability of the MSCI USA Quality Index. Referred to as “full period,” which is 11/30/1975–6/30/2015. Past performance is not indicative of future results. You cannot invest directly in an index.
+Outperformance of Quality: The MSCI USA Quality Index outperformed the MSCI USA Value Index over the 5-, 10-, 20- and 30-year and full periods of available data shown. In each case, this was achieved while also maintaining a higher Sharpe ratio.
+Correlation26 and Beta: The MSCI USA Quality Index had a very similar correlation to the MSCI USA Index as
the MSCI USA Value Index. We found it interesting, however, that this was achieved while having a significantly lower beta measured against the MSCI USA Index over 5, 10 and 20 years.
We also wanted to utilize the three-factor model again. It was notable that over the full period, from November 30, 1975, to June 30, 2015, both the MSCI USA Quality and the MSCI USA Value Indexes outperformed the MSCI USA Index. How was this achieved?
26 Correlation: Statistical measure of how two sets of returns move in relation to each other. Correlation coefficients range from -1 to 1. A
correlation of 1 means the two subjects of analysis have moved in lockstep with each other. A correlation of -1 means the two subjects of analysis have moved in exactly opposite directions.
FIGURE 4: EXAMINING THE FACTOR LOADINGS OF THE MSCI USA INDEXES [ 11/30/1975–6/30/2015 ]
MSCI USA Indexes Market Factor1 Size Factor2 Value Factor3 Total
Return DeviationStandard Sharpe Ratio
MSCI USA Quality Index 0.938 -0.289 -0.184 12.23% 14.99% 0.49 MSCI USA Value Index 0.989 -0.195 0.319 11.56% 14.60% 0.46 MSCI USA Index 0.995 -0.210 0.016 11.30% 14.92% 0.43
1 Market Factor: Component of the Fama-French three-factor model meant to denote sensitivity to the movements of the broad equity market.
Values above 1.0 indicate a greater degree of sensitivity; values below 1.0 indicate a lesser degree of sensitivity.
2 Size Factor: Component of the Fama-French three-factor model meant to denote size exposure, with higher values indicating greater exposure
to the returns of small stocks and lower, especially negative, values indicating greater exposure to the returns of large stocks.
3 Value Factor: Component of the Fama-French three-factor model meant to denote exposure to value or growth stocks; greater positive values
indicate greater exposure to the returns of value stocks, and lower negative values indicate greater exposure to the returns of growth stocks. Sources: MSCI, Zephyr StyleADVISOR. Past performance is not indicative of future results. You cannot invest directly in an index.
+Quality: The MSCI Quality Index had a market factor loading below 1.0 (just as we saw with operating profitability earlier), as well as a distinct loading toward the larger size segment, indicated by the negative size factor loading of nearly -0.30. This was accomplished with a negative factor loading of -0.18 to value (in other words, tilting toward growth).
+Value: As expected, the MSCI Value Index loads significantly to the Fama-French value factor, with a positive 0.319. Similar to what we saw earlier in terms of the portfolios sorted by book to market, it didn’t necessarily lower the market factor loading like the quality version did.
DOES “QUALITY” ALWAYS OUTPERFORM?
No strategy always outperforms. The three-year period within figure 3 shows a period when quality wasn’t necessarily outperforming the market. In its aforementioned 2004 paper, GMO listed the following rationale for this phenomenon:27
As a result of a casino mentality in the stock market, risky stocks are generally overpriced because investors are trying to own the next big thing, be it a Starbucks or an eBay. The tantalizing prospect of generating stratospheric returns from a small investment seems to blind people to the overwhelming probability of loss. Similarly, investors tend to underpay for less risky stocks because these companies do not offer the theoretical possibility to shoot the lights out with one great stock selection.
MARRYING QUALITY & VALUE
Clearly the focus in value strategies is on how price relates to fundamentals such as dividends, earnings or book value. Quality factors focus on the inherent stability of the fundamentals themselves. These make them interesting complements. Novy-Marx wrote:28
Because strategies based on profitability are growth strategies, they provide an excellent hedge for value strategies, and thus dramatically improve a value investor’s investment opportunity set. In fact, the profitability strategy, despite generating significant returns on its own, actually provides insurance for value. We tested this premise using the MSCI USA Quality and MSCI USA Value Indexes. To function with an “insurance” characteristic, you wouldn’t want the MSCI Value and MSCI Quality outperforming or underperforming at the same time.
FIGURE 5: MSCI USA QUALITY VS. MSCI USA VALUE—EXCESS RETURNS AGAINST THE MSCI USA INDEX
[ Rolling 3-Year ]
Sources: MSCI, Zephyr StyleADVISOR, with data from 11/30/1975 to 6/30/2015. Past performance is not indicative of future results. You cannot invest directly in an index.
+Excess Returns Appear to Offset: When the MSCI USA Quality Index was outperforming the MSCI USA Index, the MSCI USA Value Index was underperforming it—and with a similar degree of magnitude. With the exception of the very recent three-year rolling periods, the potential that Novy-Marx cited appears very well intact.
28 Robert Novy-Marx, “The Other Side of Value: The Gross Profitability Premium,” 6/12.
Rolling 3-Y
ear Excess Returns
-12% -6% -8% -10% -4% -2% 0% 10% 8% 6% 4% 2% 6/30/2015 11/30/197811/30/198011/30/198211/30/198411/30/198611/30/198811/30/199011/30/199211/30/199411/30/199611/30/199811/30/200011/30/200211/30/200411/30/200611/30/200811/30/201011/30/2012
MSCI USA Quality Index MSCI USA Value Index
profitability strategy on top of an existing value strategy actually reduces overall portfolio volatility …”
This is an important point because one of the most focused-upon categories in investment management is “large-cap value.” Complementarity of quality strategies to value strategies could therefore lead to very broad appeal and usability. Within figure 6, the Value & Quality Blend refers to a 50% allocation to the MSCI USA Quality Index and a 50% allocation to the MSCI USA Value Index.
FIGURE 6: DOES A 50-50 BLEND OF QUALITY & VALUE IMPROVE THE SHARPE RATIO RELATIVE TO
VALUE ALONE? [ 11/30/1975–6/30/2015 ] Rolling Periods Percentage of Periods Where MSCI USA Value Index Outperformed MSCI USA Index Percentage of Periods Where Value and Quality Blend Outperformed MSCI USA Index Percentage of Periods Where Value and Quality Blend Increased Sharpe Ratio over MSCI USA Value Index Total Number of Periods Median Excess Return of MSCI USA Value Index vs. MSCI USA Index Median Excess Return of Value and Quality Blend vs. MSCI USA Index Median Incremental Change in Sharpe Ratio from MSCI USA Value Index to Value and Quality Blend 3-Year 53.0% 75.2% 55.5% 440 0.31% 0.59% 0.023 5-Year 48.1% 84.6% 59.9% 416 -0.09% 0.78% 0.039 7-Year 43.6% 95.2% 68.6% 392 -0.22% 0.77% 0.056 10-Year 41.0% 96.1% 79.5% 356 -0.13% 0.74% 0.061 15-Year 40.9% 99.7% 91.6% 296 -0.22% 0.73% 0.063 20-Year 16.1% 100.0% 94.5% 236 -0.34% 0.70% 0.079 25-Year 36.9% 100.0% 100.0% 176 -0.13% 0.73% 0.064 30-Year 37.1% 100.0% 100.0% 116 -0.07% 0.73% 0.067 Sources: MSCI, Kenneth French Data Library. Period based on data availability for the MSCI USA Quality Index, 11/30/1975–6/30/2015. Past performance is not indicative of future results. You cannot invest directly in an index.
+Excess Returns: This is the first question, and we see that the percentage of rolling periods that the Value & Quality Blend outperformed the MSCI USA Index was higher than it was for just the MSCI USA Value Index.
+Behavior of Excess Returns: This is the second question, and we look to the median excess return of the Value & Quality Blend versus the MSCI USA Index. For each of the rolling intervals beyond three years, we see that the median excess return was between 0.70% on the low end and 0.78% on the high end. This was much more stable than what we saw with the median excess return of the MSCI USA Value Index versus the MSCI USA Index, which ranged from -0.07% on the high end (excluding the three-year time frame) to -0.34% on the low end.
+Sharpe Ratio: The final question is to note if the Value & Quality Blend was indicating an improved Sharpe ratio relative to the MSCI USA Value Index alone. As the length of the rolling periods increased—similar to what we saw with the excess returns earlier—the percentage of times we noted an improved Sharpe ratio increased. Even on the shorter end, rolling three-year periods, we saw the Sharpe ratio increase more than half the time.
When focusing on the concept of quality, the first stop tends to be large-cap multinational firms, but small caps can also be of potential interest. Cliff Asness and his colleagues at AQR have explored this topic, writing the very memorably titled “Size Matters, If You Control Your Junk” in January 2015. Eugene Fama and Kenneth French have published different size sorts of their data on operating profitability.
When people familiar with different investment factor premia hear the names Fama and French, a common thought immediately jumps to mind: the small-cap value premium. We show that there equally should be a focus on the “small-cap quality” premium.
FIGURE 7: SMALL HIGH QUALITY VERY SIMILAR TO SMALL VALUE, WITH BOTH HANDILY
OUTPERFORMING THE RUSSELL 2000 INDEX [ 12/31/1978–6/30/2015 ]
Sources: Bloomberg, Kenneth French Data Library. Period selected due to data availability for the Russell 2000 Index. Past performance is not indicative of future results. You cannot invest directly in an index.
+Value or Quality? Over this period, the two were quite similar. During other periods, it is most likely that the two would ebb and flow in and out of favor, with neither out- or underperforming all the time. As we discussed with the large caps, the idea of blending small value and small quality could be of potential interest.
$278,269 $247,212 $22,621 $59,527 $1,000,000 $100,000 $10,000 $1,000 Gr owth of $1,000
Small-Low Quality Russell 2000 Index Small-High Quality Small-Value
Avg. Ann. Return Sharpe Ratio
Small-High Quality 16.29% 0.60 Small-Low Quality 8.92% 0.18 Small-Value 16.66% 0.65 Russell 2000 Index 11.84% 0.36
EXPLORING QUALITY BEYOND U.S. BORDERS
Next, we show a similar analysis outside the United States using both simple excess return differentials and Sharpe ratios to illustrate risk-adjusted return differentials.
FIGURE 8: AVERAGE ANNUAL RETURNS IN EXCESS OF MSCI BASE INDEXES [ 6/30/1995–6/30/2015 ]
Source: MSCI. MSCI EAFE Quality vs. MSCI EAFE and MSCI Japan Quality vs. MSCI Japan comparisons are done in local currency terms. All others are done in U.S. dollar terms. Neither the MSCI Emerging Markets Indexes nor the MSCI ACWI ex-USA Indexes had 15 or 20 years of data availability. Past performance is not indicative of future results. You cannot invest directly in an index.
+While in general the three-year period was a difficult one for “quality,” the longer periods—as GMO suggested—did in fact indicate outperformance. This outperformance seemed most volatile in Japan and least volatile in Europe, based on the periods and Indexes shown in figure 8.
USA
Quality QualityEAFE Emerging Markets Quality QualityJapan Europe Quality ACWI ex-USA Quality
Returns in Excess of Base Index
4.0% 3.0% 2.0% 1.0% -1.0% -2.0% -3.0% -4.0% -5.0% -1.7% -1.4% -0.2% -0.2% -4.2% 2.7% 3.0% 4.1% 1.1% 4.9% -3.9% 0.4% 0.6% 0.5% -0.5% -0.3% 1.3% 2.8% 2.7% 2.7% 2.7% 1.6% 2.3% 1.5% 2.2% 3.0% 0.8% 3.3% 3.1% 2.5% 0.8% 2.2% 5.0% 0.0% 6.0%
FIGURE 9: SHARPE RATIOS IN EXCESS OF MSCI BASE INDEXES [ 6/30/1995–6/30/2015 ]
Source: MSCI. MSCI EAFE Quality vs. MSCI EAFE and MSCI Japan Quality vs. MSCI Japan comparisons are done in local currency terms. All others are done in U.S. dollar terms. Neither the MSCI Emerging Markets Indexes nor the MSCI ACWI ex-USA Indexes had 15 or 20 years of data availability. Past performance is not indicative of future results. You cannot invest directly in an index.
WISDOMTREE’S QUALITY FOOTPRINT: METHODOLOGY & RATIONALE
One of the keys, in our opinion, is to not dilute the potential power of what others have mentioned above by trying to apply too many stock selection rules or complex weighting schemes. The key is to be as simple and broad-based as possible, while still tilting toward companies with low debt and high return on equity, which we believe to be an important common thread across the many varied interpretations of what quality means to different practitioners.
USA
Quality QualityEAFE Emerging Markets Quality QualityJapan Europe Quality ACWI ex-USA Quality
Incr
emental Change in Sharpe Ratio Against Base Index
1.00 0.80 0.60 0.20 0.00 -0.20 -0.40 -0.60 -0.31 0.40 0.20 -0.01 -0.46 0.31 0.17 0.33 0.08 0.97 -0.46 0.15 0.11 0.17 0.01 0.16 0.16 0.21 0.30 0.180.23 0.14 0.24 0.13 0.12 0.27 0.08 0.16 0.22 0.15 0.06 0.19 0.40 1.20
CRITICAL SELECTION CRITERIA AND RATIONALE FOR WISDOMTREE’S QUALITY DIVIDEND GROWTH INDEXES
The following general principles are used in creating these Indexes:
+ Companies Must Have Dividend Coverage Ratio29 Greater than 1.0x: Companies that are paying out more
dividends than they have earnings are less likely, we believe, to be dividend growth leaders.
+The Indexes comprise the companies with the best combined rank of growth and quality factors from this universe.
• Growth Ranking 50%: Derived from analysts’ long-term earnings growth expectations, which ultimately encompass the estimated growth in operating earnings per share over the company’s next full business cycle, typically three to five years.
• Quality Ranking 50%: Split evenly between three-year average return on assets (ROA) and three-year average return on equity (ROE).
Weighting: The Indexes are Dividend Stream®30 -weighted to reflect the proportionate share of the aggregate cash
dividends. This gives bigger weight to companies growing their dividends, as well as having the potential to raise the trailing 12-month dividend yield of the total portfolio. This Dividend Stream weighting methodology also brings a value tilt to the quality and growth selection.31
THOUGHTS ON THE SELECTION FACTORS
We believe the combined ranking of earnings growth and quality factors identifies stocks with the highest potential to increase dividends.
On Earnings Growth Expectations: We believe companies that can grow their earnings have the greatest potential to raise their dividends, which is why long-term earnings growth expectations as a factor make up 50% of our selection criteria. Just to note other index providers that also look at earnings growth expectations as part of their classification of growth companies: The Russell family of Indexes includes a similar forecast medium-term growth expectations variable in its model to determine whether constituent stocks qualify as part of the Russell growth Indexes or Russell value Indexes.32 We certainly recognize that these are only estimates and that, with an increasing time horizon, it
becomes more and more difficult for estimates such as these to be accurate. However, while the specific growth estimates per company may be hard to pin down, in general the relative direction and trends tend to be more accurate.
29 Dividend coverage ratio: Earnings per share divided by dividends per share. Higher numbers indicate a firm has a greater amount of
earnings per share relative to its dividend payments.
30Dividend Stream: refers to the regular dividends per share multiplied by the number of shares outstanding. 31 Both individual stock and sectors caps are put in place to restrict top holdings or undue sector concentration. 32 “Russell U.S. Equity Indexes Construction and Methodology,” Russell Indexes, 8/15.
On Quality Factor Rankings: Analysis of “quality” factors can take different forms. In our case, we have identified higher-quality companies as those that have displayed above-average historical returns on equity and on assets. We have used these criteria as part of our selection methodology, because we believe companies with better profitability metrics are better able to fund growing dividends.
We are certainly not the first to suggest there is a link between dividend growth and ROE33 or to use ROE as a stock
selection criterion.
ROE: THE BUFFETT FACTOR
There are also the investment practitioners who focus on ROE. Warren Buffett often says, as he did in his most recent annual letter34, that he looks for “businesses earning good returns on equity while employing little or no
debt.” Since high leverage involves the use of debt, our use of a quality ranking that incorporates both return on equity and return on assets enables us to mitigate the use of leverage as a sole driver of what may superficially appear to be a high ROE figure. The following quote from Charlie Munger at USC Business School in 1994 nicely summarizes why Buffett likes ROE as a factor:
We’ve really made the money out of high quality businesses. . . . If the business earns 6% on capital over 40 years and you hold it for that 40 years, you’re not going to make much different than a 6% return—even if you originally buy it at a huge discount. Conversely, if a business earns 18% on capital over 20 or 30 years, even if you pay an expensive looking price, you’ll end up with a fine result.
MEASURING THE TILT TOWARD QUALITY COMPANIES
To quantify the tilt toward quality, we use each of the market capitalization-weighted benchmarks as baselines to determine three-year average ROE quartiles and show the exposure of various indexes in each quartile.
33 ROE is tied to dividend growth in the dividend discount model described below.
FIGURE 10: THE TYPICAL WISDOMTREE QUALITY DIVIDEND GROWTH INDEX (OUTSIDE OF JAPAN) HAS APPROXIMATELY TWICE THE WEIGHT (OR MORE) IN THE TOP QUARTILE
Thematic Focus Index Top Quartile 2nd Quartile 3rd Quartile Bottom Quartile No Value
United States Large Cap
Above
22.5% 14.8% & 22.5%Between 9.4% & 14.8%Between Below 9.4% No 3-Year Avg ROE
WisdomTree U.S. Quality
Dividend Growth1 61.3% 26.2% 10.4% 2.1% 0.0%
S&P 500 31.6% 26.6% 21.4% 15.6% 4.8%
United States Small Cap
Above
14.8% 9.3% & 14.8%Between 3.4% & 9.3%Between Below 3.4% No 3-Year Avg ROE
WisdomTree U.S. SmallCap
Quality Dividend Growth2 53.0% 31.1% 15.6% 0.3% 0.0%
CRSP U.S. Small Cap 25.4% 24.0% 19.6% 16.9% 14.1%
Developed Int. Large Cap
Above
16.1% 9.9% & 16.1%Between 5.5% & 9.9%Between Below 5.5% No 3-Year Avg ROE
WisdomTree International Hedged
Quality Dividend Growth3 77.5% 20.4% 2.1% 0.0% 0.0%
MSCI EAFE 32.7% 24.9% 19.6% 18.3% 4.5%
Emerging Markets Large Cap
Above
20.7% 14.1% & 20.7%Between 8.1% & 14.1%Between Below 8.1% No 3-Year Avg ROE
WisdomTree Emerging Markets
Quality Dividend Growth4 75.9% 18.5% 5.6% 0.0% 0.0%
MSCI Emerging Markets 29.8% 28.2% 21.1% 16.6% 4.4%
Europe Large Cap
Above
19.0% 12.7% & 19.0%Between 5.6% & 12.7%Between Below 5.6% No 3-Year Avg ROE
WisdomTree Europe
Quality Dividend Growth5 60.5% 28.2% 10.2% 1.1% 0.0%
MSCI Europe 26.2% 25.6% 22.6% 20.0% 5.7%
Japan Large Cap
Above
11.1% 8.0% & 11.1%Between 5.0% & 8.0%Between Below 5.0% No 3-Year Avg ROE
WisdomTree Japan
Quality Dividend Growth6 41.4% 43.2% 10.4% 5.0% 0.0%
MSCI Japan 32.2% 29.8% 19.1% 17.6% 1.2%
Global ex-U.S. Large Cap
Above
18.3% 12.0% & 18.3%Between 6.3% & 12.0%Between Below 6.3% No 3-Year Avg ROE
WisdomTree Global ex-US
Quality Dividend Growth7 83.3% 15.0% 1.8% 0.0% 0.0%
MSCI ACWI ex-US 25.9% 29.4% 22.8% 19.2% 2.7%
1 As of 6/30/15, this was the WisdomTree U.S. Dividend Growth Index.
2 As of 6/30/15, this was the WisdomTree U.S. SmallCap Dividend Growth Index. 3 As of 6/30/15, this was the WisdomTree International Hedged Dividend Growth Index. 4 As of 6/30/15, this was the WisdomTree Emerging Markets Dividend Growth Index. 5 As of 6/30/15, this was the WisdomTree Europe Dividend Growth Index.
6 As of 6/30/15, this was the WisdomTree Japan Dividend Growth Index. 7 As of 6/30/15, this was the WisdomTree Global ex-U.S. Dividend Growth Index.
Source: Bloomberg, with data as of 6/30/15. Each regional Index is measured as of the most recent WisdomTree index screening date: For United States large cap and small cap: 11/30/14. For developed international large cap, Europe large cap and Japan large cap: 5/31/15. For emerging markets large cap and global ex-U.S. large cap: 9/30/14. Past performance is not indicative of future results. You cannot invest directly in an index.
+ How Japan is Different: Japan is undergoing somewhat of an ROE renaissance, with companies becoming much more directly focused on improving shareholder returns. However, the need for this renaissance was brought on by the fact that Japanese equities—compared to other global equity markets—tend to have very low ROE. The WT Quality Dividend Growth methodology does tilt toward higher-ROE firms, but the tilt is simply not as pronounced as it is in some of the other regions.
SECTOR EXPOSURES TILT AWAY FROM FINANCIALS AROUND THE WORLD
In applying WisdomTree’s Quality Dividend Growth methodology around the world, the focus on “low leverage” led to another very interesting observation. After the global financial crisis of 2008–09, the words “financials” and “leverage” became closely intertwined. Even though the picture has improved from the crisis levels, WisdomTree’s Quality Dividend Growth approach still exhibits a bias away from the sector. In the U.S., which has tended to deleverage significantly since the crisis, the bias only shows up as an 11% to 12% under-weight. In the developed international, emerging markets and Europe-focused versions, this bias becomes a greater than 20% under-weight.
RETURN ON EQUITY: THE CRITICAL LINK CONNECTING QUALITY TO DIVIDEND GROWTH POTENTIAL
In the finance literature, return on equity is critically linked to dividend growth and intrinsic value35 of companies
through the dividend discount model (DDM).36 The DDM for stock valuation states:
The value of a stock = DPS (1) / (R-G) Where:
+ DPS (1) = Dividends per share expected to be received in one year
+ R = The required rate of return for the investment
+ G = Growth rate in dividends = ROE x earnings retention (or 1 minus dividend payout ratio)37
The growth rate equals the return on equity times the reinvestment rate; simply stated, the growth of dividends is determined by what fraction of earnings is put back into the firm and how profitable those earnings are in their subsequent use. A sustainable dividend growth rate is thus critically linked in finance theory to ROE.
35 Intrinsic value: Value of a firm based on its operations, business practices and profitability, which may or may not be closely related to the
value of that same firm based on its equity share price.
36 William L. Silber and Jessica Wachter, “Equity Valuation Formulas,” New York University, 2013.
37 Earnings retention (or 1 minus dividend payout ratio): The dividend payout ratio is the dividend per share divided by the earnings per share.
Since the earnings retention plus the dividend payout ratio must be added together to equal 100% of the earnings, 1 minus dividend payout ratio = earnings retention, the percentage of earnings not paid out as dividends.
HOW IMPORTANT IS DIVIDEND GROWTH TO TOTAL RETURNS?
From December 31, 1957, to June 30, 2015, the S&P 500 Index has generated average annual dividend growth of 5.6%. Over the past 10 years, this figure has been closer to 7.1%, meaning that dividend growth has been a more important driver of total returns recently.
While it’s impossible to know the future, we do know that U.S. equities and the S&P 500 Index have performed strongly, and strong performance raises the challenge for future positive returns from valuation change. As of June 30, 2015, the S&P 500 had a dividend yield of 2.1%, which is also below the long-run average annual dividend reinvestment rate going back to December 31, 1957. We think this tells us that dividend growth has the potential to be a very strong factor in total returns of U.S. stocks going forward, and if approaches focused on quality can emphasize this component of total returns, it could make them particularly interesting.
MEASURING DIVIDEND GROWTH OF CURRENT CONSTITUENTS
It’s important to look beyond the theoretical underpinnings of the indexes and note the types of exposures and other characteristics that are resulting from an indexes application.
One important attribute is the dividend growth of the current constituents of each index, measured against a market capitalization-weighted benchmark. The broad market capitalization-weighted benchmark represents the market in question, and the true question is whether the constituents being selected by this approach have been growing their dividends faster.
FIGURE 11: MEDIAN DIVIDEND GROWTH OF CURRENT CONSTITUENTS COMPARISON [ as of 6/30/15 ]
Thematic Focus Index Median Dividend Growth of Current Constituents
1-Year 3-Year 5-Year
United States Large Cap WisdomTree U.S. Quality Dividend Growth
1 13.8% 15.9% 15.3%
S&P 500 12.9% 14.0% 13.9%
United States Small Cap WisdomTree U.S. SmallCap Quality Dividend Growth
2 14.1% 12.1% 11.8%
CRSP U.S. Small Cap 14.2% 12.0% 10.3%
Developed Int. Large Cap WisdomTree International Hedged Quality Dividend Growth
3 15.8% 14.0% 16.5%
MSCI EAFE 12.5% 10.7% 10.6%
Emerging Markets Large Cap WisdomTree Emerging Markets Quality Dividend Growth
4 20.2% 16.3% 17.8%
MSCI Emerging Markets 22.1% 14.8% 15.1%
Europe Large Cap WisdomTree Europe Quality Dividend Growth
5 12.4% 11.0% 12.4%
MSCI Europe 10.0% 9.7% 10.8%
Japan Large Cap
WisdomTree Japan Quality Dividend Growth6 20.0% 17.0% 14.9%
JPX Nikkei 400 16.7% 14.5% 13.1% MSCI Japan 16.7% 14.5% 12.0%
Global ex-U.S. Large Cap WisdomTree Global ex-US Quality Dividend Growth
7 20.0% 16.4% 17.5%
MSCI ACWI ex-US 15.6% 11.9% 12.2%
1 As of 6/30/15, this was the WisdomTree U.S. Dividend Growth Index.
2 As of 6/30/15, this was the WisdomTree U.S. SmallCap Dividend Growth Index. 3 As of 6/30/15, this was the WisdomTree International Hedged Dividend Growth Index. 4 As of 6/30/15, this was the WisdomTree Emerging Markets Dividend Growth Index. 5 As of 6/30/15, this was the WisdomTree Europe Dividend Growth Index.
6 As of 6/30/15, this was the WisdomTree Japan Dividend Growth Index. 7 As of 6/30/15, this was the WisdomTree Global ex-U.S. Dividend Growth Index.
Source: Bloomberg, with data as of 6/30/15. Past performance is not indicative of future results. You cannot invest directly in an index.
+While the WisdomTree Quality Dividend Growth Indexes do not exhibit higher median dividend growth in every single case shown—it’s close. The biggest difference is seen within the WisdomTree International Quality Dividend Growth Index as compared to the MSCI EAFE Index, whereas one of the closest comparisons is between the WisdomTree U.S. SmallCap Quality Dividend Growth Index and the CRSP U.S. Small Cap Index.
MEASURING LEVERAGE & DIVIDEND GROWTH POTENTIAL
While the recent dividend growth levels of the current Index constituents are certainly interesting, it doesn’t illustrate fully how each element of the methodology links together in order to create an environment with future dividend growth potential. We show the theoretical dividend growth potential by multiplying the earnings retention rate with the ROE (from the dividend discount model above).
FIGURE 12: LOWER LEVERAGE WITH HIGHER DIVIDEND GROWTH POTENTIAL [ as of 6/30/15 ]
Index P/E Ratio Dividend Yield Retention RateEarnings ROE ROA Leverage ROE x Earnings Retention Rate
WisdomTree U.S.
Quality Dividend Growth1 17.5x 2.4% 58.6% 24.0% 6.1% 3.9x 14.1%
S&P 500 17.5x 2.1% 62.4% 15.3% 2.8% 5.4x 9.6% WisdomTree U.S. SmallCap
Quality Dividend Growth2 16.5x 2.9% 49.6% 13.2% 3.4% 3.9x 6.5%
CRSP U.S. Small Cap 23.2x 1.6% 54.1% 8.2% 1.6% 5.0x 4.4% WisdomTree International Hedged
Quality Dividend Growth3 18.1x 2.9% 50.9% 20.4% 9.5% 2.4x 10.4%
MSCI EAFE 15.8x 3.2% 42.7% 9.4% 1.3% 7.5x 4.0% WisdomTree Emerging Markets Quality
Dividend Growth4 15.7x 4.0% 38.1% 20.9% 10.6% 2.2x 8.0%
MSCI Emerging Markets 12.7x 2.6% 63.2% 11.2% 2.2% 5.1x 7.1% WisdomTree Europe
Quality Dividend Growth5 18.4x 2.8% 45.2% 18.1% 5.9% 3.5x 8.2%
MSCI Europe 15.9x 3.5% 22.9% 8.4% 1.1% 7.7x 1.9% WisdomTree Japan
Quality Dividend Growth6 15.2x 2.1% 65.5% 9.7% 4.0% 2.5x 6.3%
JPX-Nikkei 400 16.1x 1.6% 70.7% 8.3% 1.5% 5.5x 5.9% MSCI Japan 15.4x 1.7% 71.4% 8.4% 1.5% 5.7x 6.0% WisdomTree Global ex-US
Quality Dividend Growth7 17.3x 3.1% 47.0% 20.9% 9.1% 2.5x 9.8%
MSCI ACWI ex-US 15.1x 3.0% 48.3% 9.8% 1.4% 7.1x 4.8%
1 As of 6/30/15, this was the WisdomTree U.S. Dividend Growth Index.
2 As of 6/30/15, this was the WisdomTree U.S. SmallCap Dividend Growth Index. 3 As of 6/30/15, this was the WisdomTree International Hedged Dividend Growth Index. 4 As of 6/30/15, this was the WisdomTree Emerging Markets Dividend Growth Index. 5 As of 6/30/15, this was the WisdomTree Europe Dividend Growth Index.
6 As of 6/30/15, this was the WisdomTree Japan Dividend Growth Index. 7 As of 6/30/15, this was the WisdomTree Global ex-U.S. Dividend Growth Index.
Sources: Bloomberg, Standard & Poor’s, with data as of 6/30/15. Past performance is not indicative of future results. You cannot invest directly in an index.
+ Higher Dividend Growth Potential: The WT methodology tends to increase the ROE x earnings retention (theoretically sustainable dividend growth) relative to the market capitalization-weighted benchmarks. The main driver of this is the higher return on equity rather than higher earnings retention.
+ Lower Leverage with Each WT Quality Dividend Growth Index: One of the key tenets of potential Buffett acquisitions is low debt. Relative to the market capitalization-weighted benchmarks that we show, there is a significantly lower leverage because of the inclusion of ROA as part of the selection criteria.
CONCLUSION
While quality can be measured in a variety of ways, we think that the broad themes of earnings consistency or growth, low debt and high return on equity are common threads to many different approaches. We’ve seen that, over time, focusing on quality—whether through MSCI’s approach or through Fama and French’s looking at operating profitability—has generated outperformance over different periods.
With an S&P 500 Index dividend yield close to 2.1% as of June 30, 2015, and the strong performance of U.S. equities that we have seen in recent years, we think it is difficult to imagine markets being driven by significant further dividend yield compression, and that dividend growth, which has been above its long-term average of 5.6%, will continue to be an important driver of returns.
WisdomTree’s Quality Dividend Growth strategies could be interesting, in that they are designed to focus on long-term earnings growth expectations as well as on three-year average return on equity and return on assets. If equity markets do become more expensive, there is also an annual rebalancing process, which tilts weight toward qualifying firms whose dividends have become less expensive compared to their prices. Bottom line, these strategies have the potential to capture the quality theme but also to maintain a reasonable valuation while doing so.
Dividends are not guaranteed, and a company’s future ability to pay dividends may be limited. A company currently paying dividends may cease paying dividends at any time. Diversification does not eliminate the risk of experiencing investment losses. You cannot invest directly in an index.
Investors should carefully consider the investment objectives, risks, charges and expenses of the Fund before investing. To obtain a prospectus containing this and other important information, please call 866.909.WISE (9473) or visit wisdomtree. com. Investors should read the prospectus carefully before investing.
There are risks associated with investing, including possible loss of principal. Investments focusing on certain sectors and/or smaller companies increase their vulnerability to any single economic or regulatory development. This may result in greater share price volatility. Foreign investing involves special risks, such as risk of loss from currency fluctuation or political or economic uncertainty. Derivative investments can be volatile, and these investments may be less liquid than other securities, and more sensitive to the effects of varied economic conditions. As investments can have a high concentration in some issuers, they can be adversely impacted by changes affecting those issuers. Investments in emerging, offshore or frontier markets are generally less liquid and less efficient than investments in developed markets and are subject to additional risks, such as risks of adverse governmental regulation and intervention or political developments.
The Global Industry Classification Standard (“GICS”) was developed by and is the exclusive property and a service mark of MSCI Inc. (“MSCI”) and Standard & Poor’s (“S&P”), a division of The McGraw-Hill Companies, Inc., and is licensed for use by WisdomTree Investments, Inc. Neither MSCI, S&P nor any other party involved in making or compiling the GICS or any GICS classifications makes any express or implied warranties or representations with respect to such standard or classification (or the results to be obtained by the use thereof), and all such parties hereby expressly disclaim all warranties of originality, accuracy, completeness, merchantability and fitness for a particular purpose with respect to any such standard or classification. Without limiting any of the foregoing, in no event shall MSCI, S&P, any of their affiliates or any third party involved in making or compiling the GICS or any GICS classifications have any liability for any direct, indirect, special, punitive, consequential or any other damages (including lost profits) even if notified of the possibility of such damages.
WisdomTree U.S. Quality Dividend Growth Index: A fundamentally weighted index designed to track the performance of dividend-paying companies in the U.S. that WisdomTree believes have the potential to increase their dividends due to certain factors, which include estimated earnings growth, return on equity and return on assets. Weighting is by indicated cash dividends. As of 6/30/2015, this was the WisdomTree U.S. Dividend Growth Index. WisdomTree U.S. SmallCap Quality Dividend Growth Index: A fundamentally weighted index designed to track the performance of dividend-paying companies in the U.S. small-cap equity universe that WisdomTree believes have the potential to increase their dividends due to certain factors, which include estimated earnings growth, return on equity and return on assets. Weighting is by indicated cash dividends. As of 6/30/2015, this was the WisdomTree U.S. SmallCap Dividend Growth Index. WisdomTree International Hedged Quality Dividend Growth Index: Designed to provide exposure to the developed market companies while neutralizing exposure to fluctuations between the value of foreign currencies and the U.S. dollar. Comprises companies from the WisdomTree DEFA Index with the best combined rank of growth and quality factors. As of 6/30/2015, this was the WisdomTree International Hedged Dividend Growth Index. WisdomTree Emerging Markets Quality Dividend Growth Index: A fundamentally weighted index designed to track the performance of dividend-paying emerging market companies that WisdomTree believes have the potential to increase their dividends due to certain factors, which include estimated earnings growth, return on equity and return on assets. Weighting is by trailing 12-month cash dividends. As of 6/30/2015, this was the WisdomTree Emerging Markets Dividend Growth Index. WisdomTree Europe Quality Dividend Growth Index: A fundamentally weighted index that measures the performance of dividend-paying common stocks with growth characteristics selected from the WisdomTree DEFA Index. The Index comprises companies from the eligible universe based on their combined ranking of growth and quality. As of 6/30/2015, this was the WisdomTree Europe Dividend Growth Index. WisdomTree Japan Quality Dividend Growth Index: A fundamentally weighted index that measures the performance of dividend-paying common stocks with growth characteristics selected from the WisdomTree DEFA Index. The Index comprises 300 companies from the eligible universe based on their combined ranking of growth and quality factors. The growth factor ranking is based on long-term earnings growth expectations, and the quality factor ranking is based on three- year historical averages for return on equity and return on assets. Companies are weighted in the Index based on annual cash dividends paid. As of 6/30/2015, this was the WisdomTree Japan Dividend Growth Index. WisdomTree Global ex-US Quality Dividend Growth Index: Designed to measure the performance of dividend-paying companies outside the United States with what WisdomTree believes to be potential for future dividend increases. Weighting is by Dividend Stream. As of 6/30/2015, this was the WisdomTree Global ex-U.S. Dividend Growth Index. S&P 500 Index: A market capitalization-weighted benchmark of 500 stocks selected by the Standard & Poor’s Index Committee, designed to represent the performance of the leading industries in the United States economy. CRSP U.S. Small Cap Index: A market capitalization-weighted measure of the performance of small-cap equities in the United States. MSCI EAFE Index: A market cap-weighted index composed of companies representative of the developed market structure of developed countries in Europe, Australasia and Japan. MSCI Emerging Markets Index: A broad market cap-weighted index showing the performance of equities across 23 countries defined as “emerging markets” by MSCI. MSCI Europe Index: A free float-adjusted market capitalization-weighted index designed to measure the performance of developed equity markets in Europe. MSCI Japan Index: A market cap-weighted subset of the MSCI EAFE Index that measures the performance of the Japanese equity market. JPX-Nikkei Index 400: Composed of common stocks whose main market is the TSE First Section, Second Section, Mothers or JASDAQ market (in principle). The components are reviewed annually to keep the representativeness of the market. The annual review shall be conducted at the end of August as follows: (1) 1,000 stocks are selected based on trading value in the past three years and the market value on the selection base date (the end of June) of the annual review. (2) Each stock is scored by three-year average ROE, three-year cumulative operating profit and market value on the selection base date with the weights on each indicator 40%, 40% and 20%, respectively. (3) 400 stocks are selected by the final ranking with the scores calculated in (2) and qualitative factors from the perspectives of corporate governance and disclosure. In case of delisting of the components due to a merger or bankruptcy, etc., new stocks shall not be added in principle. When the annual review is conducted, the number of components is back to 400; therefore, the Index is calculated with fewer than 400 components until then. MSCI ACWI ex-US Index: A free float-adjusted market capitalization-weighted index designed to measure the equity market performance of developed and emerging markets excluding companies based in the United States. MSCI USA Index: A broad-based measure of free float-adjusted market capitalization-weighted equity market performance within the United States. MSCI USA Value Index: Measure of the performance of companies within the United States, weighted by free float-adjusted market capitalization, that have lower prices relative to their fundamentals, like dividends or book value. MSCI USA Quality Index: Measure of the performance of companies within the United States that have exhibited profitability, earnings stability and low debt to equity. Russell 2000 Index: Measures the performance of the small-cap segment of the U.S. equity universe. The Russell 2000 is a subset of the Russell 3000 Index, representing approximately 10% of the total market capitalization of that index. It includes approximately 2,000 of the smallest securities based on a combination of their market cap and current index membership. MSCI EAFE Quality Index: Measure of the performance of companies from within the MSCI EAFE Index that have exhibited profitability, earnings stability and low debt to equity. MSCI Emerging Markets Quality Index: Measure of the performance of companies from within the MSCI Emerging Markets Index that have exhibited profitability, earnings stability and low debt to equity. MSCI Europe Quality Index: Measure of the performance of companies from within the MSCI Europe Index that have exhibited profitability, earnings stability and low debt to equity. MSCI Japan Quality Index: Measure of the performance of companies from within the MSCI Japan Index that have exhibited profitability, earnings stability and low debt to equity. MSCI ACWI ex-US Quality Index: Measure of the performance of companies from within the MSCI ACWI ex-US Index that have exhibited profitability, earnings stability and low debt to equity. Jeremy Schwartz & Christopher Gannatti are registered representatives of Foreside Fund Services, LLC.
WisdomTree Funds are distributed by Foreside Fund Services, LLC.
![FIGURE 3: MSCI’S USA QUALITY, VALUE AND BROAD BENCHMARK [ 11/30/1975–6/30/2015 ]](https://thumb-us.123doks.com/thumbv2/123dok_us/8734994.2366759/8.918.100.824.244.639/figure-msci-usa-quality-value-and-broad-benchmark.webp)
![FIGURE 4: EXAMINING THE FACTOR LOADINGS OF THE MSCI USA INDEXES [ 11/30/1975–6/30/2015 ]](https://thumb-us.123doks.com/thumbv2/123dok_us/8734994.2366759/9.918.94.823.249.390/figure-examining-factor-loadings-msci-usa-indexes.webp)

![FIGURE 6: DOES A 50-50 BLEND OF QUALITY & VALUE IMPROVE THE SHARPE RATIO RELATIVE TO VALUE ALONE? [ 11/30/1975–6/30/2015 ] Rolling Periods Percentage of Periods Where MSCI USA Value Index Outperformed MSCI USA Index Percentage of Periods Where](https://thumb-us.123doks.com/thumbv2/123dok_us/8734994.2366759/11.918.100.826.437.772/quality-improve-relative-rolling-periods-percentage-outperformed-percentage.webp)
![FIGURE 7: SMALL HIGH QUALITY VERY SIMILAR TO SMALL VALUE, WITH BOTH HANDILY OUTPERFORMING THE RUSSELL 2000 INDEX [ 12/31/1978–6/30/2015 ]](https://thumb-us.123doks.com/thumbv2/123dok_us/8734994.2366759/12.918.102.816.503.959/figure-small-quality-similar-small-handily-outperforming-russell.webp)
![FIGURE 8: AVERAGE ANNUAL RETURNS IN EXCESS OF MSCI BASE INDEXES [ 6/30/1995–6/30/2015 ]](https://thumb-us.123doks.com/thumbv2/123dok_us/8734994.2366759/13.918.99.824.351.647/figure-average-annual-returns-excess-msci-base-indexes.webp)
![FIGURE 9: SHARPE RATIOS IN EXCESS OF MSCI BASE INDEXES [ 6/30/1995–6/30/2015 ]](https://thumb-us.123doks.com/thumbv2/123dok_us/8734994.2366759/14.918.99.823.258.550/figure-sharpe-ratios-excess-msci-base-indexes.webp)

