Research Article
Plackett–Burman Combined with Box–Behnken to Optimize the
Medium of Fermented Tremella Polysaccharide and Compare the
Characteristics before and after Optimization
Xia Ma ,
1,2Meng Yang ,
1Yan He ,
1Chenglinang Li ,
3and Chuntao Zhai
3 1School of Perfume and Aroma Technology, Shanghai Institute of Technology, Shanghai 201418, China2State Key Laboratory of Dairy Biotechnology, Shanghai Engineering Research Center of Dairy Biotechnology, Dairy Research Institute, Bright Dairy & Food Co., Shanghai 200436, China
3Laibo Pharmaceutical Technology (Shanghai) Co. Ltd., Shanghai 201418, China
Correspondence should be addressed to Chenglinang Li; richard-li@laibo.com.cn and Chuntao Zhai; ct-zhai@laibo.com.cn
Received 5 August 2020; Revised 11 November 2020; Accepted 6 December 2020; Published 21 December 2020
Academic Editor: Fatma M. El-Demerdash
Copyright © 2020 Xia Ma et al. This is an open access article distributed under the Creative Commons Attribution License, which permits unrestricted use, distribution, and reproduction in any medium, provided the original work is properly cited. The purpose of this study was to improve the yield of fermented Tremella polysaccharide (FTP) by optimizing the medium and to explore the effect of optimization on the structure. In this paper, the Plackett–Burman design and response surface method were used to optimize the fermentation medium of Tremella spore GT2# for FTP production. The results of the Plackett–Burman design showed that potato extract, glucose, and peptone were the main factors. The Box–Behnken experiment and regression analysis determined that the optimal concentrations of potato extract, glucose, and peptone were 22.01%, 29.38 g/L, and 2.61 g/L, respectively. After optimization, the fermentation period shortened from 5 days to 3 days, and the yield of FTP increased from 10.75 g/L to 12.50 g/L, which was in good agreement with the predicted value (12.36 g/L). Characterization of FTP obtained before and after optimization was carried out, and the results showed that medium optimization had significant effects on the primary structure of FTP, including molecular weight, monosaccharide composition, and proportion. After optimization, the content of acid polysaccharide increased, and the glycoside bonds changed froma-configuration toß-configuration.
1. Introduction
Tremella polysaccharide (TP) is a kind of macromolecular substance with multiple biological activities. It is obtained from the fruit body, mycelia, or fermentation broth of Tremella fuciformis. TP has many physiological activities such as anti-inflammatory [1], immune protection [2–4], antioxidation [5, 6], adjuvant treatment of diabetes [7], moisturizing [8], and gelation [9]. TP of high purity sells for up to 200000 RMB/g. Commercially available TP is mainly obtained from the mature fruit body, but the quality and yield are easily affected by the environment [10]. High-density fermentation of Tremella fuciformis has many advantages such as easy control of the fermentation conditions, greatly increased yield, reduced production cycle [11], and meeting up with the market demand of fermented Tremella polysaccharides (FTPs).
At present, the research on Tremella polysaccharides by deep fermentation cannot be promoted on a large scale. The main reasons include large investment and low polysac-charide yield and purity. Therefore, related research has focused on the breeding of high-yielding Tremella spore polysaccharide strains and the optimization of fermentation conditions to increase the spore biomass and the production of exosporous polysaccharides. The yield of fermented Tremella polysaccharides has stabilized at about 4 g/L in the past 10 years. In Dong’s research [12], after 6 days of fer-mentation of Tremella spores, intracellular polysaccharides and extracellular polysaccharides were extracted at the same time, and the total yield reached 3.42 g/L. Zhu [13] con-trolled the pH of the fermentation environment and added different carbon sources to make the bacteria propagate rapidly, and the yield of Tremella polysaccharide reached
Volume 2020, Article ID 8896454, 14 pages https://doi.org/10.1155/2020/8896454
4.4 g/L after 120 h fermentation, while fermentation of
Tremella fuciformisspores by the method of controlling pH in three stages provided a polysaccharide yield of 3.8 g/L [14]. Fermentation of Tremella mycelium has not yet been industrialized on a large scale because of the low yield and darker color of Tremella mycelium polysaccharides. Wang fermented the mycelium of Tremella fuciformis, and the concentration of acidTremella fuciformispolysaccharide in the fermentation broth reached 1.9 g/L [15].
According to previous studies, Tremella spore is more suitable for the deep fermentation to produce FTP than Tremella mycelium. Also, the integrated potato medium is a low-nitrogen [16], high-sugar [17], and highly inorganic salt [18] medium which is suitable for Tremella fuciformis fer-mentation [19]. Medium optimization will have a great impact on FTP output and product quality [16, 20, 21]. The optimization of the fermentation medium plays an im-portant role in the industrial production of microorganisms, which is a necessary link from laboratory to industrial production. Whether a good fermentation medium can be designed is a very important step in the successful indus-trialization of fermentation products. In this study, Plack-ett–Burman and Box–Behnken response surface methods were used to optimize the fermentation medium. Factors affecting FTP yield were analyzed by glucose metabolism before and after optimization. The characterization differ-ences of FTP before and after optimization were compared, and the effect of the optimized medium on the quality of polysaccharides from Tremella spores was evaluated. This paper will conduct an exploratory study on the influence of medium formulation on the structure of FTP. This research is expected to promote the industrialization of FTP.
2. Materials and Methods
2.1. Strain Culture. TheTremella fuciformisstrain GT2# used in this experiment was isolated from the laboratory of Shanghai Institute of Technology. The strain was inoculated at 28°C for 24 h in an integrated potato medium slant
(glucose 20 g/L; potato extract 20%, peptone 2 g/L, KH2PO4
3 g/L, MgSO4·7H2O 1.5 g/L, Vb1 8 mg/L, and agar 20 g/L)
until the spores on the surface turned into a smooth round colony, and the slants were stored at 4°C. All media were
sterilized at 121°C for 20 min.
2.2. Seed Preparation. The liquid seed medium formula is glucose 20 g/L, potato extract 20%, peptone 2 g/L, KH2PO43 g/
L, MgSO4·7H2O 1.5 g/L, and Vb18 mg/L. The volume of seed
liquid was 20% of the conical flask volume, and the culture conditions were as follows: 25 °C, 150 r/min, and 24 h. The
optical density of spores was measured at 560 nm with 50 times diluted fermentation broth, and the seed preparation was completed when the absorbance reached 0.2.
2.3. Fermentation Culture. The fermentation medium is the same as the liquid seed medium, which is the integrated the potato medium. The inoculation dose was 2%. The culture condition was 25°C, 250 r/min, and the culture was carried
out on a shaking table for 7 days. The fermentation broth was centrifuged at 10000×g for 15 min. The supernatant was incubated to 100 mL with distilled water, and the total sugar content was measured and recorded as T1 (g/L) and the
reducing sugar content asR1(g/L). FTP yield records toY
(g/L) and calculated by equation (1). The utilization rate of reducing sugar is recorded as U(%), which represents the substrate consumption, calculated by equation (2).
Y(g/L) �T1−R1, (1)
U(%) �(R0−R1)
R0 ×100%, (2)
whereT1(g/L): total sugar content in the fermentation broth. R1(g/L): residual reducing sugar in the fermentation broth. R0 (g/L): initial reducing sugar content.
2.4. Single-Factor Experiments. Various factors (glucose, potato extract, peptone, KH2PO4, MgSO4·7H2O, and Vb1) in
the integrated potato medium were experimented at different concentrations. The optimal concentration range of each factor was preliminarily determined by the single-factor experiment. The experimental design is shown in Table 1.
2.5. Plackett–Burman Test. In order to rank the influence of various factors in the integrated potato medium on FTP yield, six independent variables at two levels with 15 runs were organized in accordance with the Plackett–Burman design. The low level (−1) of the Plackett–Burman test was set as the optimal value of the single-factor experiment, and the high level (+1) was about 1.25 times of the low level. The experimental level of each factor is shown in Table 2.
2.6. Steepest Ascent Experiment. According to the Plack-ett–Burman experiment, potato extract, glucose, and pep-tone were selected for the climbing experiment. The actual step size of potato extract was set to 1%, and the actual step size of glucose and peptone is −0.84 g/L and 0.06 g/L, respectively.
2.7. Response Surface Methodology (RSM). The response surface methodology was used to optimize potato extract, glucose, and peptone further. As presented in Table 3, variables were designed as three-level (low, middle, and high) experiments and coded as−1, 0, and 1. According to the coding design, Design-Expert software generated a three-factor, three-level, 17-run experimental design scheme, using the yield of FTP (Y) and the reducing sugar utilization (U) rate as the response value at the end of fermentation. The interaction effect of variables on the bioresponse surface isogram was used to illustrate the in-teraction relationship between factors [19].
2.8. Regression Model Fitting and Variance Analysis.
Design-Expert 7.0.1 software was used to output the results of variance analysis of the Plackett–Burman experiment and
Box–Behnken experiment and carry out regression analysis of the results of the Box–Behnken experiment to simulate the prediction equation.
2.9. Fermentation in a 5 L Fermentor. The results of medium optimization were verified in a 5 L stirred-tank reactor (siso-bio-5l, Shanghai, China). Fermentation was carried out under the following conditions: temperature 25°C, inflation
rate 2 vvm, stirring speed 200 rpm, initial pH 7, working capacity 3 litres, and fermentation time 7 days.
In a fermentation cycle, 10 mL fermentation broth was taken every 24 h and centrifuged at 10000×gfor 15 min. The contents of reducing sugar and total sugar were determined, respectively, after the supernatant constant volumed to 10 mL. The precipitate was washed 3 times, then freeze-dried, and recorded as the dry weight. The fermentation time was taken as the abscissa, and the reducing sugar content, total sugar content, and dry weight of the bacteria were used as the ordinates to draw the curves. The results were compared with the control group (before optimization).
2.10. Preparation and Extraction of FTP. Based on previous studies [22], freeze-thaw combined with the dual aqueous phase method was used to extract crude FTP from fer-mentation broth before and after optimization. The 10 mg/ mL crude FTP was eluted in a gradient on the DEAE-Sepharose fast flow column. The eluent was NaCl solution with a concentration gradient of 0, 0.2, 0.4, 0.6, and 0.8 mol/ L. The eluent flow rate was 1.5 mL/min. A total of 100 tubes
were collected, each for 5 minutes. According to the total sugar content in the separated polysaccharide peaks, the recovery rate (equation (3)) of the purified fraction in the crude FTP and the proportion of FTP-1, FTP-2, and FTP-3 (equation (4)) in the purified fraction were calculated.
The recovery rate(%) �W1
W0×100%, (3)
Proportion(%) � Tn
W1×100%, (4) whereW0(mg): weight of the crude FTP.W1(mg): the sum
of the weights of FTP-1, FTP-2, and FTP-3.Tn (mg): total
sugar content in FTP-n (n�1, 2,3).
2.11. Determination of Polysaccharides, Reducing Sugar, and Protein Content. The total sugar in fermentation broth was determined by the phenol-sulfuric acid method [23]. The reducing sugar in fermentation broth was determined by the DNS method [24]. The protein content was measured using the Bradford method with bovine serum albumin as a standard [25].
2.12. Infrared Analysis. The FTP was determined by infrared spectroscopy with the KBr tablet pressing method. The blank KBr tablets were used as the control group and scanned in the range of 4000-400 cm−1[26]. The spectral resolution is 4 cm−1.
Table1: Design of the single-factor experiment for a basic culture medium.
Trial run 1 2 3 4 5 Potato extract (%) 10.0 15.0 20.0 25.0 30.0 Glucose (g/L) 15.0 20.0 25.0 30.0 35.0 Peptone (g/L) 1.0 1.5 2.0 2.5 3.0 KH2PO4(g/L) 2.0 2.5 3.0 3.5 4.0 MgSO4·7H2O (g/L) 0.5 1.0 1.5 2.0 2.5 Vb1(mg/L) 6.0 7.0 8.0 9.0 10.0
Table2: Experimental level of the Plackett–Burman design.
Code Factor Units Low level (−1) High level (1)
A Potato extract % 20.00 25.00 B Glucose g/L 25.00 31.00 C KH2PO4 g/L 3.00 3.75 D MgSO4·7H2O g/L 1.50 1.90 E Vb1 mg/L 7.00 9.00 F Peptone g/L 2.50 3.10
Table3: Factors and levels for the Box–Behnken design.
Factor Name Units Low level (−1) Middle level (0) High level (1)
A Potato extract % 21.00 22.00 23.00
B Glucose g/L 28.48 29.32 30.16
2.13. Molecular Weight Determination. The molecular weight of FTP (0.2 mg/mL) was determined by high-per-formance size exclusion chromatography (HPSEC) [27]. The chromatographic column was a Waters Ultrahydrogel TM linear (7.8×300 mm, 10µm) gel column, the mobile phase was 0.1 mol/L NaNO3, the flow rate was 0.9 mL/min, the
column temperature was 45°C, and the loading volume was
20µL.
2.14. Monosaccharide Composition Analysis. HPAEC-PAD (high-performance anion-exchange pulsed amperometric detection chromatography) [28] was performed to deter-mine the monosaccharide composition and the molar ratio of FTP before and after optimization.
Sample hydrolysis: 5 mg/mL FTP (100µL) was hydro-lyzed with 4 mol/L trifluoroacetic acid (100µL) at 110°C for
2 h. Trifluoroacetic acid was rinsed with methanol (200µL), and residual methanol was rinsed with nitrogen. The residue was dissolved to 5 mL for sample analysis by ion chroma-tography (Waters600 liquid chromatograph, Waters, United States).
Chromatographic conditions: Dionex ICS5000 system; column: CarboPac PA20 (ID 3×150 mm); mobile phase: A, H2O; B, 250 mmol/L NaOH; and C, 1 mol/L NaAc, ternary
gradient elution; flow rate: 0.5 mL/min; pulsed ampero-metric detector (PAD); Au working electrode; Ag/AgCl reference electrode; injection volume: 20μL; and column temperature: 30°C.
2.15. Data Analysis. All experiments in this study were conducted in triplicates, and the data were presented as mean. Differences between groups were assessed using at -test. A P value less than 0.05 was considered statistically significant.
3. Results and Discussion
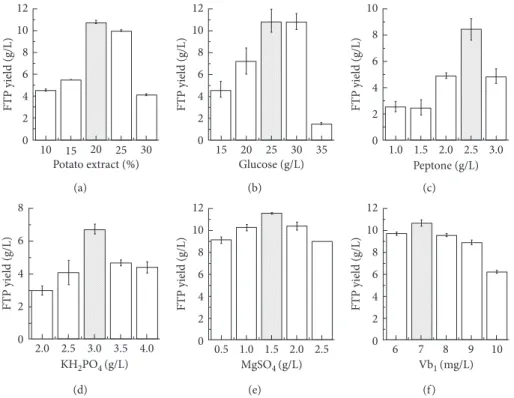
3.1. Single-Factor Experiments. The results (Figure 1) of the single-factor experiment have shown that the optimum range of components of the FTP medium should be as follows: potato extract 20%, glucose 25.0 g/L, peptone 2.5 g/ L, KH2PO4 3.0 g/L, MgSO4·7H2O 1.5 g/L, peptone 2.5 g/L,
andVb17.0 mg/L.
3.2. Plackett–Burman Test. The design and results of the Plackett–Burman experiment are shown in Table 4. The variance analysis of Plackett–Burman experimental results in Table 5 proves the reliability of the experimental results. The Plackett–Burman experimental model is significant (p<0.0001), and the missing item is not significant (p�0.3437), indicating that the measured and predicted values of FTP have a good fitting degree and can truly reflect the experimental results. Potato extract (p<0.0001), glucose (p<0.0001), and peptone (p�0.0005) have sig-nificant effects on the yield of FTP. Figure 2 also implies that potato extract, glucose, and peptone have significant effects on FTP yield, and the influence degree of each factor
is ranked. The order of effects from high to low was as follows: potato extract, glucose, peptone, KH2PO4,Vb1, and
MgSO4·7H2O. Therefore, potato extract (A), glucose (B),
and peptone (F) should be selected as the main factors for the steepest ascent experiment. Among them, potato ex-tract (A) and peptone (F) have negative effects on FTP yield, which means that the following optimization should start from the low level of the Plackett–Burman experi-ment. Glucose (B) has a positive effect on the output of FTP, which means that the higher the glucose content is, the more conducive it is to the production of FTP, and the follow-up optimization should start from the high level of the Plackett–Burman experimental design.
According to the results of the Plackett–Burman ex-periment, Design-Expert 7.0.1 also outputs the prediction equation of FTP yield.
Y(yield of FTP,g/L) �5.11−2.7A+1.89B−1.32F, (5)
where A: potato extract, %; B: glucose, g/L; and F: peptone, g/ L.
In equation (5), corresponding to Figure 2, the coeffi-cient of the independent variable represents its effect on the output of FTP. The positive coefficient of the independent variable indicated that the factor is not a risk factor, and the higher factor value would more easily promote the pro-duction of FTP. The coefficients of the factors determine the direction of the optimal pathways. According to the abovementioned results, the initial value of the climbing experiment should be set as potato extract (20%), glucose (31 g/L), and peptone (2.5 g/L).
3.3. Steepest Ascent Experiment. The experimental design and results are shown in Table 6. It is apparent that the yield of FTP showed a peak value when the concentrations of potato extract, glucose, and peptone were 22%, 29.32 g/L, and 2.68 g/L, respectively. At this point, the yield of FTP was close to the maximum reaction zone, so the data set was selected as the central value of the response surface opti-mization design.
3.4. Box–Behnken Design. The RSM design and results are recorded in Table 7. Figure 3 shows the interaction between the various factors in the medium when the yield of FTP and glucose utilization are, respectively, used as responses through contour plots.
The effects on FTP production of changes in the con-centration of potato extract and glucose are shown in Figure 3(a). High FTP production was recorded when the concentration of potato extract and glucose was from 21.5% to 22.5% and 28.4 g/L to 29.74 g/L, respectively. Similarly, from the contour plot (Figure 3(b)), it can be seen that potato extract and peptone approximately yield FTP be-tween 22% and 23% and 2.56 g/L and 2.65 g/L, respectively. In the contour plot (Figure 3(c)), FTP production has a simultaneous optimal region in the concentrations of glu-cose and peptone from 28.48 g/L to 29.32 g/L and 2.56 g/L to 2.65 g/L, respectively.
12 10 8 6 4 2 0 FTP yield (g/L) 10 15 20 25 30 Potato extract (%) (a) 12 10 8 6 4 2 0 FTP yield (g/L) 15 20 25 30 Glucose (g/L) 35 (b) 10 8 6 4 2 0 FTP yield (g/L) 1.0 1.5 2.0 2.5 3.0 Peptone (g/L) (c) 8 6 4 2 0 FTP yield (g/L) KH2PO4 (g/L) 2.0 2.5 3.0 3.5 4.0 (d) 12 10 8 6 4 2 0 FTP yield (g/L) MgSO4 (g/L) 0.5 1.0 1.5 2.0 2.5 (e) 12 10 8 6 4 2 0 FTP yield (g/L) Vb1 (mg/L) 6 7 8 9 10 (f ) Figure1: The bar graph of each single factor in the basic fermentation medium.
Table4: Experimental design and results of the Plackett–Burman experiment.
Trial run Potato extract (%) Glucose (g/L) KH2PO4(g/L) MgSO4·7H2O (g/L) Vb1(mg/L) Peptone (g/L) Y(g/L)
1 −1 1 1 −1 1 1 8.28 2 1 1 −1 1 1 1 3.03 3 0 0 0 0 0 0 4.71 4 1 1 1 −1 −1 −1 4.51 5 1 −1 1 1 1 −1 1.87 6 −1 −1 1 −1 1 1 3.35 7 0 0 0 0 0 0 5.91 8 −1 1 −1 1 1 −1 11.42 9 0 0 0 0 0 0 4.91 10 1 −1 1 1 −1 1 0.05 11 −1 1 1 1 −1 −1 10.94 12 −1 −1 −1 −1 −1 −1 8.75 13 1 −1 −1 −1 1 −1 1.15 14 1 1 −1 −1 −1 1 3.87 15 −1 −1 −1 1 −1 1 4.17
Table5: Variance analysis results of the Plackett–Burman experiment.
Source Sum of squares df Mean square F value pvalue prob>F
Model 151.6 3 50.53 61.19 <0.0001 Significant
A- potato extract 87.62 1 87.62 106.1 <0.0001
B- glucose 42.94 1 42.94 52 <0.0001
F- peptone 21.04 1 21.04 25.47 0.0005
Curvature 9.68×10⁻³ 1 9.68×10⁻³ 0.012 0.9159 Not significant
Residual 8.26 10 0.83
Lack of fit 7.43 8 0.93 2.25 0.3437 Not significant
Pure error 0.83 2 0.41
As shown in Figure 3, the effect of factors on glucose utilization was complex. When the concentration of potato extract was in the range of 21%∼21.75% and glucose was in the range of 29 g/L∼30 g/L, an increase in the glucose uti-lization ratio was observed in Figure 3(d). Also, potato extract and peptone approach the maximum reaction center of glucose utilization between 21%∼22% and 2.56 g/L to 2.65 g/L, respectively (Figure 3(e)). In the contour plot (Figure 3(f )), the glucose utilization ratio has an optimal
region in the concentrations of glucose and peptone from 29 g/L to 30 g/L and 2.56 g/L to 2.65 g/L, respectively.
3.5. Regression Model Fitting and Variance Analysis. As shown in Table 8, when the yield of FTP and glucose uti-lization were used as the response values, the probability of the regression model>Fvalue was 0.0004 and 0.0027, re-spectively. The results indicated that this model could
Table6: Design and results of the steepest ascent experiment.
Test no. 1 2 3 4 5
Potato extract(%) 20.00 21.00 22.00 23.00 24.00
Glucose(g/L) 31.00 30.16 29.32 28.48 27.64
Peptone(g/L) 2.50 2.56 2.62 2.68 2.74
Yield(g/L) 12.05 12.60 13.92 11.54 11.48
Table7: Experimental design and results of Box–Behnken.
Trial run Potato extract Glucose Peptone Y(g/L) U(g/L)
1 0 1 −1 11.83 86.88 2 1 −1 0 12.23 81.53 3 1 0 1 11.59 88.63 4 1 0 −1 12.14 82.75 5 0 0 0 12.20 79.28 6 −1 −1 0 11.86 83.88 7 0 0 0 12.44 77.30 8 0 0 0 12.36 76.90 9 −1 0 −1 11.57 89.29 10 −1 0 1 11.40 85.72 11 0 −1 −1 12.41 79.37 12 −1 1 0 10.68 87.38 13 1 1 0 12.00 84.20 14 0 1 1 11.40 82.77 15 0 0 0 12.42 76.74 16 0 0 0 12.35 77.98 17 0 −1 1 12.04 80.04 Positive effects Negative effects Pareto chart Bonferroni limit 4.10481 t-value limit 2.36462 D E C F B A 9.91 8.81 7.70 6.60 5.50 4.40 3.30 2.20 1.10 0.00 t-val ue o f |ef fe ct| 1 2 3 4 5 6 7 8 9 10 11 Rank
Figure2: Pareto chart of the Plackett–Burman design for the FTP yield. (A) Potato extract, (B) glucose, (C) KH2PO4, (D) MgSO4·7H2O, (E) Vb1, and (F) peptone.
11 11.5 12 5 30.16 29.74 29.32 28.90 28.48 21.00 21.50 22.00 22.50 23.00 A: potato extract B: g lucos e Yield of FTP (a) 11.4 11.6 11.8 12 12.2 12.4 11.6 11.8 5 2.68 2.65 2.62 2.59 2.56 21.00 21.50 22.00 22.50 23.00 A: potato extract C: p ep to n e Yield of FTP (b) 2.68 2.65 2.62 2.59 2.56 23.48 28.90 29.32 29.74 30.16 Yield of FTP 11.6 B: glucose C: p ep to n e 11.8 12 12.2 5 12.4 (c) 30.16 29.74 29.32 28.90 28.48 21.00 21.50 22.00 22.50 23.00 A: potato extract 82 84 86 86 88 5 B: g lucos e
Reducing sugar utilization ratio
(d) Figure3: Continued.
predict the FTP yield and the utilization rate of reducing sugar reliably. The model prediction equations are given as follows: Y�12.35+0.31×A−0.33×B−0.19×C+0.24×A×B−0.094×A×C−0.014 ×B×C−0.45×A2−0.21×B2−0.23×C2, (6) U�87.64−1.15×A+2.05×B−0.14×C−0.21×A×B+2.36×A×C−1.20×B ×C+0.47×A2−3.86×B2−1.51×C2, (7) 2.68 2.65 2.62 2.59 2.56 21.00 21.50 22.00 22.50 23.00 A: potato extract C: p ep to n e 90 86 88 5 86 84 Reducing sugar utilization ratio
(e) 2.68 2.65 2.62 82 84 86 2.59 2.56 80 28.48 28.90 29.32 29.74 86 30.16 5 86 84
Reducing sugar utilization ratio
C: p ep to n e B: glucose (f )
Figure3: (a∼c) Contour plots of yield of FTP showing interactions between potato extract and glucose (a), potato extract and peptone (b), and glucose and peptone (c). (d∼f ) The interaction effect of variables on reducing the glucose utilization ratio.
Table8: ANOVA for the response surface polynomial model of all independent variables.
Factor FTP yield (Y) Glucose utilization ratio (U)
SS F value Prob>F SS F value Prob>F
Model 3.55 18.42 0.0004 147.8 10.49 0.0027 A- potato ex. 0.75 35.22 0.0006 10.51 6.72 0.0359 B- glucose 0.86 40.21 0.0004 33.59 21.47 0.0024 C- peptone 0.29 13.57 0.0078 0.17 0.11 0.7537 AB 0.22 10.43 0.0145 0.17 0.11 0.7492 AC 0.036 1.67 0.2377 22.3 14.25 0.0069 BC 8.04×10⁻⁴ 0.038 0.8519 5.72 3.65 0.0976 A2 0.86 40.33 0.0004 0.93 0.59 0.4666 B2 0.18 8.52 0.0224 62.83 40.15 0.0004 C2 0.22 10.12 0.0155 9.6 6.13 0.0424 Residual 0.15 10.95 Lack of fit 0.11 4.11 0.1027 6.68 2.08 0.2452 Pure error 3.70×10⁻² 4.28
where Y is the FTP yield and U is the glucose utilization ratio and A, B, and C are the coded values of potato extract, glucose, and peptone, respectively.
WhenYandUare at their maximum, the concentrations ofA,B, andCare the optimal concentrations of the medium.
When the p value is greater than 0.1, it is an insignificant factor (Table 8). After removing the insignificant factors, the following equations are obtained:
Y�12.35+0.31×A−0.33×B−0.19×C+0.24×A×B−0.45×A2−0.21×B2−0.23×C2, (8) U�87.64−1.15×A+2.05×B+2.36×A×C−1.20×B×C−3.86×B2−1.51×C2. (9)
The optimal predicted value can be obtained from equations (8) and (9). When the reducing sugar utilization rate (87.73%) and the yield of FTP (12.36 g/L) reached the maximum at the same time, the concentration of potato extract (A/22.01%), glucose (B/29.38 g/L), and peptone (C/ 2.61 g/L) was the optimal combination.
3.6. Production of Crude FTP in a 5L Fermentor. The results of the scale-up fermentation experiments are presented in Figure 4. The maximum biomass of the optimized medium reached 1.52 g/L, which was 0.61% lower than that of the control group. However, the FTP production increased from 10.75 g/L to 12.50 g/L after 72 h of fermentation, which was 116.27% higher than the control. Moreover, the yield of FTP (12.50 g/L) was consistent with the predicted value of 12.36 g/L. Furthermore, the fermentation cycle was signif-icantly shorter than before optimization. The optimized group ushered in an important turning point after fer-mented for three days. At this point, the consumption rate of reducing sugar began to decline (Figure 4(a)), FTP accu-mulated rapidly (Figure 4(b)), and GT2# multiplied rapidly (Figure 4(c)); all of these phenomena indicated that Tremella spores grow and metabolize very vigorously on the third day of fermentation. After the medium was optimized, the fermentation was finished on the third day, two days earlier than the control, which shortened the fermentation cycle greatly.
3.7. Purification of FTP. The results of homogeneous polysaccharide components obtained from the purification of crude FTP are shown in Figure 5. The crude FTP contains three components, among which the neutral polysaccharide components eluted by distilled water were in tubes 15∼22, the weakly acidic polysaccharide components were in tubes 37∼50, and the acidic polysaccharide components were collected in tubes 58∼75, which are recorded as 1, FTP-2, and FTP-3 in turn (Figure 5(a)). The optimized FTP peak position shifted slightly to the left, indicating that the proportion of neutral polysaccharide increased. In addition, the three peaks of the optimization group were all sym-metrical single peaks with obvious boundaries, indicating that the separation effect was significantly higher than that of the control group.
As shown in Figure 5(b), the total sugar content of FTP-1, FTP-2, and FTP-3 only accounts for 84.69% of the total
mass of the purified FTP components, indicating that the control group has many impurities and contains compo-nents that are difficult to be separated. After optimization, the FTP recovery rate was 30.07%, which is 21% higher than that of the control group (24.78%). Among them, the proportion of acid polysaccharide components was 66.18%, which was 1.17 times higher than that before optimization (56.46%). Current studies have shown that acidic polysac-charides are the main active components of FTP. Even in the optimized medium, the content of acid polysaccharide produced by Tremella spores was still lower than that of mycelia (75.32%) and frustums (94.66%) [15]. However, the total output (8.19 g/L) can make up for its deficiency in content, so it is feasible to produce highly active FTP using the optimized medium.
3.8. Total Sugar and Protein Content Change. The total sugar and protein contents of FTP-3 before and after optimization are summarized in Figure 6. After optimization, the protein decreased and the total sugar increased. Therefore, the optimization had a high production of total sugar, and the purification efficiency can be improved by reducing protein production.
3.9. Effect of Medium Optimization on Mw. TheMWof the
FTP before and after optimization was measured (Table 9). The size and distribution of the molecular weight of FTP in the optimized group changed. Mwand Mnincreased to some
extent. The parameter Mw/Mn indicates the distribution
range of the molecular weight of the sample, while Mw/Mnof
the optimized group becomes smaller, indicating that the molecular weight range of FTP in the optimized group is narrower, that is, it has better uniformity. The parameter (%/area) indicates that the FTP in the control group contains impurities of different molecular weights, which may be caused by the protein (7.20±0.27%) it contains (Figure 6). However, the protein content in the optimized group was very small (1.17±0.15%), so the molecular weight distri-bution was not affected obviously (Figure 6). The molecular weight of FTP obtained by submerged fermentation is much smaller than that of the polysaccharides of Tremella fruit bodies reported in the literature (7.8×10⁵) [29]. Small molecules of Tremella polysaccharides can play a more important role in drug delivery systems.
3.10. Infrared Spectrum Analysis. Infrared spectra showed that FTPs in the control and optimized group had a similar structure except for the peak at 850 cm−1 (Fig-ure 7). The optimization group is taken as an example to illustrate the analytical infrared spectrum. A strong and wide absorption peak at 3700–3000 cm−1 indicates the
existence of the O-H stretching bond. The weak C-H stretching vibration peak at 2932 cm−1is the characteristic absorption peak of carbohydrates, indicating that meth-ylene is contained, and the asymmetric C�O stretching vibration peak at 1648 cm−1indicates that the sample has a pyran ring structure. The band at 1730.0 cm−1 indicates the presence of methyl ester groups, while the band at 1650 cm−1 indicates the presence of aminoacyl groups [30]. The strong absorption peak between 1500 cm−1and 1700cm-1 is the characteristic absorption peak of poly-galactose [31]. The peak at 1100 cm−1was superposed by angular vibration absorption peaks of alcohol hydroxyl-OH and C-O stretching vibration. The absorption peak of the optimized group at 902 cm−1 means that it has a ß -glycosidic bond structure. Also, in the control group, the characteristic absorption peak of thea-glycosidic bond is at 850 cm−1. 30 27 24 Red ucin g suga r (g/L) 21 18 15 12 9 6 3 0 0 1 2 3 4 5 6 7 Fermentation time (d) Control Optimized (a) Control Optimized 7 6 5 4 3 2 1 0 14 12 10 FTP yield (g/L) 8 6 4 2 0 Fermentation time (d) (b) Control Optimized 3.0 2.5 Dr y w eig h t o f GT2# (g/L) 2.0 1.5 1.0 0.5 0.0 0 1 2 3 4 5 6 7 Fermentation time (d) (c)
Figure4: Comparison of fermentation in an optimized and preoptimized medium in a 5 L fermentor. (a) RG (reducing sugar), (b) FTP yield, and (c) dry weight of GT2#.
3.0 2.5 2.0 1.5 1.0 0.5 0.0 A490 0 20 40 60 80 100 Tube Control Optimized (a) Control Optimized FTP-3 FTP-2 FTP-1 80 60 P er cen t (%) 40 20 0 (%) Control Optimized FTP-1 FTP-2 FTP-3 Total 13.81 14.44 56.44 84.69 100.54 66.19 13.36 20.99 (b)
Figure5: Isolation and purification of crude FTP. (a) The DEAE-Sepharose fast flow ion exchange chromatography elution curve for FTP in the control and optimized group. (b) The proportion of FTP-1, FTP-2, and FTP-3 in all purified components.
7.20 ± 0.27 1.17 ± 0.15 94.18 ± 2.54 81.04 ± 2.46 100 80 60 40 20 0 P er cen t (%) Control
Total sugar content Protein content
Optimized
Figure6: The change of total sugar content and protein content.
Table9: Molecular weight.
Sample Mw Mn Mw/Mn %/area
Control 16236 9760 1.66 94.99
Optimized Control 3420 2926 2932 3419 1730 1648 1542 1375 1219 850 599 1072 1743 1315 1242 902 1416 1550 1103 600 1648 1000 2000 3000 4000 Wavenumber (cm–1) T ra n smi tt an ce (%) 100 95 90 85 80 75 70 100 95 90 85 80 75 70 Control Optimized
Figure7: FT-IR spectra of FTP in the control and optimized group.
120.0 112.5 100.0 87.5 75.0 62.5 50.0 37.5 25.0 12.5 0.0 –12.5 –20.0 0.0 5.0 10.0 15.0 20.0 25.0 30.0 1 2 3 4 5 6 7 8 9 10 1 Fucose Arabinose Rhamnose 2 3 4 Galactose Glucose 5 Xylose 6 Mannose Fructose 7 8 9 Galacturonic acid Glucuronic acid 10 min nC (a) Figure8: Continued.
Glucosamine nC 200 175 150 125 100 75 50 25 0 –28 1.2 2.5 5.0 7.5 10.0 12.5 15.0 17.5 20.0 22.5 23.6 min (b) Arabinose Galactose Glucose Rhamnose Glucosamine nC 34.1 30.0 25.0 20.0 15.0 10.0 5.0 0.0 –5.0 –10.0 –14.0 0.2 2.5 5.0 7.5 10.0 12.5 15.0 17.5 20.6 min (c) nC Glucose 45.2 40.0 30.0 20.0 10.0 0.0 –10.0 –14.5 0.1 5.0 10.0 15.0 20.0 24.5 min Galacturonic acid Galactose Rhamnose Glucosamine (d)
Figure8: Monosaccharide composition of FTP. (a) 10 standard monosaccharide profiles. (b) Chromatogram of glucosamine standard. (c) The monosaccharide composition of the control group. (d) The monosaccharide composition of the optimized group.
3.11. Monosaccharide Composition Change. The monosac-charide composition of FTP in the control and optimized group is shown in Figure 8. The monosaccharides in the control group were arabinose, rhamnose, glucosamine, galactose, and glucose. The monosaccharide composition of the optimization group was glucosamine, rhamnose, ga-lactose, glucose, and galacturonic acid. Compared with the control group, the specificity of the optimized group was manifested in the presence of a galacturonic acid structure and the absence of arabinose, which was correlated with the increase of acid polysaccharide content in the optimized group (Figure 5). The monosaccharide types in the control group and the optimized group were similar, but the pro-portion was different. The content of glucosamine and ga-lactose is decreased, and that of glucosamine and glucuronic acid is increased. This result implies that the change of the culture medium formula can affect the primary structure of FTP.
4. Conclusions and Prospect
The optimized medium combination of Tremella GT2# was determined to be potato extract 22.01%, glucose 29.38 g/L, peptone 2.61 g/L, KH2PO43 g/L, MgSO4·7H2O 1.5 g/L, and
Vb17 mg/L. The optimized comprehensive potato medium
has high yield of FTP and a high utilization rate of reducing sugar to reduce resource waste. Compared with the existing level of FTP (4 g/L), the production was improved to 12.36 g/L [12–14]. Also, the fermentation period was re-duced from 120 h to 72 h. The increase in production and the shortening of the fermentation cycle were an important breakthrough for the industrialization of FTP. Potato ex-tract, glucose, and peptone were the factors that have the greatest impact on the productivity of FTPs. In addition, the composition and structure of FTPs have also been significantly affected. The FTPs obtained after optimization have a higher acidic polysaccharide content (66.19%) and a lower protein content (1.17%). The molecular weight and functional groups of FTP did not change significantly before and after optimization, but the composition of monosaccharides changed, and the configuration of polysaccharides changed from a-configuration to ß -configuration.
Previous studies have proved that acidic Tremella polysaccharide has a variety of biological activities, including immune activity [32], moisture retention [8], and anti-obesity activity [33]. Therefore, the optimized medium is of great significance in the production of active Tremella polysaccharide and fermentation-enabled wellness foods and functional fermented foods [34]. Regarding the reasons for the changes in the FTP structure, a detailed research plan will be proposed in the future work. In addition, the rela-tionship between the biological activity of FTP and its structure should also receive further attention.
Data Availability
The data used to support the findings of this study are in-cluded within the article.
Disclosure
Xia Ma, Meng Yang, and Yan He are the co-first authors.
Conflicts of Interest
The authors declare that there are no conflicts of interest regarding the publication of this paper.
Authors’ Contributions
All the authors have made substantive intellectual contri-butions to the study and given approval to the final version of the manuscript. Xia Ma and Meng Yang mainly con-tributed to the study design, manuscript revision, experi-mental studies, and statistical analysis; Yan He contributed to the supervision and project administration; Chengliang Li contributed to the funding acquisition; and Chuntao Zhai polished and revised the first draft.
Acknowledgments
The authors gratefully acknowledge the financial support from the Open Project Program of the State Key Laboratory of Dairy Biotechnology (No. SKLDB2013-09), the Open Project Program of the National R & D Center for Edible Fungus Processing Technology (20200110), and the Shanghai Science and Technology Commission Project (18495810900).
References
[1] R. U. A. N. Yang, L. I. Hong, L. Pu et al., “Tremella fuciformis polysaccharides attenuate oxidative stress and inflammation in macrophages through miR-155,”Analytical Cellular Pa-thology, vol. 2018, pp. 8316–8324, Article ID 5762371, 2018. [2] Z.-W. Shi, Y. Liu, Y. Xu et al., “Tremella Polysaccharides
attenuated sepsis through inhibiting abnormal
CD4 + CD25high regulatory T cells in mice,” Cellular Im-munology, vol. 288, no. 1-2, pp. 60–65, 2014.
[3] Y. Zhou, X. Chen, R. Yi et al., “Immunomodulatory effect of tremella polysaccharides against cyclophosphamide-induced immunosuppression in mice,”Molecules, vol. 23, no. 2, p. 239, 2018.
[4] X. Shi, W. Wei, and N. Wang, “Tremella polysaccharides inhibit cellular apoptosis and autophagy induced by Pseudomonas¨ı¿½aeruginosa lipopolysaccharide in A549 cells through sirtuin 1 activation,” Oncology Letters, vol. 15, pp. 9609–9616, 2018.
[5] J. Yan, L. Zhu, Y. Qu et al., “Analyses of active antioxidant polysaccharides from four edible mushrooms,”International Journal of Biological Macromolecules, vol. 123, no. 3, pp. 945–956, 2019.
[6] X. Chen, Q. Tang, Y. Chen, W. Wang, and S. Li, “Simulta-neous extraction of polysaccharides from poria cocos by ultrasonic technique and its inhibitory activities against ox-idative injury in rats with cervical cancer,” Carbohydrate Polymers, vol. 79, no. 2, pp. 409–413, 2010.
[7] E. Bach, S. Costa, H. Oliveira et al., “Use of Polysaccharide extracted from Tremella fuciformis Berk for control diabetes induced in rats,”Emirates Journal of Food and Agriculture, vol. 27, no. 7, pp. 585–591, 2015.
[8] C.-P. Lin and S.-Y. Tsai, “Differences in the moisture capacity and thermal stability of tremella fuciformis polysaccharides obtained by various drying processes,” Molecules, vol. 24, no. 15, p. 2856, 2019.
[9] A. T.-B. Nguyen, M. Nigen, L. Jimenez, H. Ait-Abderrahim, S. Marchesseau, and L. Picart-Palmade, “Performances of different protocols for exocellular polysaccharides extraction from milk acid gels: application to yogurt,”Food Chemistry, vol. 239, pp. 742–750, 2018.
[10] Li Zhang,Study on the Industrialized Cultivation Technique of Tremella, Shanxi Agricultural University, Shanxi, China, 2016. [11] Z. Lin, J. Ma, B. Chai et al., “Pharmacological study on Tremella: preliminary study on fermentation liquid and polysaccharide of Tremella fuciformis,”Journal of Traditional Chinese Medicine, vol. 3, pp. 56–58, 1981.
[12] Qilu University of Technology, Method For Extracting Tremella Polysaccharide And Tremella Protein: cn 102876750 a, Qilu University of Technology, Jinan, China, 2013. [13] China University of Petroleum,Method For Fermenting And
Producing Tremella Polysaccharides By Adopting Constant Ph Feeding Strategy: cn102041285b, China University of Petro-leum, Beijing, China, 2013.
[14] China University of Petroleum,Method For Fermenting To Produce Tremellan By Staged Ph Value Control Policy:cn 102041286a, China University of Petroleum, Beijing, China, 2011.
[15] R. Wang, J. Yan, X. Wu et al., “Effects of submerged fer-mentation on acidic polysaccharides inTremella fuciformis mycelia,”Food Science, vol. 21, pp. 170–172, 2009.
[16] D. Wu, J. Zhang, and X. Yang, “Study on submerged fer-mentation conditions of tremella fuciformis,”Food Science, vol. 23, no. 1, pp. 64–69, 2002.
[17] Y. Yuan, L. Shan, W. U. Yao et al., “Effect of culture conditions on the biomass and exopolysaccharide production by my-celium of Tremella fuciformis,” Science and Technology of Food Industry, vol. 2, pp. 242–244, 2010.
[18] L. Ruan, D. Su, S. Shan et al., “Effects of different conditions on the yield of polysaccharides and spores from tremella fuciformis[J],”Edible Fungi of China, vol. 34, no. 3, pp. 47–50, 2015.
[19] Y. Guo, X. Ye, B. Gan et al., “Study on the mycelial germi-nation of Tremella fuciformis spores on different media,” Southwest China Journal of Agricultural Sciences, vol. 25, pp. 1794–1797, 2012.
[20] S. Ukai, K. Hirose, T. Kiho et al., “Antitumor activity on sarcoma 180 of the polysaccharides from tremella fuciformis BERK,”Chemical & Pharmaceutical Bulletin, vol. 20, no. 10, pp. 2293-2294, 1972.
[21] Y. Zhu, “Optimization method of microbial medium and its OPTI Optimization Software,” Foreign Journal of Medical Antibiotics, vol. 20, pp. 58–61, 1999.
[22] Shanghai Institute of Technology, Method for extracting Tremella polysaccharide from fermentation broth: CN201910265408, Shanghai Institute of Technology, Shang-hai, China, 2019.
[23] H.-F. Zhang, L.-L. Niu, X.-H. Yang, and L. Li, “Analysis of water-soluble polysaccharides in an edible medicinal plant epimedium: method development, validation, and applica-tion,” Journal of Aoac International, vol. 97, no. 3, pp. 784–790, 2014.
[24] J. Wang, S. Zhang, B. Yang et al., “Application of 3, 5-dini-trosalicyiic acid(dns)method to test the reducing sugar and water-soluble total sugar content in sugarcane internodes,” Sugarcane and Canesugar, vol. 5, pp. 45–49, 2008.
[25] M. M. Bradford, “A rapid and sensitive method for the quantitation of microgram quantities of protein utilizing the principle of protein-dye binding,” Analytical Biochemistry, vol. 72, pp. 248–254, 2007.
[26] J. Xie, L. Zou, X. Luo et al., “Structural characterization and immunomodulating activities of a novel polysaccharide from nervilia fordii,” International Journal of Biological Macro-molecules, vol. 114, pp. 520–528, 2018.
[27] P. Conte and A. Piccolo, “High pressure size exclusion chromatography (HPSEC) of humic substances: molecular sizes, analytical parameters, and column performance,” Chemosphere, vol. 38, pp. 520–528, 1999.
[28] J.-H. Xie, M.-Y. Shen, S.-P. Nie, X. Liu, H. Zhang, and M.-Y. Xie, “Analysis of monosaccharide composition of Cyclocarya paliurus polysaccharide with anion exchange chromatography,” Carbohydrate Polymers, vol. 98, no. 1, pp. 976–981, 2013.
[29] D.-T. Wu, Y. Deng, J. Zhao, and S.-P. Li, “Molecular char-acterization of branched polysaccharides from Tremella fuciformis by asymmetrical flow field-flow fractionation and size exclusion chromatography,” Journal of Separation Sci-ence, vol. 40, no. 21, pp. 4272–4280, 2017.
[30] J.-Y. Qian, W. Chen, W.-M. Zhang, and H. Zhang, “Adul-teration identification of some fungal polysaccharides with SEM, XRD, IR and optical rotation: a primary approach,” Carbohydrate Polymers, vol. 78, no. 3, pp. 620–625, 2009. [31] M. Kozarski, A. Klaus, M. Niksic, D. Jakovljevic,
P. F. G. Helsper, and L. J. L. D. Van Griensven, “Antioxidative and immunomodulating activities of polysaccharide extracts of the medicinal mushrooms agaricus bisporus, Agaricus brasiliensis, ganoderma lucidum and phellinus linteus,”Food Chemistry, vol. 129, no. 4, pp. 1667–1675, 2011.
[32] X. Shi, W. Wei, and N. Wang, “Tremella polysaccharides inhibit cellular apoptosis and autophagy induced by Pseu-domonas aeruginosalipopolysaccharide in A549 cells through sirtuin 1 activation,” Oncology Letters, vol. 15, no. 6, pp. 9609–9616, 2018.
[33] C. Xu, J. Y. Diao, and S. M. Wang, “Recent progress in pharmacological studies of polysaccharide from tremella fuciformis berk,”Pharmacy Today, vol. 28, no. 3, pp. 207–210, 2018.
[34] H. Xiang, D. Sun-Waterhouse, G. I. N. Waterhouse, C. Cui, and Z. Ruan, “Fermentation-enabled wellness foods: a fresh perspective,”Food Science and Human Wellness, vol. 8, no. 3, pp. 203–243, 2019.