COMPUTER MODELLING & NEW TECHNOLOGIES 2014 18(6) 261-270 Grekul V, Baydalina L
A forecasting model of the economic efficiency of data centre
construction project
V Grekul*, L Baydalina
National Research University Higher School of Economics, 20 Myasnitskaya Ulitsa, Moscow, 101000, Russia Received 1 June 2014, www.tsi.lv
Abstract
Today, a data centre is the main instrument for providing flexible, scalable IT services to business on the basis of distributed or cloud computing technologies. Building a data centre is always expensive and resource-intensive project. Therefore, during the development of the concept of this project it is extremely important to estimate accurately its economic efficiency. This article represents the model for the analysis of the effectiveness of investment in the data centre construction. Our model comprises several regressions that show correlations between main characteristics of the project (capital and operational expenditures, Net Present Value) and parameters of the data centre under construction (data centre area and the number of racks). The model is based on the results of the analysis of the current state and trends in the data centre market in Russia.
Keywords: datacentre, price, project, CAPEX, OPEX
1 Introduction
The problem of forecasting a capital expense to build and an operating expense to run and maintain a data centre attracts attention of many experts and organizations. In recent years a variety of activities were aimed at developing methodologies and tools for solving this problem [1-5]. However, they do not take into account the specifics of the Russian market, and usually do not estimate potential revenue of the data centre. In our work we collected and systematized the information about the construction and operation of more than 70 data centres in Russia. On this basis we have developed the model for preliminary evaluation of the data centre creation project.
We presume that any evaluation of the effectiveness of investment consists of comparing the income from the use of the system with the cost of its implementation and support.
Integrated view on the costs of creating and supporting data centre can be obtained on the basis of
valuation technique Total Cost of Ownership (TCO) [6], which highlights all costs that arise both during the data centre creation and while providing services to consumers.
Assessing the income of data centre one should take into account features of pricing, as well as the current status and trends in the structure of services provided.
The final step in the assessment is the discounting of possible cash flows of the data centre project that allows to determine the effectiveness of investment by calculating the most common indicators of Net Present Value (NPV) and Internal Rate of Return (IRR).
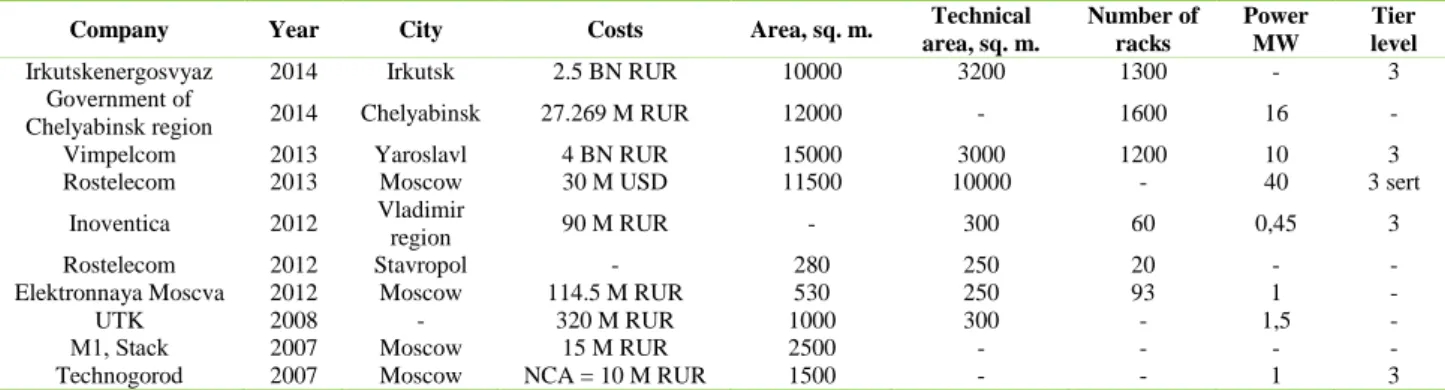
Initial data for this model were collected from publications, materials of analytical studies and from database "SPARK-Interfax» (SPARK – Professional market and company analysis system). A fragment of original table that contains data about 77 projects is listed in Table 1. Missing project data are marked by "-".
TABLE 1Data of projects of datacentres construction
Company Year City Costs Area, sq. m. Technical
area, sq. m. Number of racks Power MW Tier level
Irkutskenergosvyaz 2014 Irkutsk 2.5 BN RUR 10000 3200 1300 - 3
Government of
Chelyabinsk region 2014 Chelyabinsk 27.269 M RUR 12000 - 1600 16 -
Vimpelcom 2013 Yaroslavl 4 BN RUR 15000 3000 1200 10 3
Rostelecom 2013 Moscow 30 M USD 11500 10000 - 40 3 sert
Inoventica 2012 Vladimir
region 90 M RUR - 300 60 0,45 3
Rostelecom 2012 Stavropol - 280 250 20 - -
Elektronnaya Moscva 2012 Moscow 114.5 M RUR 530 250 93 1 -
UTK 2008 - 320 M RUR 1000 300 - 1,5 -
М1, Stack 2007 Moscow 15 M RUR 2500 - - - -
COMPUTER MODELLING & NEW TECHNOLOGIES 2014 18(6) 261-270 Grekul V, Baydalina L As can be seen from this fragment, project data are
often incomplete: for example, information can be available about capital expenses and area of datacentre, but there can be no data about quantity of racks. In this case it is possible to use relations identified from the market research performed by iKS-Consulting company (2012): the ratio of the area of datacentre and quantity of racks is usually 3.5 sq. m. per rack.
In some projects in the "cost" column we can meet acronym NCA. This means that the cost of the project was not disclosed, but the analysis of the data from the SPARK-Interfax allowed to detect an increase in the cost of Non-Current Assets (NCA) during construction of the data centre. As a result, we used different sets of projects to develop different models presented in the article.
Prices were transferred to a common currency (U.S. dollars), and to the level of prices of 2013 using the index of prices for machinery and equipment used in the construction [7].
2 Estimation of the cost of data centre construction
The expenditure part of the project includes the capital and operating costs.
Summarizing research materials about the cost structure [3, 8-11] we recorded the following components of the data centre construction cost:
1. Construction of the building (~ 10-15%). 2. Electrical power input (~ 20-25%). 3. Diesel Generating Set (DGS) (~ 0-5%). 4. Optical cable (~ 0-5%).
5. Service equipment (~ 60-65%). (Uninterruptible power supply, cooling system, raised floor, networking equipment, etc.).
To construct a regression model of the data centre construction cost we have collected and processed data of 77 data centres.
This data included the following parameters: data centre location (Moscow / St. Petersburg /other Regions of the Russian Federation), year of construction, data centre space, number of racks, total cost of construction, Tier level.
In the analysis were included data centres of the most popular in Russia Tier 3 level.
To estimate the cost of the construction we selected the following indicators as the basic parameters of a data centre:
Planned space of a data centre (S) Expected number of racks (N)
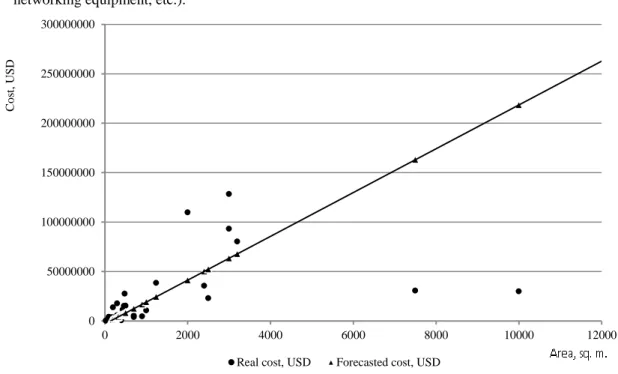
Then the value of CAPEX (CAPital EXpenditure) can be defined by the following relations obtained in the form of regression models (for all projects in Russia). Dependence of CAPEX on the data centre area: .
Characteristics of the regression model: R2 = 0.72, P-value for S is 4.73E-11. P -P-value for the free variable 0.76. This means that, despite the fact that the cost of construction (CAPEX) is negative when datacentre area is smaller than 129 sq. m., this coefficient is not significant statistically. At the same time, such a small P- value for the coefficient S allows us to state with confidence that the cost of construction per sq. m. lies between 19.797 – 24.475 dollars (with a standard error of $ 2339). This result correlates well with the experts estimations of CAPEX: 15-25 thousand dollars per 1 sq. m. (iKS-Consulting company (2012)). Figure 1 shows the model in a graphical form.
FIGURE 1 The regression model of dependence of CAPEX on the area of data centre 0 50000000 100000000 150000000 200000000 250000000 300000000 0 2000 4000 6000 8000 10000 12000
Real cost, USD Forecasted cost, USD
C o st , U S D
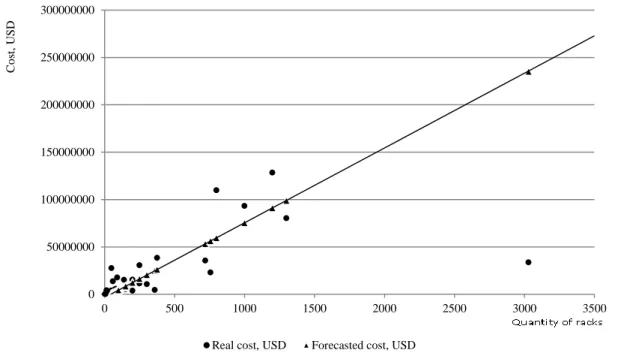
COMPUTER MODELLING & NEW TECHNOLOGIES 2014 18(6) 261-270 Grekul V, Baydalina L Dependence of CAPEX on the on the quantity of
racks in the data centre:
.
Characteristics of regression model: (R2 = 0.8, P-value for N is 2.01E-13. P-P-value for the free variable is 0.67). The cost of construction per one rack lies between
71 994 - 85 508 USD (with the standard error equals to $6757). The resulting cost of construction per one rack is about 3.5 times more than the cost of construction per one sq. m. of a data centre area. It is practically equal to the ratio adopted in marketing research. Figure 2 shows the model in a graphical form.
FIGURE 2 The regression model of dependence of CAPEX on the quantity of racks Separate regression models for groups of data,
classified by location of a data centre, were also formed. For Moscow city we have got:
.
Characteristics of regression model: R2 = 0.7, P-value for S is 0.002.
.
Characteristics of regression model: R2 = 0.77, P-value for N is 0.0009.
For other regions of Russian Federation we have got: .
Characteristics of regression model: R2 = 0.88, P-value for S is 7.93E-09.
.
Characteristics of regression model: R2 = 0.99, P-value for N is 5.38 E-17.
Deviations of calculated data from the average values of the entire sample are shown in Table 2.
TABLE 2 Cost of building data centre in geographical segmentation
Location of a datacentre Moscow Regions Russia
Average cost of construction of 1 sq. m. (total CAPEX of sample / total S) 19 686 22 890 22 291 Average cost of construction of 1 rack (total CAPEX of sample / total N) 62 080 85 400 80 407
The forecasted cost of construction per 1 sq. m. 22 612 26 586 22 136
The forecasted cost of construction per1 rack 73 616 95 935 78 751
Confidence interval for the forecasted cost of construction per1 sq. m. 17 388 – 27 836 24 153 – 29 019 19 797 – 24 475 Confidence interval for the forecasted cost of construction per1 rack 59 201 – 88 031 93 366 – 98 502 71 994 – 85 508
Average datacentre area 1 583 1041 1258
Average quantity of racks 509 242 349
Deviation of the cost of construction per 1 sq. m. 13% 14% -1%
Deviation of the cost of construction per 1 rack 16% 11% -2%
Due to the lack of representativeness of the sample it was not possible to include in the regression model such parameters as the Tier level and creation time.
The influence of the Tier level on the cost of a data centre construction can be represented by multiplying the value of obtained CAPEX by the correction coefficient 0 50000000 100000000 150000000 200000000 250000000 300000000 0 500 1000 1500 2000 2500 3000 3500
Real cost, USD Forecasted cost, USD
C o st , U S D
COMPUTER MODELLING & NEW TECHNOLOGIES 2014 18(6) 261-270 Grekul V, Baydalina L (Cc) which values were obtained on the basis of research
[12]:
Cc = 0.8 for the Tier 2 level, Cc = 1 for the Tier 3 level, Cc = 1.8 for the Tier 4 level.
To take into account the effect of time on the cost it is possible to use the research results presented in [21]. It shows that the construction cost of 1 square meter increases by about 30% per year.
Thus, the cost of building of a data centre in the year G may be defined by the relation:
.
3 Estimation of the cost of data centre operation
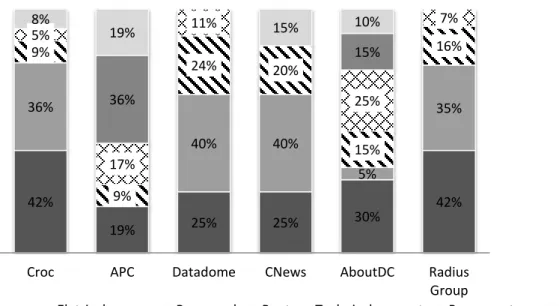
There is a considerable difference in the structure of operating costs of Russian [3, 13-15] and overseas data centres [2, 12] (see Figure 3).
FIGURE 3 Structure of a data centre operational expenditures The differences in OPEX (OPerational EXpenditure)
structure are caused by different approaches to clustering subgroups of operating costs, as well as the specifics of the Russian economy (in particular, the difference in wages, energy costs, etc.). However, every research includes energy costs, rent, staff and technical support in the cost of data centre operation. Other subgroups of operating costs can vary considerably and for our purposes they are integrated into the group of "other expenses".
We assume that the operating costs are divided into 5 groups:
1. Electricity payments (~ 40-45%). 2. Rent (~ 15-20%).
3. The salary fund (~ 25-30%). 4. Technical support (~ 10-15%).
5. Other costs (~ 10-15%) (equipment depreciation, insurance, etc.)
Now operating costs can be calculated on the basis of such indicator as data centre power: we can estimate the
operating costs by defining the cost of electricity consumed. Analytical materials include very different estimations of the share of electricity in operating costs: from 25% to 45%. We have analysed the financial statements of a number of data centres and have chosen the value 42% as the most acceptable estimate.
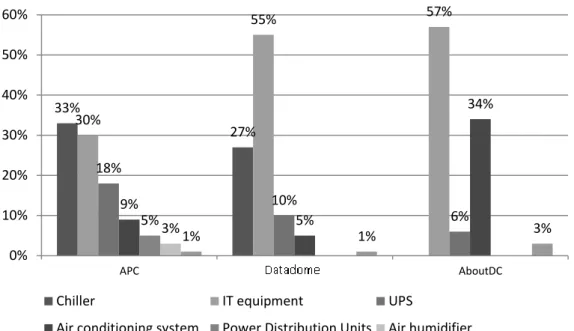
If the project determines the number and capacity of racks in the data centre, the calculation of the consumed energy is trivial. But in this case it is necessary to take into account the distribution of energy consumption in data centres (Figure 4).
The analysis of the information about the structure of the electricity consumption in some data centres [2, 12, 14] showed that all data centre racks consume about half of the total electricity. This means that all data centre racks consume electricity, which makes about 21% of all operating costs. At the moment racks for 42 U with 5 kW power are the most popular but the cost of 1 kW of energy in different regions is very different.
42% 19% 25% 25% 30% 42% 36% 40% 40% 5% 35% 9% 9% 24% 20% 15% 16% 5% 17% 11% 25% 7% 36% 15% 8% 19% 15% 10%
Croc APC Datadome СNews AboutDC Radius
Group
COMPUTER MODELLING & NEW TECHNOLOGIES 2014 18(6) 261-270 Grekul V, Baydalina L
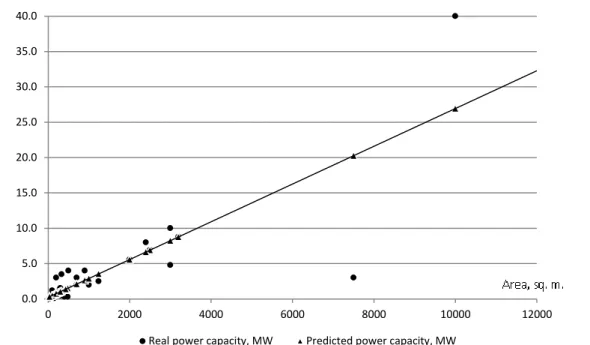
FIGURE 4 Distribution of energy consumption in the data centres However, if the early stage of the project does not
include definitions of equipment specifications, estimation of the power should be performed on the basis of statistical data. To forecast the data centre capacity (M, MW / h) we built a regression model identifying the relationship between this index and basic characteristics of a data centre (space and the number of racks):
Characteristics of regression model: R2 = 0.93, P
-value for N is 6.61Е-16. .
Characteristics of regression model: R2 = 0.66, P
-value for S is 2.28Е-07.
Figures 5 and 6 present these models in a graphical form.
FIGURE 5 Regression model of dependence of datacentre power consumption on the amount racks
33% 27% 30% 55% 57% 18% 10% 6% 9% 5% 34% 5% 3% 1% 1% 3% 0% 10% 20% 30% 40% 50% 60% APC Датадом AboutDC
Chiller IT equipment UPS
Air conditioning system Power Distribution Units Air humidifier
Lighting system 0.0 5.0 10.0 15.0 20.0 25.0 30.0 35.0 40.0 0 500 1000 1500 2000 2500 3000 3500
COMPUTER MODELLING & NEW TECHNOLOGIES 2014 18(6) 261-270 Grekul V, Baydalina L
FIGURE 6 Regression model of dependence of the datacentre power consumption on the area To obtain more accurate results it is better to use the
number of racks (N).
Proceeding from the previous analysis of the structure of the operating costs, an estimation of the value of OPEX (during the year) may be performed using the following relations:
[ ] [ ] ,
,
,
where e is the cost of electricity, $ / kW / h.
It is necessary to note that the price of energy differs in different regions of Russia is and this will lead to a certain error in estimation.
Degree of conformity between calculated and actual values of operating costs is illustrated for several Russian data centres in Table 3.
TABLE 3 Comparison of actual and calculated data centre operating costs
Data centre Safedata ОBIT Parking.ru
ОРЕХ/racks deviation 31% 34% 14%
ОРЕХ/sq.m. deviation 9% 31% 14%
For modelling future cash flows we should take into account changes in the prices of the main components of operating costs. In particular, in case of constant parameters of capacity, electricity payment costs will rise according to electricity prices, payroll - according to the real wages, etc.
Deep analysis requires not only consideration of the cost structure, but also assessment of the dynamics of
changes in the future. This requires understanding of how prices will vary for each subgroup of costs (as the number in each group will have the same characteristics if data centre doesn’t change).
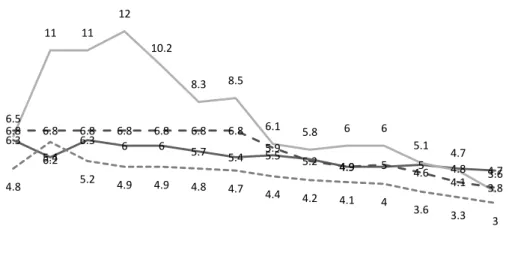
So, we use the following forecasts of the Ministry of Economic Development [16] (Figure 7).
0.0 5.0 10.0 15.0 20.0 25.0 30.0 35.0 40.0 0 2000 4000 6000 8000 10000 12000
COMPUTER MODELLING & NEW TECHNOLOGIES 2014 18(6) 261-270 Grekul V, Baydalina L
FIGURE 7 Forecast of macro economical indicators, % We constructed the forecast of the structure of
operating costs, using the following assumptions:
The base year (average year in used researches) - 2011
The original structure of operating costs is calculated as the average result of used researches Personnel costs increase in proportion to the
growth of real wages
The cost of electricity is rising in proportion to the price of electricity for all consumers
The cost of renting the building increases in proportion to the growth of prices in construction market
All other costs are rising in proportion to the average annual inflation rate.
The result is the forecast presented in Figure 8. As can be seen, the overall structure of operating costs does not change significantly, but we can note the increase of the share of energy costs and reducing of the share of personnel costs in the total cost.
These data can be used in the process of specification of forecasted costs. As a generalized estimation of future changes in operating costs, it is possible to use the weighted average of the growth rate of operating costs equal to 6%.
FIGURE 8 Forecast of changes in the structure of operating costs
6.3 5.4 6.3 6 6 5.7 5.4 5.5 4.9 5 4.8 4.7 6.5 11 11 12 10.2 8.3 8.5 6.1 5.8 6 6 5.1 4.7 3.6 4.8 6.2 5.2 4.9 4.9 4.8 4.7 4.4 4.2 4.1 4 3.6 3.3 3 6.8 6.8 6.8 6.8 6.8 6.8 6.8 5.9 5.2 4.9 5 4.6 4.1 3.8 2012 2013 2014 2015 2016 2017 2018 2019 2020 2021 2022 2023 2024 2025
Real wages Rising of electricity prices Inflation Construction
5% 10% 15% 20% 25% 30% 2011 2012 2013 2014 2015 2016 2017 2018 2019 2020 2021 2022 2023 2024 2025
Payments for electricity Staff Space rental
COMPUTER MODELLING & NEW TECHNOLOGIES 2014 18(6) 261-270 Grekul V, Baydalina L The average annual growth of the components of
operating costs was determined using forecasts of macroeconomic indicators of Russian economy, published by the Ministry of Economic Development of Russian Federation [16]. Weighted average annual growth of operating costs (including the share of each group in operating expenses) is 6%.
Now operating costs of a data centre in the year G can be determined by the following relation:
.
4 Forecasting the revenue of a data centre
To calculate cash flows such indicators as revenue per rack and revenue per square meter of the data centre space are usually used.
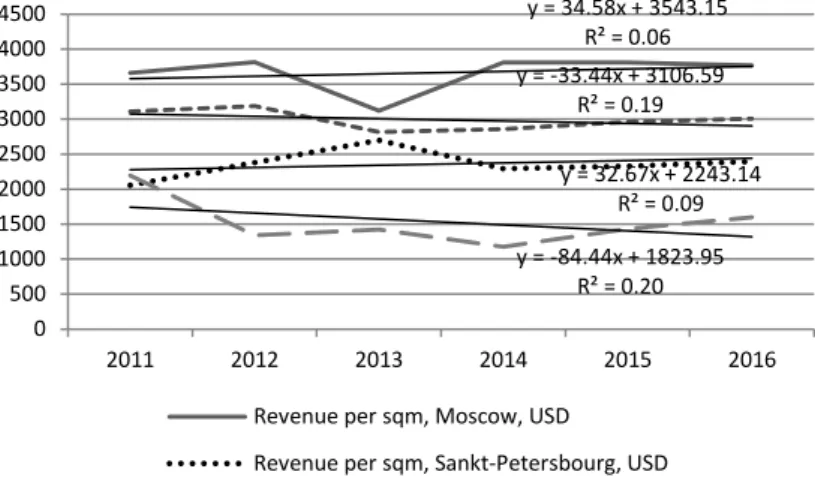
As a basis for our analysis we have used the results of revenue forecasts from the data centre market research of iKS-Consulting company (2012) (Figure 9, 10). Absolute values of revenue presented in these research significantly differ from our results because iKS-Consulting company used generalized data (total number of racks, total area of data centres in Russia, summarized declared income etc.), not the data of concrete projects. But this data are quite enough to analyse the behaviour of revenue indicators. We have used trend estimation technique to make and justify some statements about tendencies in these data. As we can see, the values of the coefficients of determination for the linear trends are within 0.00 – 0.41. This indicates the absence of explicit changes in the data over time. The variability of indicators is mainly determined by other factors.
It allows us to conclude that these indicators are quite stable in nature and will not change significantly in the foreseeable future.
FIGURE 9 Forecast of revenue per sq. m in geographical terms
FIGURE 10 Forecast of revenue per one rack in geographical terms
y = 34.58x + 3543.15 R² = 0.06 y = 32.67x + 2243.14 R² = 0.09 y = -84.44x + 1823.95 R² = 0.20 y = -33.44x + 3106.59 R² = 0.19 0 500 1000 1500 2000 2500 3000 3500 4000 4500 2011 2012 2013 2014 2015 2016
Revenue per sqm, Moscow, USD Revenue per sqm, Sankt-Petersbourg, USD Revenue per sqm, regions, USD
Revenue per sqm, Russia, USD
y = 103.95x + 10887.50 R² = 0.41 y = 128.07x + 10534.56 R² = 0.14 y = -45.72x + 6210.73 R² = 0.00 y = -0.99x + 10427.44 R² = 0.00 4000 5000 6000 7000 8000 9000 10000 11000 12000
2011 2012Revenue per rack, Moscow, USD2013 2014 2015 2016
Revenue per rack, Sankt-Petersbourg, USD Revenue per rack, regions, USD
COMPUTER MODELLING & NEW TECHNOLOGIES 2014 18(6) 261-270 Grekul V, Baydalina L Due to significant differences in accounting policies
in different companies information about revenue of data centres is very heterogeneous and often contradictory (for example, stated in the reports values of revenue per sq. m differ by 37-48 times for data centres with the same location). Therefore, for the analysis we selected the data of several Moscow typical data centres with relatively clear accounting system. Finally, we have got the following average indices: revenue in Moscow and Moscow region is 5 700 $ / sq. m or 12 430 $ / rack. For St. Petersburg and other Russian regions these values can be adjusted with the help of the above mentioned forecasts (report of iKS-Consulting company (2012)).
It is necessary to consider the impact of the degree of occupancy of a data centre on revenues. We assume that the average time to achieve the level of normal occupancy of a commercial data centre is two years [17]. We believe that the filling of a data centre proceeds linearly. It means that at the end of the first year the level of occupancy will reach 50% and the average level of occupancy for the first year will be 25%. At the end of the second year occupancy will reach its normal level,
and the average level for this period will be 75% of normal.
As a result the revenue (Rev) of future periods (since the moment of commissioning data centre) can be represented by the following relations:
∑ , ∑ , where:
RPR (Revenue per rack) - index of revenue per rack in every given year
RPM (Revenue per square meter) - index of revenue per square meter of data centre space in every given year
Per - period for which the analysis is performed (number of years).The degree of compliance of real and calculated revenues of several data centres [18] is shown in Table 4. TABLE 4 Comparison of actual and calculated data centre revenue
Data centre Safedata Dataline DEMOS-Internet OBIT
Revenue per rack, deviation 12% 14% 17% -6%
Revenue per sq. m, deviation 12% 17% 24% -11%
5 Estimation of financial performance of a project
The final step in the evaluation of the effectiveness of investment in a data centre is to build a discounted cash flows model. It includes income and expenses of future periods, loans needed for starting the project and the future payment of interest on them. As a result the net cash flows will be obtained and finally they must be discounted. The estimations of NPV and ROI allow us to receive a final evaluation of the effectiveness of the project.
During the preplanning of the project the following parameters should be defined:
Space of a data centre (in the ideal case - the number and power of racks, as well).
Period of construction of a data centre (usually – about 2 years).
Duration of the data centre lifecycle.
The Net Present Value of a data centre creation project, launched in the year G, can be determined (using data about technical space) by the relation:
[ ] [ ] ∑[ ]
where:
q - serial number of the year of project, i - discounting coefficient,
D - duration of the data centre lifecycle.
6 Conclusion
Of course, every data centre is unique, so there can’t be a universal tool that would exactly forecast cash flows. Our model provides a reasonably accurate estimate baized on the most aggregated data centre characteristics – space and number of racks. In comparison with the data of real projects the errors of our model lie within following ranges:
COPEX(N) - 2%-16%
COPEX(S) - 1%-14%
for the operational expenditures
ОРЕХ/racks - 14%-34%,
ОРЕХ/sq. m. - 9% -31%, for the revenue
RPR - 6%-17%
COMPUTER MODELLING & NEW TECHNOLOGIES 2014 18(6) 261-270 Grekul V, Baydalina L Parameters of the model depend considerably on the
place of the data centre construction (Moscow, St. Petersburg or other regions of the Russian Federation).
As an example, let us consider the project of typical data centre in the Moscow area (of the Tier 3 level, with the area of 1 000 square meters). Using the proposed model we obtain the following results:
CAPEX = -2651754 + 22612*S = 620 007 thousand rubles = 19 960 thousand dollars.
OPEX = (0,24 + 0,003*S)*20857*e = 80 325 thousand rubles = 2 586 thousand dollars. Rev = 171 000 thousand rubles = 5 505
thousand dollars (exceeds the volume of operating costs by 90 675 thousand rubles or by 2919 thousand dollars).
In case of constant CAPEX payback period will be 6.8 years, IRR = 8%. These figures are broadly in line with the estimates of different experts [3, 19, 20] and confirm the correctness of relations obtained by us.
References
[1] Datacentre downtime: How much does it really costs? 2012 http://www.stratus.com/~/media/Stratus/Files/Library/AnalystRepo rts/AberdeenDatacentreDowntimeCost.pdf 14.03.2013
[2] Determining Total Cost of Ownership for Data Centre and Network Room Infrastructure White paper # 6 Revision 2005 http://www.apc.com/go/promo/whitepapers/index.cfm 20.03.2012 [3] Economics of data centre// Radius Group 2013
http://www.rvip.ru/1065/document1071.shtml 25.07.2013 [4] Hamilton J 2010 Overall Data Centre Costs.Perspectives James
Hamilton's Blog
http://perspectives.mvdirona.com/2010/09/18/OverallDataCentreCo sts.aspx 22.03.2012
[5] Patel C, Shah A 2005 Cost Model for Planning, Development and Operation of a Data Centre Internet Systems and Storage Laboratory - HP Laboratories Palo Alto, http://www.hpl.hp.com/techreports/2005/HPL-2005-107R1.pdf 22.03.2012
[6] Total Cost of Ownership (TCO): Definition, Meaning and Use Encyclopedia of Business Terms and Methods 2013 ISBN 978-1-929500-10-9
[7] Information about prices of acquired basic construction materials, components and structures http://www.fedstat.ru/indicator/data.do 15.02.2013
[8] Data centre: expenditures structure Radius Group http://www.rvip.ru/document999.shtml
[9] Pavlov A, Basistiy D, Kusakin D 2012 Business plan and financial assessment of creating a data centre with high level of reliability http://www.iks-media.ru/issue/2012/7/4430815.html 18.02.2013
[10]Samoylov Y 2010 What does it take to build a data centre?! http://www.dtln.ru/press-tsentr/sobytiya/chto-nam-stoit-tsod-postroit 22.03.2013
[11]System of professional analysis of markets and companies SPARK-Interfax. http://www.spark-interfax.ru/Front/Index.aspx 15.05.2013 [12]Data centre statistics 2011 AboutDC.ru
http://aboutdc.ru/page/64.php 20.08.2012
[13]Khoroshikh D 2010 All advantages of external data centre http://library.croc.ru/document/3336/ 20.08.2012
[14]Pavlov A 2007 Engineering solutions for reducing the operating cost of the data centre http://www.osp.ru/data/670/942/1238/10.pdf [15]Volchaninov L, Ilyin S 2008 The crisis will force introducing
technologies of optimization data centre http://www.r-style.com/presscentre/publications/cnews-cod-08/ 28.02.2013 [16]Ministry of Economical Development http://www.economy.gov.ru/
28.02.2013
[17]Gabrielyan V 2009 How to build private data centre Byte Russia http://www.bytemag.ru/articles/detail.php?ID=15495 2.09.2012 [18]Soukhov R 2008 How to estimate expenditures of data centre?
http://www.osp.ru/nets/2008/04/4944787/ 18.09.2012
[19]Data-centres are growing as mushrooms 2013 http://www.it-weekly.ru/analytics/tech/45540.html 18.09.2012
[20]Pavlov A 2011 Data centre Checklist http://www.outsourcing.ru/content/rus/327/3274-article.asp 15.10.2012
[21]Orlov S 2008 Data centre: Russian realities http://www.osp.ru/lan/2008/09/5535759/ 15.10.2012
Authors
Vladimir Grekul, born on September 15, 1949, Sakhalin, Russia
Current position, grades: Professor,Head of the Department of Corporate Information Systems National Research University Higher School of Economics, Moscow.
University studies: Kiev Higher Engineer Aviation Training School of the Air Force
Scientific interest: IT management
Publications: 90
Experience: 40 years experience in design and implementation of information systems.
Liubov Baydalina, born on January 4, 1990, Chelyabinsk, Russia
Current position, grades: Junior Business Analyst, Schneider Electric, Business Development department.
University studies: MA degree, Magna Cum Laude (Honors degree).
Scientific interest: business processes modelling and optimization, modelling of market development, estimate of NPV of IT project.
Publications: 6.