Program Performance Review
Human Resources Division of the
Finance and Administrative Services Department
September 9, 2009
Report No. 09-19
Office of the County Auditor
Evan A. Lukic, CPA
County Auditor
Table of Contents
Topic Page
Executive Summary ... 1
Purpose and Scope ... 3
Background ... 3
Section 1: Assessment of Human Resources Division’s Accountability System ... 8
Section 2: Assessment of Human Resources Division’s Performance ... 16
Efficiency: Peer Analysis ... 16
Effectiveness: Focus Group Results and Follow Up ... 20
Appendix A: Focus Group Attendees and Agenda ... 42
Appendix B: Human Resource Customer Focus Group Summary of Ratings ... 43
Executive Summary
This report presents the results of our Program Performance Review of the Human Resources Division (HRD) within the Finance and Administrative Services Department. Section 1: Assessment of HRD’s Accountability System (pages 8-15)
• Some HRD sections have made efforts to implement an effective accountability structure, including collecting and analyzing unit cost and internal operational data and conducting benchmarking activities to improve results.
• However, HRD generally lacks complete and meaningful performance data to effectively monitor operations and to help policymakers make informed budget and policy decisions.
• To further enhance its accountability system, we recommend that HRD: o Identify, collect and analyze pertinent unit cost data, using full cost
methodology, for major services;
o Expand benchmarking activities to include all major services; and o Improve data collection by addressing existing information system
deficiencies.
Section 2: Evaluation of HRD’s Performance (pages 16-41)
• To evaluate HRD’s efficiency we compared its staffing and resource allocation levels against peers and human resource standards. Based on two commonly used
efficiency indicators, HRD’s current staffing and resource levels appear appropriate. For example, the human resources staff to County employee ratio and annual per FTE expenditure for human resource services is below average based on data reported by the Society for Human Resource Management and the International City/County Management Association and is generally comparable to local peers. • To evaluate HRD’s effectiveness we (a) conducted five focus groups consisting of
31stakeholder participants, and (b) analyzed available performance data. Based on our analysis, we identified four service areas that are generally considered to be effective in meeting objectives and four service areas that need to be improved to enhance HRD effectiveness.
Services which are generally effective:
o Employee Assistance Program—employee counseling and organizational intervention services specifically received the highest ratings from
stakeholders.
o Learning and Organizational Development—stakeholders mainly praised the variety of training opportunities and quality of leadership development
classes.
o Open enrollment—focus group participants particularly recognized the ease of enrolling for benefits and ongoing communication throughout the process.
o Reduction in Force—many stakeholders appreciated HRD’s efforts to avoid layoffs and find placements for all affected employees.
Areas that need improvement:
o HR Recruiter and New Hire Process: Users expressed dissatisfaction with the prescreening process, the quality of referred candidates, the length of time to fill a position, and challenges using HR recruiter. Despite
improvements to its new hire process, including significant prescreening workload reductions, challenges remain that should be addressed. o Position and Compensation Reviews: Stakeholders identified concerns,
including (1) lack of regular classification and compensation system reviews, (2) ineffective oversight of Human Resource Officers, (3) lack of written policies to guide work processes, and (4) untimely reclassification and salary adjustment reviews.
o Succession Planning: HRD has made minimal efforts to develop a
comprehensive succession management plan in accordance with industry best practices.
o Performance Management: Stakeholders cited several interrelated concerns that related to (1) updating performance evaluation instruments, (2)
disciplining and terminating poorly performing employees, and (3) rewarding high performing employees. In partnership with County Administration, HRD is currently taking steps to develop a new employee evaluation process. • To further improve HRD’s effectiveness, we recommend that the Board of County
Commissioners direct the County Administrator to implement the following actions and report progress by December 31, 2009:
o Evaluate opportunities to improve the efficiency and effectiveness of hiring processes, including developing more comprehensive prescreening review processes and determining the feasibility of making enhancements to HR Recruiter, and update the Internal Control Handbook and provide applicable staff training relative to hiring processes;
o Develop comprehensive policies and procedures on reviewing reclassification salary adjustment and range reallocation requests, and reviews of the
classification plan, and update the Internal Control Handbook accordingly; o Develop a comprehensive succession management plan; and
o Continue efforts to update performance appraisal processes and explore the feasibility of developing a program to reward and encourage high performing employees
Purpose and Scope
This report presents the results of a Program Performance Review of the Human
Resources Division (HRD) within the Finance and Administrative Services Department. The purpose of this review is to assess the quality of the Division’s accountability
system, evaluate its performance and identify options for improving services. To accomplish our objectives, we:
• Reviewed pertinent performance measurement, general management, and human resources services literature,
• Analyzed available performance data for HRD operations,
• Analyzed information provided by HRD Managers and employees relative to specific management processes and controls,
• Reviewed applicable HRD records and documents, including relevant policies and procedures,
• Interviewed HRD Managers and employees, and
• Conducted focus groups with HRD Managers, Human Resource Officers and County agency stakeholders.
Background
Human Resources Division is an enterprise-wide internal service agency providing human resources management support. This encompasses a wide variety of
responsibilities such as employment applicant screening and testing, maintenance of position classifications and personnel policies, coordinating employee training and benefit programs, processing personnel actions, upkeep of employee records, discipline and grievance handling and administration of collective bargaining agreements.
HRD is funded by both the General Fund and the Human Resources Employee Benefits Fund. The Division’s total fiscal year 2009 operating budget is $67,879,380 and
includes 55 positions.1 General Fund Services
As depicted in Exhibit 1 on the following page, General Fund dollars support the Administration, General Services and Learning and Organizational Development sections within HRD.
1
Broward County’s human resources functions are generally centralized within HRD; however, several Departments (Human Services, Broward County Aviation, Port Everglades, Public Works, Water and Wastewater Services Division, and the Office of Transportation) fund their own out-stationed Human Resource Officer positions. Human Resource Officers provide dedicated human resource services to their respective agencies but receive support and follow policy as directed by HRD. As these positions are not funded by HRD, they are not reflected in the budget amounts shown here.
Exhibit 1: For FY 2009, HRD’s General Fund budget includes $4,027,280 in funding and 40 positions
Fund Section FY 2009 Budget # of Positions General Fund Administration $ 655,040 5 General Services $ 2,100,370 27 Learning and Organizational Development $ 1,271,870 8
Total $ 4,027,280 40
Source: Office of Management and Budget
The Administration section provides oversight and guidance to the entire Division in the delivery of human resource services.
The ‘General Services’ budgetary section encompasses three operational units: Staffing Services, Compensation and Records, and Labor Relations.
• Staffing Services (SS) is responsible for providing fair and defensible recruitment and applicant evaluation services with the goal of referring “the highest quality candidates in order for the County to provide the highest quality public service”. The unit maintains the County’s online job application system known as HR Recruiter.
• Compensation and Records (CR) provides for the administration and
maintenance of the County’s classification and pay system and development of compensation related policies. This unit also maintains official personnel records, processes personnel transactions and administers the Employee Service Recognition Award Program.
• Labor Relations (LR) negotiates and administers the County’s eight collective bargaining agreements with four separate unions. To help protect the County from liability, the LR section is to provide defensible, pro-active and ethical services and guidance to all County Divisions in matters such as employee performance appraisals, disciplinary actions and grievances.
The Learning and Organizational Development (LOD) section manages classroom and computer based training courses, including mandatory trainings. LOD provides
individual and organizational learning and development support through training needs assessments and analyses, consulting and coaching assistance, and programs such as tuition reimbursement and internships.
Employee Benefits Fund Services
As depicted in Exhibit 2 on the following page, the Employee Benefits Fund supports the Employee Assistance Program, Employee Benefits Services and Employee Benefits Administration sections within HRD. The Employee Benefits Fund is primarily funded
through transfers from the General Fund, Enterprise Funds through cost allocations and employee contributions for various benefit programs.
Exhibit 2: For FY 2009, HRD’s Employee Benefits Fund budget includes $63.9 million and 15 FTEs
Fund Section FY 2009 Budget # of Positions Employee Benefits Fund
Employee Benefits Administration $ 1,088,500 11 Employee Benefits Services $ 62,370,340 N/A Employee Assistance Program $ 393,260 4
Total $ 63,852,100 15
Source: Office of Management and Budget
The Employee Benefits Administration section designs, implements and administers County sponsored benefit programs. 2 This includes managing the annual open enrollment process and conducting employee informational sessions regarding
available benefits. The County’s Health and Wellness Program, including the Employee Wellness Center, are also administered by this section.
Employee Benefits Services portion of HRD’s budget represents the total costs for all benefits related contracts administered by Employee Benefits Administration.
Approximately $42 million of this amount is obtained through transfers from the General and Enterprise Funds for County contributions towards employee benefits, while $14 million represents direct employee and retiree payments for insurance premiums, with an additional $6 million in reserves. This section does not have budgeted staff
positions; all employee positions are reflected in the Administration section of the budget.
The Employee Assistance Program (EAP) offers confidential assessment, referral and case management services to employees and/or family members seeking assistance with personal problems that may affect job performance. The section also provides Department of Transportation Substance Abuse Professional assessment and follow up services3 as well as organizational needs assessments, managerial coaching, and critical incident debriefings.
2
Broward County offers its benefit eligible active employees, retirees and COBRA beneficiaries a variety of voluntary contribution programs including health, vision, dental, flexible spending and Consumer Driven Health Plan Health Reimbursement Accounts, life insurance, long term disability insurance, long term care insurance, cancer/dread disease insurance, pre-paid legal services, and Deferred Retirement Option Program (DROP).
3
The Department of Transportation requires funded agencies such as Broward County to provide drug/alcohol testing, referral and follow up services for employees with Commercial Driver’s Licenses in safety-sensitive positions.
Broward County’s Workforce
As stated on HRD’s website, “People are Broward County’s greatest asset.” The
County employs over 7,300 individuals annually representing a great diversity of people, skills and knowledge. According to OMB, employee compensation (salaries and
benefits) in FY2008 was in excess of $400 million. As displayed in Exhibit 3 below, this represents 34.6% of the County’s actual fiscal year 2008 budget, making employees one of Broward County government’s most important and costly resources.4
Exhibit 3: In FY 2008, compensation represented 34.6% of Broward County’s operating budget
Source: Office of the County Auditor analysis of OMB data 34.6% 65.4% FY 2008 Operating Expenditures Personnel Expenditures Other Expenditures
In fiscal year 2008, the County’s budget included 5,891positions for full time, part time and other statuses.5 Over the span of the entire year, 7,344 individuals were employed. As shown in Exhibit 4 on the following page, from fiscal years 2006 through 2008, the majority (87%) of County employees are full time staff. Due in part to reductions in the number of budgeted positions, the County’s total number of individuals employed annually has declined approximately 8% (632 individuals) from fiscal year 2006 to 2008 as the number of budgeted positions also decreases.
Broward County employees can be hired to fill one of 1,000 different job classifications, many of which are regulated by union contracts. County employment covers a wide range of skills and experience, spanning job titles such as: Accountant, Attorney, Building Code Inspector, Bus Operator, Carpenter, Engineer, Family Therapist,
Information System Analyst, Lifeguard, Librarian, Mechanic, Mosquito Control Inspector, Natural Resource Specialist, Nurse Practitioner, Purchasing Agent, Recreation Aide, Security Guard, Storekeeper, Toxicologist, Traffic Signal Technician and Zoning Plans Examiner.
4
Fiscal year 2008 budget amount excludes capital expenses, debt service, transfers and reserves.
5
‘Other’ statuses include seasonal, temporary, student and will-call positions. 6
Exhibit 4: From fiscal years 2006 to 2008, Broward County’s total workforce declined from 7,975 individuals to 7,343
Source: Office of the County Auditor analysis of HRD information 0 1,000 2,000 3,000 4,000 5,000 6,000 7,000 8,000 9,000 2006 2007 2008 # of County Employees Other Part Time Full Time
As demonstrated in Exhibit 5, slightly over one half of all classifications (514) are for represented (union) positions while the remainder (486) are unrepresented. In fiscal year 2008, approximately 80% of full time and part time (20 hour) benefit eligible employees were in represented classifications.
Exhibit 5: In fiscal year 2008, 51% of employee classifications and 80% of benefit eligible employees were represented by labor agreements
Source: Office of the County Auditor analysis of HRD data
51% 49% % Represented Classifications Represented Classifications Unrespresented Classifications 80% 20% % Represented Employees Represented Employees Unrepresented Employees 7
Section 1: Assessment of Human Resources Division’s
Accountability System
This section presents our assessment of the Human Resources Division’s accountability system. Establishing an effective accountability system is essential to ensure public funds are spent in a manner that achieves desired results and improves the provision of public services.
An effective accountability system provides quality information to enable: • Citizens to hold elected officials, managers, employees and private
contractors accountable for the efficient and effective use of public funds; • Elected officials and other policymakers to make informed budget and policy
decisions; and
• Managers to detect and correct operational deficiencies and improve program results.
Our assessment examines the extent to which HRD has developed and implemented key components of its performance measurement and reporting system. Specifically, we examined whether the Division has:
• Collected and analyzed unit cost data for each major service and activity; • Benchmarked its performance through contacting other governmental or
non-profit agencies that provide similar services;
• Collected and analyzed data to assess operational efficiency and effectiveness;
• Established processes to ensure performance data reliability; and
• Used performance data to modify current practices or change operational processes in order to achieve better program results.
Best Practice: Collect and analyze unit cost data for major services
Unit cost refers to the cost of producing an output or outcome.6 Collecting and analyzing unit cost data is important because it can be used by an agency to:
• compare performance to similar service providers
• predict how changes in the demand for services will affect its budget • assess how changes in operations could affect costs
• identify wasteful processes
• estimate the impact of budget decisions
6
Source: Florida Legislature’s Office of Program Policy Analysis and Government Accountability 8
Although unit cost data was collected for LOD and EAP services, the calculations were not meaningful; as a result comparative analyses provided to County
managers were of limited value
Analyzing reliable unit cost data for primary services is an important management tool. Agencies can use information to identify cost savings through comparisons of historical performance, against peers or outside vendors, or to determine if fees for services have been appropriately set. Therefore, we asked HRD Managers to provide us with unit cost analyses for its major activities or services. Examples were provided for two of the Division’s six operational units.
In fiscal year 2008, both LOD and EAP presented unit cost comparisons of their
services to County managers. LOD prepared an annual report to County Administration summarizing its program activities, while EAP presented its cost data in its 2009 Results Team Program Proposal form. While it is recognized that these sections have made efforts to analyze their costs, the methodology used in making the calculations limit the usefulness of the information presented. Specifically:
• In fiscal year 2008, LOD presented its training cost to be $7.49 per hour as compared to ASTD’s published industry standard for government agencies of $55.22. 7 This comparison appears to reflect considerable economy of services; however, while LOD’s cost calculations included materials and instructor fees, it failed to include the salaries of County staff persons who provide training hours, process oversight and supervision, plus indirect costs such as facility expenses. As a result, the comparison significantly overstated the savings realized.
• EAP’s Fiscal Year 2009 Results Team Program Proposal form listed several hourly costs for similar services from vendors but did not provide EAP’s hourly costs for comparison. This information is necessary to determine if savings could be achieved by contracting out all or portions of the services provided. The packet also included a peer comparison of cost per case and per hour of training provided. However, these calculations were made using total program costs rather than the actual portion (%) of total program costs attributable to the
service. As a result, the comparisons were not based on actual expenditures. A more meaningful comparison for future consideration is cost per counseling hour, as the intensity of services provided may differ across programs. Due to these errors or omissions in the data presented, no conclusions about the efficiency of EAP services can be made. However, we note that EAP’s analysis included total program cost per capita (employee), which is an important measure for
evaluating the level of resources dedicated to the program.
7
Although this agency formally uses the acronym ASTD as its name, it is also known as the American Society for Training Development.
Other sections in HRD have not demonstrated use of unit cost data to analyze operational efficiency
Although LOD and EAP have made efforts to examine the efficiency of their services through unit cost analyses, HRD was unable to demonstrate the use of unit cost
calculations for the remaining four sections. To increase its knowledge of the efficiency of its other operations, HRD should expand its current practices to include additional sections within the Division. Additional practical examples of unit cost measures specific to human resource operations include benefits cost per employee or cost per new hire. HRD can also develop cost analyses for various regularly occurring internal activities such as cost per filled records request or cost per personnel action processed.
Recommendation
In an era of budget cuts, it becomes more important than ever for County programs to operate efficiently. To provide Division and Department managers and County
policymakers with meaningful information to determine if services are provided as economically as possible, we recommend the Board of County Commissioners direct the County Administrator to take the following action and report progress by December 31, 2009:
1. Identify, collect and analyze pertinent unit cost data suggested in this report or other measures identified by the Division. Unit costs calculations should use full cost methodology.
Best Practice: Contacting outside sources to benchmark
performance
The Government Finance Officers Association recommends benchmarking as a method of obtaining information that can be used to identify inefficient practices and develop strategies to achieve better results. Benchmarking refers to “performance comparisons of organizational business processes against an internal or external standard of
recognized leaders.” In order to ensure high performance in its operations, County managers should systematically and routinely compare their policies, practices, and performance measures against those of high-performing organizations, other local governments and private industry leaders that provide similar services.
Benchmarking resources available to HRD include the Florida Benchmarking Consortium (FBC), Society for Human Resource Management (SHRM) and International City/County Management Association (ICMA). Several professional organizations also publish reports examining various aspects of human resource
operations. All of these agencies provide useful data for an organization to benchmark its overall performance, use of resources as well as specific operational measures.
LOD and EAP have made efforts to compare their performance against peer organizations
In response to our requests for examples of benchmarking activities, HRD Managers provided us with information gathered from the LOD and EAP sections. These two sections have taken action to benchmark specific areas of performance against peer agencies.
• LOD has demonstrated consistent efforts in benchmarking. Specifically, LOD has participated in the ASTD (American Society for Training and Development) Workplace Learning and Performance Scorecard to compare its performance against other organizations. This process gauges organizational training in the areas of alignment, efficiency, effectiveness and sustainability. Participating agencies report data which is then compared against the mean score of 200 other organizations.8 In other activities, LOD has benchmarked its Tuition Reimbursement Program against peers and has compared its training programs against the general market through the identification of similar training classes. • Both LOD and EAP have compared their costs against peers. As noted in the
previous section of this report, these efforts have been of limited value as calculations were not meaningful; however, it is recognized that these sections have initiated work in this best practice.
HRD initiated use of benchmarking resources to analyze its overall performance, but expanding current efforts can provide managers with more meaningful
comparisons
HRD’s benchmarking of overall Division performance and efficiency has been limited until the current fiscal year. For example, in 2006, 2007 and 2008, HRD provided data to the Florida Benchmarking Consortium. HRD Managers state that in the past, FBC’s annual service reports were reviewed upon receipt and meetings were held with
management staff to discuss the overall results. However, no further analysis or specific use of the compiled data reports was completed until the recent 2010 budget process.
In June 2009, the Division provided the BOCC with data comparing the County’s human resource staffing to other jurisdictions. At this time, HRD completed a benchmarking analysis comparing itself to other Florida counties, using fiscal year 2008 data obtained from the FBC. The analysis presented to the Board also compared Broward’s
performance against information compiled by ICMA and the Society for Human Resource Management (SHRM). Based on the data compiled, Broward’s human resource staffing levels appears to fall within an average range. This analysis was an
8
Broward’s overall index score was 56, which falls somewhat below the mean score of 60 for all participating organizations. HRD managers state that due to concerns in definitions and subjectivity in scoring they have chosen not to participate again for 2008 and will instead be using ASTD’s State of the Industry report as a more valuable benchmarking tool in the future.
important step in comparing efficiency levels against peers. However, additional analyses of other standards, as well as narrowing benchmarking studies to focus only on the most comparable organizations could provide policy makers with additional valuable information. We have initiated this analysis in Section 2 of this report, pages 16-19.
Although HRD used compiled average data from ICMA in its report to the BOCC, this organization publishes annual reports that provide additional valuable information for future analyses by HRD. For example, the report lists organizational criteria HRD can use to identify peers, such as: HR centralization and reporting structure, total number of employees, number of HR employees, percentage of employees in unions and number of job classifications. Examples of specific performance measures that could help HRD evaluate its services include: employee benefits as percentage of total salaries and wages, number of working days for external and internal recruitments, reclassification of occupied positions, sick leave hours used, number of grievances and appeals per 100 employees, percentage of grievance resolved before passing from management control, and percentage of employee performance reviews completed on schedule.
Recommendation
To further facilitate benchmarking, which could help HR identify areas for improvement; we recommend the Board of County Commissioners direct the County Administrator to take the following action and report progress by December 31, 2009:
2. Expand existing benchmarking practices through (1) review and analysis of FBC and ICMA reports to identify most comparable peers and valuable service comparisons; (2) independent research to identify other peers, services or performance measures which are commonly benchmarked; and (3) gathering data and completing analyses, and (4) identify potential areas for improvements and initiate action as appropriate.
Best Practice: Collect and analyze internal operational data
To effectively manage County programs and operations, managers need more data than what is reported in the annual budget. The data reported in the annual budget generally relates to an entity’s overall performance rather than specific functions or activities. While the budget data is useful for accountability purposes, it provides limited information for managers to use in managing their programs on a daily basis.
Therefore, as a part of our Program Performance Review process, we look beyond the Division’s basic reporting requirements to determine how the organization utilizes other reports and data collection systems to improve its services. Specifically, we seek to identify internal reporting systems that allow Division Management to assess how their programs are meeting customer needs while providing cost efficient services.
Technology limitations affect policymakers’ ability to evaluate HRD programs
As a Division, HRD encompasses a variety of services and programs. Each section collects data regarding its own individual operations. This is accomplished through the use of many different software applications. However, to be effective as an enterprise wide internal service agency, HRD must look beyond its own day to day operations and examine human resource management on a County-wide basis. In our fieldwork, we found some instances where HRD collects and analyzes information on a
comprehensive basis (see page 15 for examples). We also identified other
opportunities for improved data collection which can assist HRD in its role as County-wide internal service agency.
As noted by HRD Managers throughout this review process, technology limitations have impeded the Division’s ability to complete comprehensive analyses of program and operations as a whole. Concerns cited by Division Managers include:
• Use of multiple systems resulting in a lack of integration and increased complexity
• Heavy reliance on Enterprise Technology Services (ETS)
• Obtaining support for products with sun-setting maintenance agreements • Inefficiencies due to data redundancies and manual processes
• Cumbersome modules of primary technology systems (Cyborg and Advantage) • Lack of user friendly interfaces
• Lack of centralized, real time, detailed data
• County’s continued reliance on paper based systems
As a result of these issues, the Division faces several challenges in gathering data needed for the management of day to day operations. Further, these challenges also affect HRD’s ability to serve as a County-wide resource. For example:
• LOD relies on the Registrar system to track training hours provided by the section. However, there is no system to track all training hours provided to County staff (i.e. ETS software trainings, internal/agency specific sessions or paid attendance at outside trainings). This limits LOD’s ability to effectively determine ongoing training needs, or to benchmark employee training hours and expenditures against peers.
• EAP uses manual sign in sheets to track client appointments. This process is time consuming and may lead to errors in reporting services.
• Records and Compensation uses Excel spreadsheets to track classification and salary review work completed by HRD staff, but does not track the work
completed by HROs. Without this information, Managers do not know the work effort County-wide and may not be able to identify trends in services.
• No comprehensive records of public record requests are maintained and many requests are not recorded at all. As the County is able to charge a fee for records request services, this information is important in ensuring fees are appropriately assessed and collected.
• Forms such as BC-102-102 (Personnel Action Form) are handled by several individuals/agencies causing delays in timely processing; as a result employees may not receive correct wages in a timely manner.
• County Employees and managers do not have the ability to independently track the status of many requests such as BC-102-102 processing, benefit changes, grievances, etc.
• Due to limitations in the quantity of data collected and the Cyborg system, HRD does not have the ability to generate employee statistical data reports to assist in County-wide planning and management activities. For example, reports
regarding reasons for employee separations or retirement projections lack sufficient detail for thorough analysis (see pages 35-37 for additional information in regard to succession planning activities).
• Although HR Recruiter provides some reporting capabilities, as applications progress through the evaluation process, previous data is not retained, limiting the ability to analyze some processes (see pages 23-30 of this report for more detailed discussions of the HR Recruiter system).
Recommendation
It is important for County managers to make informed decisions based upon complete and reliable information. To enhance the quality and quantity of data collected by HRD we recommend the Board of County Commissioners direct the County Administrator to take the following action and report results by December 31, 2009:
3. Ensure the collection of meaningful human resource related information through (1) identifying valuable types of data; (2) ensuring existing systems are used to the utmost of existing capabilities; (3) completing feasibility assessments regarding acquisition of software upgrades or modifications that would improve cost-effectiveness; (4) implementing cost effective and necessary data solutions.
Best Practice: Use of performance data to improve operations
According to the U.S. Government Accountability Office (GAO), the benefit of collecting performance data is only fully realized when the information is actually used by
managers to make decisions directed towards improving results. Managers can use performance information to identify operational problems and their causes, and to
develop corrective actions; to effectively plan and prioritize workload and resources; and to identify more effective approaches to program implementation.
HRD sections collect a variety of performance data and use the information to improve services
We found that sections within HRD have made significant efforts to gather information about services provided. The data is used by managers to assess service delivery, and modify for improvement when needed. Two primary examples of the use of
performance data to improve County wide operations include: 14
Learning and Organizational Development: LOD extensively surveys its users and collects data needed to ensure its programs meet County needs. When gaps or deficiencies are recognized, adjustments are made to program services. Similarly, identified strengths can be drawn upon to continue the effective delivery of services. Specific examples of information collected and used by LOD include:
•
In June 2008, LOD completed a study surveying County Department Directors’ opinions regarding organizational development needs and the value of LOD’s existing training programs. The report identified leadership concerns and developed recommendations for future training needs.•
In August 2008, LOD completed another study which surveyed supervisors and training liaisons regarding the value of existing training classes, identifying the courses considered to be the most and least needed. Information from this report is considered by LOD when developing future training calendars and establishing the frequency and type of course offerings.•
LOD completed an in depth examination of its Advanced Facilitation Skills Program by surveying graduates about their experiences. Based on the feedback provided, course content and practical exercises were modified.•
In October 2008, LOD completed a report analyzing the usage of the Tuition Reimbursement Program and surveying participants. The report offers recommendations to improve program effectiveness while managing costs.•
As part of each training class offered by LOD, participants complete pre and post tests to measure increases in subject knowledge. Attendees also complete satisfaction surveys which provide information about the course content and instructors. Responses are compiled on spreadsheets and reviewed to determine the effectiveness and popularity of classes. Information is then considered when developing future training schedules.Labor Relations: This section gathers information regarding disciplinary actions, grievances, drug and alcohol testing and related ‘return to work’ agreements and unemployment compensation hearings. Managers state that information includes actions taken by HRO staff to ensure the full scope of County activities is monitored. Information is tracked over time, and trends, when identified, are acted upon. For example, a large number of grievances in one section were traced to employee assignments following reduction in force; as applicable employee and supervisory responsibilities were reviewed with staff and the number of filings was reduced. Trend data is also used by the section to identify potential training needs.
Section 2: Assessment of Human Resources Division’s
Performance
In this section we evaluate HRD’s efficiency and effectiveness as the County’s provider of human resource services. Our assessment of HRD’s efficiency was completed through benchmarking HR staffing and resource levels against peer agencies using common industry measures. To assess HRD’s effectiveness, we conducted several focus groups to gather opinions regarding the Division’s services. The feedback received was reviewed to identify Division strengths and weaknesses, each of which was then further examined in additional detail.
In summary, we found that HRD’s staffing resources are generally comparable to peers for the efficiency measures reviewed (pages 16-19). Secondly, through the use of focus groups, we identified four service areas with high levels of customer satisfaction- (1) employee assistance, (2) employee training, (3) open enrollment, and (4) reduction in force efforts (pages 20-23). Similarly we identified areas with lower satisfaction levels that have been summarized into four categories (1) new hire process, (2) compensation and classification reviews, (3) succession planning, and (4) performance management (pages 23-41). Each of these areas was reviewed in detail to assess potential
deficiencies in the current level of services provided and where applicable, analyze performance and provide suggestions for improvements.
Efficiency: Peer Analysis
Efficiency can be defined as operating with the least possible expenditure of resources. Efficient organizations ‘do things right’ and avoid wasted time and effort. Ensuring efficiency in operations is critical in times of limited resources when government agencies are commonly being asked to ‘do more with less.’
Therefore, we sought to assess HRD’s efficiency by comparing its staffing levels and resource allocations against peers. We completed this analysis using two performance ratios recognized by the Society for Human Resource Management (SHRM): HR
Employee to Total Employee and HR Expense per FTE. Based upon the results of this work, HRD appears to have efficient operations, staffing levels below its peers and resource allocations which are below or comparable to peers.
In completing our analysis, we used information compiled by HRD and other peer counties for reporting to the FBC for fiscal year 2008. 9 For the purpose of our review, peer counties were considered to be Pinellas, Hillsborough and Palm Beach counties, as these jurisdictions had total numbers of employees most similar to Broward as well
9
The FBC report for 2008 has not yet been released; however, HRD obtained this data for benchmarking purposes and shared available information for this analysis. HRD managers state that the data is based upon actual, not budgeted, positions and dollars expended.
as comparable human resource functions. 10,11 To supplement our research, we also used benchmarking data compiled by SHRM and ICMA. It is important to note that the human resources structure in Broward County encompasses both HRD as a centralized service provider and out-stationed HRO positions. In most cases HRO staff provide the same or similar compensation, labor relations, and staffing services to their sponsoring agencies as central HRD staff provide to other County divisions. HROs also act as liaisons to other areas of HR. Therefore, in each of the analyses below we provide information based on HRD plus additional HRO resources.12
HR Employee to Total Employee Ratio
According to SHRM, the use of HR Employee to Total Employee ratios “can be a
powerful technique to measure and compare staffing levels across HR departments.” 13 This metric is calculated as a ratio between the numbers of human resource FTEs as compared to 100 FTEs in the organization as a whole. This information is valuable because it allows agencies to compare how many HR staff they have to support the total number of staff organization-wide relative to others.
Based upon our analyses of this indicator, Broward County staffing levels (for filled positions) appear to be efficient when compared to peers. As shown in Exhibit 6 on the following page, in fiscal year 2008, Broward County’s HR Employee to Total Employee ratio, inclusive of HRO staff was .86. For similarly sized and complex organizations, this result is significantly lower than the most recent data provided by SHRM and ICMA which is 1.05 and 1.04, respectively. 14 In our second analysis (Exhibit 7 on the following page) we compared Broward’s staffing levels to comparable Florida peer counties. At .86 HR staff to Total FTEs, Broward’s ratio is comparable to its peers.
10
Miami-Dade County is not considered a peer organization for the purpose of these analyses as it employs over 30,000 staff and its Human Resources Division manages payroll functions, which is not comparable to Broward County. Orange County is not considered in our analysis due to large numbers of outsourced HR staff who perform a variety of mixed functions, as a result a clear understanding of HR staff or resources could not be developed.
11
To better ensure comparability of data in peer analyses: (1) Broward’s EAP resources were removed as other counties’ HR Departments do not directly provide these services, and (2) Information provided by Palm Beach was modified to include employee benefits services (budgeted in the Risk Management Division), as all other counties have this program within their HR Departments.
12
In FY 2008, there were eight budgeted and seven filled HRO positions available to supplement the work of HRD staff; in FY 2009, two of the budgeted positions were eliminated. When this occurs, HRD ‘central’ re-assumes the responsibilities formerly managed by the HRO staff person.
13
HR to Employee Ratio, SHRM Metric of the Month, 9/1/2005
14
SHRM comparative data was obtained from the 2008 SHRM Human Capital Benchmarking report, and based upon the complexity of Broward County operations, 75Th percentile data was used for with
organizations 2,500-7,499 employees. ICMA data is based upon the organization’s most recent report for 2007 data for responding jurisdictions with populations of 500,000 or more, providing complete employee counts for centralized and decentralized human resource staff.
Exhibit 6: At .86, Broward’s HR Employee to Total Employee Ratio is below published industry standards for similar organizations
Source: Office of the County Auditor Analysis 0.86 1.05 1.04 0.00 0.20 0.40 0.60 0.80 1.00 1.20 BROWARD SHRM ICMA
HR Employee to Total Employee Ratio
Exhibit 7: At .86, Broward’s HR Employee to Total Employee Ratio is comparable to peer counties’ ratio
Source: Office of the County Auditor Analysis 0.86 0.73 0.87 1.10 0.00 0.20 0.40 0.60 0.80 1.00 1.20
BROWARD Palm Beach Hillsborough Pinellas
HR Employee to Total Employee Ratio
HR Expense per FTE Ratio
Another metric commonly used to demonstrate the level of investment an organization has in its human resource function is the HR Expense per FTE ratio. This ratio is calculated by dividing the total human resource expenditures in a fiscal year by the number of FTEs within the organization. According to SHRM, this measure is valuable because it enables managers to put an exact dollar amount per employee on HR spending and allows easy interpretation in determining if HR budgets are appropriate. Further, this ratio readily allows organizations to compare if they are spending more or less on human resource services than peers.15
15
HR Expense per FTE Ratio, SHRM Metric of the Month, 12/1/2005 18
Based upon our analyses of this indicator, Broward County’s dedicated human resource levels are generally comparable to peers. As shown in Exhibit 8 below, in fiscal year 2008, Broward County (inclusive of HRD and HRO staff) expended $872 in human resources per employee, which is lower than the SHRM mean of $1,176 per
employee.16 In our second analysis of this ratio shown in Exhibit 9, we compared Broward to peer Florida counties. At $872 per employee, Broward’s human resource level is 13% higher than our peer counties’ average of $770 per employee.
Exhibit 8: Broward’s HR Expense of $872 per FTE is 26% lower than SHRM average
S
ource: Office of the County Auditor Analysis $872 $1,176 $-$200 $400 $600 $800 $1,000 $1,200 $1,400 BROWARD SHRM
HR Expense per FTE
Exhibit 9: Broward’s HR Expense of $872 per FTE is 13% higher than peers’ average
S
ource: Office of the County Auditor Analysis $872 $566 $729 $1,014 $-$200 $400 $600 $800 $1,000 $1,200
BROWARD Palm Beach Hillsborough Pinellas
HR Expense per FTE
16
2008 SHRM Human Capital Benchmarking report; ICMA data not available for this measure. 19
Effectiveness: Focus Group Results and Follow Up Analysis
To accomplish our objective of assessing HRD’s effectiveness as an organization wide service agency, we used focus groups as a tool to gain insights and opinions about HRD’s services. A total of five sessions with 31 participants were held from February 4th through 24th, 2009. Separate focus groups were conducted for ‘central’ HRD
Managers and ‘out posted’ HR Officers and three ‘customer’ groups were composed of middle to upper management staff from Divisions throughout the County.
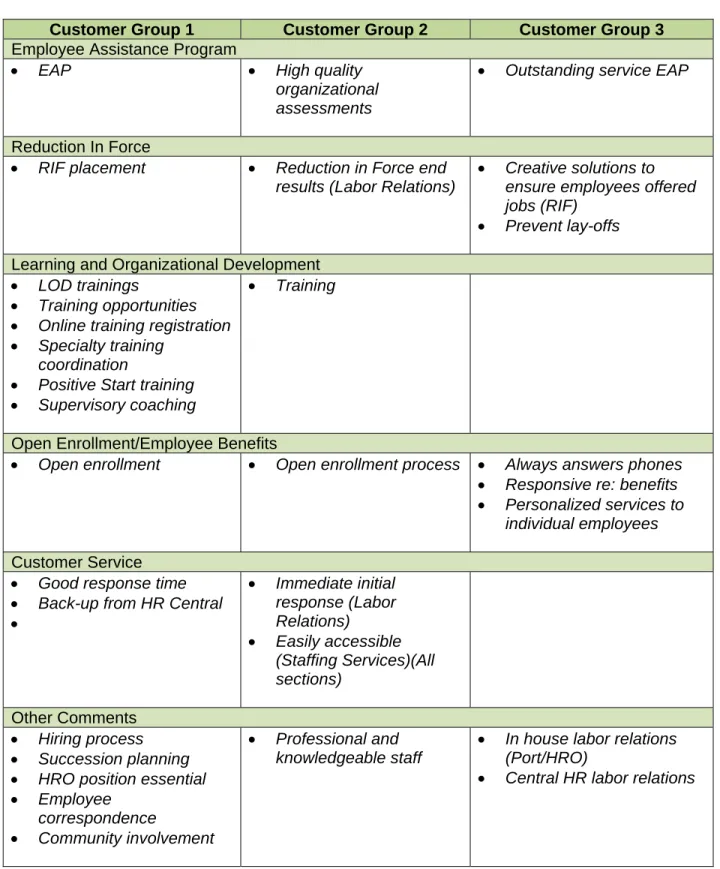
Focus group discussions centered on identifying ‘What Works Well’ and ‘Areas for Improvements’. Participants were asked to identify what they considered to be the most critical areas for improvement and to brainstorm solutions. Summary notes recorded for each session were based on participant consensus. Customer focus groups also
completed a survey rating various HRD functions on a scale of one to ten. Following the completion of all five sessions, survey ratings were averaged and
feedback was reviewed to identify common themes. Appendix A on page 42 provides a listing of participating Department/Divisions. Appendices B and C on pages 43-47, respectively provide a summary of the ratings received and a compilation of all focus group discussion comments.
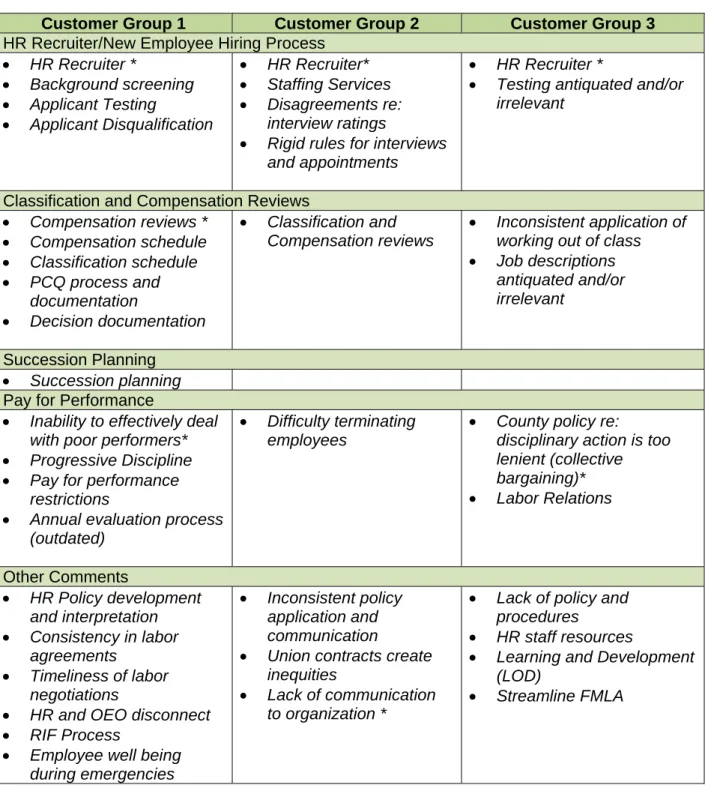
Based on the feedback provided by all groups, we identified four strengths and four areas of concern within HRD services. Functions most positively identified by the groups include: (1) Employee Assistance Program, (2) Employee Training, (3) Open Enrollment, and (4) Reduction in Force. Functions most commonly viewed as needing improvement include: (1) HR Recruiter System/New Hire Process, (2) Succession Planning, (3) Classification and Compensation Reviews, and (4) Performance
Management. Each of these eight subjects is discussed in further detail throughout this section of the report.
What Works Well
EAP, LOD, Open Enrollment and Reduction in Force were recognized for effective service delivery by focus group participants
Employee Assistance Program (EAP)
EAP was recognized as the highest area of success by focus group participants. In group discussions, each of the five groups cited EAP services as “What Works Well”. In our customer survey, “Counseling, referral and case management services” received the highest average rating of 8.6 and “Organizational interventions” received the second highest average rating of 8.4.
The EAP Manager provided us with information about the section’s programs. County employees (or their families) may seek EAP services for a wide range of concerns including depression, stress, substance abuse, and relationship issues. Depending on
needs and individual circumstances, clients may receive short term counseling by EAP staff or referrals to outside counseling services. The goal of the program is to assist employees in resolving emotional difficulties, enabling them to be productive and effective in their work. EAP also completes organizational intervention services which range from supervisory coaching and crisis debriefings to full studies of an agency to determine underlying causes of systemic problems and make recommendations for improvements.
EAP reported to OMB the following performance measure achievements in 2008: • 646 office visits
• 89% of clients follow through with outside referral or obtain services directly through EAP counselors
• 281 organizational intervention related activities
Employee Training (Learning and Organization Development (LOD))
Employee training, as administered by LOD, was also recognized by focus groups as an effective area of service. For example, “Quality of available training courses” received an average customer survey rating of 7.2 and four of five groups acknowledged LOD and/or various training programs as “What Works Well”.
Interviews with the LOD Manager were held to learn more about the programs offered. LOD strives to provide high quality classes to help educate and advance the skills of County employees. LOD continuously surveys training participants, supervisors and managers to determine the effectiveness of its programs. The majority of classes are provided by vendors although LOD and other County staff also play an active role in training. Some of the most valuable courses include: Employee Essentials,
Supervisor’s Apprenticeship, Positive Start, Emerging Leaders and Advanced Facilitation Skills.
Outputs highlighting the work completed by LOD in 2008 include the following: • 251 employees assisted through the Tuition Reimbursement Program
• 245 of learning events offered in 224 instructor led classes and 21 computer based courses
• 29,647 hours of training provided to 3,797 employee participants • 98% of employees rating completed training as helpful in their job
• 98% of class registrations processed electronically through the Registrar system Open Enrollment (Employee Benefits)
Customer focus groups consistently identified Employee Benefits Services and the Open Enrollment process as an area of high satisfaction/performance. For example, “Open Enrollment Process” received an average customer survey rating of 8.4 (tied for second highest score) while “Assistance in handling employee benefit related
actions/concerns” received a similarly high rating of 7.9. Open Enrollment was cited as
“What Works Well” by two of three customer groups; while the third group recognized the section as being responsive regarding benefits.
Based on information obtained through interviews with the Employee Benefits Manager, customer service is a high priority for staff. During open enrollment process, staff
provide educational sessions and ongoing updates to employees to keep them informed of critical submission dates and important changes in benefit programs. The Employee Wellness Resource Center is used to provide health information and educational
sessions to staff and hosts various health programs throughout the year such as “The Biggest Loser”. The section also strives to be responsive to employees planning retirement, seeking assistance with current benefits or making modifications to their benefits as the result of changes in life circumstances.
Noteworthy activities completed by the section in 2008 include the following: • 3,998 employees, or 64% enrolled in benefits using the online system
• 20 open enrollment seminars to educate employees on available health plans • 7 Florida Retirement System seminars with Deferred Compensation vendors • 3 health fairs with 700 attendees
• 800 employees participated in free flu shot campaign
• 6,736 benefit plan employee assistance contacts provided by staff Reduction in Force
The Reduction in Force (RIF) process was also positively recognized by focus groups. The Division’s efforts in this area were cited as “What Works Well” by four of five focus groups. Feedback acknowledged that lay-offs were successfully avoided and that creative solutions were used to ensure employees were offered jobs.
For fiscal years 2008 and 2009, a total of 265 filled positions were eliminated due to budgetary cutbacks. HRD Managers state that although some employees chose to retire or found outside employment prior to the start of the new fiscal year, all remaining affected persons were offered opportunities to remain employed with Broward County. As a result, no employee lay-offs were necessary.
HRD Managers state that the success of the RIF process was due to the cooperative efforts of all sections within the Division. For example, once confirmation of the position being eliminated was received, Labor Relations consulted with unions to determine displacement (“bumping”) rights. When the affected employees were identified, HRD staff personally met with each employee and provided official notice from the HRD Director informing them of the pending circumstances. Employees were provided with resource materials and a webpage to access information and resources. Each person was assigned an HR professional from Staffing Services (and/or other sections as needed) to serve as an employment counselor during the placement process. Counselors met with RIF affected employees to assess their skills and experience and find viable alternative options for continued County employment. Assistance in applying for jobs through HR Recruiter was provided. Employee Benefits
offered retirement counseling and paperwork processing for those who were interested in this option. Learning and Organizational Development scheduled training classes in resume writing, interviewing and career planning which were led by Staffing Services. Individuals experiencing stress or emotional challenges during this time were assisted through the Employee Assistance Program. Finally, Compensation and Records provided access to employee files for review by interviewing Divisions, handled
classification and compensation issues and processed all resulting BC-102-102s once placements were completed.
Areas for Improvements
HR Recruiter/New Hire Process, Compensation and Classification Reviews, Succession Planning and Performance Management were identified as areas of concern by focus group participants
HR Recruiter and New Hire Process
Customer focus groups consistently identified the HR Recruiter electronic employment application system and the hiring process as an area for improvement. Participants voiced dissatisfaction with the HR Recruiter system and had specific concerns about the application pre-screening process for ‘rated’ positions. All three customer groups
considered this to be a critical issue. Primary complaints focused on a lack of pre-screening, the quality of referred candidates, challenges in using HR Recruiter and the length of time to fill a position. The average customer survey rating for “Referring qualified candidates” was relatively low at 5.9.
Therefore as part of our review, we sought to evaluate the work completed by the Staffing Services (Staffing) section during the employee recruitment process through the use of HR Recruiter. To accomplish this goal we:
• Interviewed HRD and Staffing Services Managers • Received a demonstration of the HR Recruiter system
• Reviewed HRD’s Internal Control Handbook and other policies or procedures as available
• Reviewed and analyzed data and reports as available and provided by HRD • Reviewed the OMB process improvement study completed in December 2006-
“Filling Vacancies Faster” 17
• Reviewed previous report issued by the Office of the County Auditor on May 2, 2005 - “Review of the Strategic Testing and Recruiting (STAR) System Project and HR Recruiter System” 18
17
In April 2006, ETC Institute completed a Management and Efficiency Study which included an
extensive survey of Broward County employees. In the subsequent report, reducing the time needed to fill job vacancies was identified as a ‘Top Priority for Action’. In response to this identified need, County Administration initiated the process improvement study “Filling Vacancies Faster”.
18
Report # 05-04, issued May 2, 2005
Overall, it appears that HRD has made some improvements to its new hire processes and significant prescreening activities are being completed. However, additional steps need to be taken to further increase process efficiency and customer satisfaction. HR Recruiter and Application Rating Process Overview
HR Recruiter is a web based employment application and review system which has been in use by Broward County since June 2004. The system allows interested members of the public to create profiles, upload resumes and list years of relevant job experience. Persons can apply for employment vacancies listed under “Hot Jobs” or can link their profile to positions of interest, should an opening occur in the future. Of the 1,000 available position classifications within County employment, 617 or 62% are presently contained in the system.19 Approximately 20% of these classifications are for ‘tested’ positions where the applicant may take a test (or a series of tests) and be placed in a ranked listing of eligible candidates, while 80% of position classifications are filled through an application rating and interview process. According to HRD Managers, ‘tested’ positions represent 66% of the Division’s recruitment and placement activities, while ‘rated’ positions represent 34% of the activity. Based upon focus group feedback, the hiring of applicants using the rating system was examined in additional detail. When vacancies in County employment are posted, it is common for there to be a large number of applications submitted through HR Recruiter. When the vacancy is for a ‘rated’ position, each application requires review to determine if the candidate
possesses the needed skills, knowledge or experience to fill the position. Typically this rating process is completed by the human resources professional and two persons from the hiring agency who are considered ‘subject matter experts’. However, prior to
forwarding a list of all applicants to the hiring agency for rating, the assigned HRD staff person may ‘pre-screen’ the applications. 20 During the pre-screening process, the Staffing employee reviews the applications and eliminates candidates who do not meet minimum job requirements. This decreases the total number of applications requiring a formal rating by the hiring agency. By reducing the number of applications to be rated, the hiring agency should have a both a reduced workload as well as a refined list of clearly eligible candidates.
HRD lacks formal policies to guide staff through employee recruitment and application prescreening and rating processes
During our review we found that HRD lacks formal policies to guide their staff through the current recruitment processes. As a result we cannot determine if application
19
HRD states that the majority of the remaining positions are for single person incumbent classifications such as Division Directors.
20
Steps described in this process may be completed by the Staffing Services section, or Human Resource Officers.
screening or ratings were completed in accordance with desired practices or established criteria.
For example, the Internal Control Handbook, Chapter 2, ‘Filling a Vacant Position’ only provides guidance in completing paper based employee recruitment. This section of the handbook was last updated in February 2005, eight months after the implementation of the HR Recruiter system in June 2004. However, the latest update failed to incorporate the HR Recruiter system, electronic submission of job applications, electronic testing or on-line application rating and review. In response to our concerns, HRD Managers state the entire ICH is currently being updated.
Secondly, HRD Managers acknowledge that there is no written policy or guideline for their staff regarding pre-screening, although the practice has been in place since June 2005. HRD Managers state that “pre-screening involves the independent judgment of experienced HR professionals in the evaluation of a candidate’s background in relation to the minimum requirements for a position”; as such, staff are generally instructed to remove applicants who are “clearly ineligible” for the position under consideration, “giving the benefit of the doubt to the candidate”.
Written policies are important tools to guide staff and help ensure that services are delivered in a consistent and efficient manner directed at achieving desired outcomes.
Due to limited data, we cannot fully determine the extent of pre-screening activities
In interviews, HRD Managers acknowledged that pre-screening is not consistently completed in all cases. Reasons why pre-screening may not occur include: receipt of few applications overall indicating pre screening is not a priority, HRD staff person workload, or the hiring agency’s request to have immediate access to applications, precluding HRD’s ability to pre-screen. As HRD staff do not track the number of
applicant lists that have been pre-screened prior to forwarding to the hiring agency, we were not able to determine how often pre-screening actually occurs.
This information was important to our review, based upon the feedback received from our focus group stakeholders. Therefore, to evaluate the extent to which prescreening occurs, additional analysis was required.
By removing ineligible candidates from consideration, pre-screening has
increasingly reduced the number of applications to be rated from 18 to 63% from fiscal years 2005 through 2008
We asked Staffing to provide us with data regarding the total number of applications received for rated positions and the actual number of applications rated. The difference between these two numbers reflects the number of applications removed from the rating process by pre-screening. As shown in Exhibit 10 on the following page, pre-screening activities have significantly reduced the number of applications requiring rating by the
hiring agency. Specifically, in fiscal year 2005, only 18% of all applications were
eliminated during the prescreening process, requiring 82% of all submitted applications to be rated by the hiring agency. By fiscal year 2008, increased prescreening activities resulted in 63% of all applications being eliminated prior to review by the hiring agency, leaving a reduced workload requiring only 37% of submitted applications to be
reviewed. Exhibit 11 below graphically demonstrates the number of applications rated and the number of applications eliminated through prescreening for fiscal years 2005 through 2008. HRD Managers note that the number of applications eliminated through pre-screening depends on the number of applications received and the quality of the candidates applying for the position; both of which are highly dependent upon the local labor market.
Exhibit 10: From fiscal years 2005 through 2008, prescreening activities have eliminated 18% to 63% of ineligible applications from the need for additional review
2005 2006 2007 2008
# Applications for rated requisitions 28,695 37,668 26,673 30,850 # Applications rated 23,660 23,582 12,965 11,406 # Applications eliminated through prescreening 5,035 14,086 13,708 19,444 % Applications eliminated through prescreening 18% 37% 51% 63% % Applications rated 82% 63% 49% 37%
Source: Office of the County Auditor analysis of HRD data
Exhibit 11: Prescreening activities help to eliminate ineligible applications from the rating process
Source: Office of the County Auditor analysis of HRD data 0 5,000 10,000 15,000 20,000 25,000 30,000 35,000 40,000 2005 2006 2007 2008
Application Prescreening Activity
# Applications Eliminated through Prescreening
# Applications Rated
To further analyze the rating process, we calculated the number of applications rated by the hiring agency per posted vacancy. As demonstrated in Exhibit 12 on the following page, from fiscal year 2005 to 2008, the average number of applications which require rating has generally decreased from 42.4 to 33.8 (20.3%). HRD Managers state that
recent fluctuations in the number of rated applications may be due to reduction in force protocols where applications for displaced County employees are given additional consideration across multiple positions.
Exhibit 12: The average number of applications rated per requisition has generally declined 20% from fiscal years 2005 to 2008
Source: Office of the County Auditor analysis of HRD data 42.4
36.6
27.1
33.8
2005 2006 2007 2008
# Applications Rated per Requisition
Based on the results of these analyses, it appears that the pre-screening process significantly reduces the workload of hiring agency. However, to examine the
effectiveness of pre-screening services, we requested that Staffing Services provide us with actual candidate ratings, but the complete set of data has not been retained by the HR Recruiter system. This information would have been useful to determine if the prescreening process/criteria effectively removes all ineligible persons, or if additional applications could potentially be eliminated, further increasing the value of the services provided.
Additional communication by HRD during the recruitment process may help improve customer service perceptions regarding prescreening
The feedback received by the focus groups that prescreening does not occur appears to be in conflict with the activities evidenced in Exhibits 10-12 above. However, we note that HRD does not communicate to the hiring agency the results of its prescreening reviews. This omission may inadvertently be contributing to user dissatisfaction levels. For example, some agencies may be unaware that the prescreening process is in place or the benefits that have been realized through the elimination of ineligible applications. Secondly, in a rush to fill a vacancy, agencies may be unknowingly requesting applicant lists immediately after a posting closes, thus preventing HR staff from completing this important task which could have reduced the workload of hiring agency raters. By consistently completing pre-screening activities in coordination and communication with the hiring agency, HRD may improve customer satisfaction.