COMPUTERS, NETWORKS, & JOLIET
JUNIOR COLLEGE STUDENTS
O
ffi
ce of Institutional E
ff
ectiveness
August 2005
COMPUTERS, NETWORKS, & JOLIET
JUNIOR COLLEGE STUDENTS
O
ffi
ce of Institutional E
ff
ectiveness
Summary
• JJC and college students in general are increasing networked. More students will expect to use the internet and computers for personal, college, and work-related tasks, in the process integrating and using technology in nearly every aspect of their lives. Hence, current and future JJC students will in
-creasingly look to the internet for services and as a learning tool. In the near future, these trends will not be dependent on age, gender, race, income or linguistic-minority status. • JJC does an excellent job of providing access to computers
and networks for students. For instance, about 90% of JJC students report having access to e-mail through their college compared to a national rate of about 40%.
• Paradoxically, when asked about JJC’s contribution learning in regard to computer use, students give JJC very low marks. This gap between access and contribution to learning suggests JJC faculty and staff may not integrate technology into learn
-ing and services in mean-ingful ways.
• More students are learning the most about JJC through the internet to the detriment of a schedule or catalog. This sug
-gests marketing efforts should incorporate the internet and, in the long run, eventually replace traditional methods. • Instead of using technology as a tool to enhance learning, it
could be that many instructors view technology as merely a tool for organizing course materials and to communicate with students, with little attention paid to how using technology can positively impact learning. On the service side, students who are not as competent with technology may be missing an excellent learning opportunity, while competent
students could place little value on services that are widely available for use, but not marketed or advocated or used by staff.
Data Source
Data for this report comes from the Faces of the Future Survey. The Of -fice of Institutional Effectiveness conducts the Faces of the Future Survey every fall semester. More background information about the survey can be found at the Office of Institutional Effectiveness website at www.jjc.edu/admin/ie.
Computer Costs
F
I G U R E 1 .P
E RC E N T O FC
O M M U N I T YC
O L L E G ES
T U D E N T S W H OE
N C O U N-T E R E D
P
RO B L E M S W I T HC
O M P U T E RC
O S T SUse of Internet & E
-
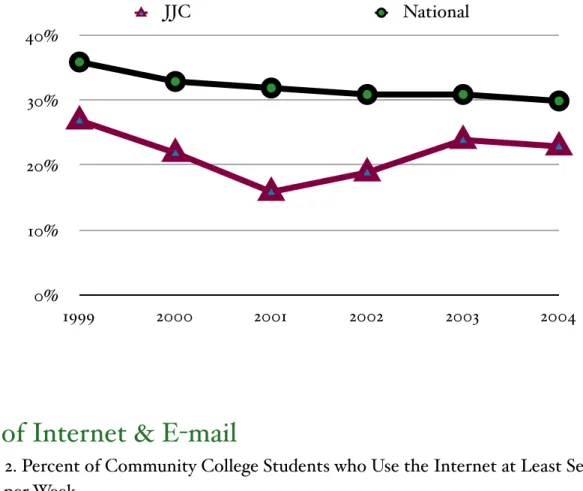
Figure 2. Percent of Community College Students who Use the Internet at Least Several
Times per Week
JJC
National
0
%
10
%
20
%
30
%
40
%
1999
2000
2001
2002
2003
2004
JJC
National
45
%
52
%
59
%
66
%
73
%
80
%
1999
2000
2001
2002
2003
2004
E
-
mail Access through the College
F
I G U R E 3 .P
E RC E N T O FC
O M M U N I T YC
O L L E G ES
T U D E N T S W H OH
AV EE
-M A I L
A
C C E S S T H RO U G H T H E I RC
O L L E G EWeb Access through the College
Figure 4. Percent of Community College Students who Have Internet Access through their
College
JJC
National
0
%
18
%
36
%
54
%
72
%
90
%
2000
2001
2002
2003
2004
JJC
National
50
%
59
%
68
%
77
%
86
%
95
%
2000
2001
2002
2003
2004
Finding Out About Joliet Junior College
F
I G U R E 5.W
H E R EJ
O L I E TJ
U N I O RC
O L L E G ES
T U D E N T SL
E A R N T H EM
O S TA
B O U T T H E I RC
O L L E G E B E F O R EE
N RO L L I N GF
I G U R E 6 .P
E RC E N T O FJ
O L I E TJ
U N I O RC
O L L E G ES
T U D E N T SW
H OL
E A R N T H EM
O S TA
B O U T T H E I RC
O L L E G E B YS
O U RC E , 1 9 9 9-2 0 0 4Newspaper/TV/Radio
Employer
Catalog
HS Teacher/Counselor
Family Member/Friend
Internet
Other
Other
13
%
Internet
9
%
Family Member/Friend
33
%
HS Teacher/Counselor
22
%
Catalog
18
%
Employer
1
%
Newspaper/TV/Radio
3
%
TV/Newspaper/Radio
Employer
Catalog
HS Teacher/Counselor
Family Member/Friend
Internet
1
%
14
%
27
%
40
%
1999
2000
2001
2002
2003
2004
Contribution to Learning
F
I G U R E 7.P
E RC E N T O FC
O M M U N I T YC
O L L E G ES
T U D E N T S W H OF
E E L T H E I RC
O L L E G E H A S M A D E AM
A J O RC
O N T R I B U T I O N T O T H E I RG
ROW T H I NL
E A R N I N G T OU
S E AC
O M P U T E R F O RW
O R KT
A S K SF
I G U R E 8 .P
E RC E N T O FC
O M M U N I T YC
O L L E G ES
T U D E N T S W H OF
E E L T H E I RC
O L L E G E H A S M A D E AM
A J O RC
O N T R I B U T I O N T O T H E I RG
ROW T H I NL
E A R N I N G T OU
S E AC
O M P U T E R F O RP
E R S O N A LT
A S K SJJC
National
10
%
15
%
20
%
25
%
30
%
35
%
1999
2000
2001
2002
2003
2004
JJC
National
10
%
15
%
20
%
25
%
30
%
35
%
1999
2000
2001
2002
2003
2004
Detailed Tables
Table 1. How Much Has the Paying for a Computer Been a Problem for You While Taking Courses at this College?
Year
Major problem Moderate problem Minor problem Not a problem
U.S. JJC U.S. JJC U.S. JJC U.S. JJC
1999 21% 15% 15% 13% 16% 12% 48% 61% 2000 19% 10% 15% 13% 16% 21% 51% 57% 2001 18% 9% 14% 7% 16% 17% 52% 66% 2002 17% 9% 14% 10% 17% 15% 53% 66% 2003 17% 12% 14% 12% 17% 15% 53% 61% 2004 17% 11% 14% 12% 18% 19% 52% 58%
Table 2. How Often Do You Use the Internet or WWW?
Year
Never Several Times a Year
Once a Month Once a Week Several Times a Week
Daily
U.S. JJC U.S. JJC U.S. JJC U.S. JJC U.S. JJC U.S. JJC 1999 11% 10% 11% 13% 10% 9% 15% 19% 27% 26% 26% 22% 2000 7% 6% 7% 9% 8% 8% 15% 16% 31% 31% 33% 29% 2001 6% 2% 7% 4% 8% 7% 15% 18% 30% 34% 34% 36% 2002 4% 2% 6% 2% 7% 6% 15% 13% 31% 30% 38% 46% 2003 4% 3% 5% 4% 6% 6% 15% 15% 31% 33% 39% 39% 2004 3% 1% 4% 3% 5% 6% 13% 12% 31% 30% 44% 48%
Table 3. Percent of Students who Have Access to E-mail and Internet at the Following Locations
Year E-mail at College E-mail at Home E-mail at Work Internet at College Internet at Home Internet at Work U.S. JJC U.S. JJC U.S. JJC U.S. JJC U.S. JJC U.S. JJC 2000 34% 41% 73% 76% 16% 16% 72% 74% 71% 77% 75% 74%
2001 31% 42% 76% 84% 15% 13% 71% 72% 73% 82% 75% 75%
2002 28% 52% 81% 88% 16% 18% 72% 75% 77% 86% 73% 68%
2003 30% 68% 82% 84% 15% 14% 74% 79% 79% 86% 73% 70 %
2004 38% 88% 84% 88% 16% 16% 79% 90% 81% 88% 71% 72%
Table 4. Where Did You Learn the Most About this College Before Enrolling? Year Newspaper, Television, & Radio Employer and Co -worker Catalog or Schedule High School Teacher or Counselor Family Member Internet Other
U.S. JJC U.S. JJC U.S. JJC U.S. JJC U.S. JJC U.S. JJC U.S. JJC 1999 4% 2% 4% 7% 25% 26% 19% 21% 30% 32% 2% 1% 16% 11% 2000 4% 3% 4% 4% 24% 22% 19% 23% 32% 37% 2% 2% 16% 9% 2001 4% 2% 5% 1% 23% 17% 18% 25% 31% 38% 3% 4% 16% 13% 2002 5% 4% 4% 4% 23% 19% 18% 26% 31% 30% 4% 6% 15% 12% 2003 4% 4% 4% 2% 22% 24% 18% 18% 31% 31% 5% 7% 16% 15% 2004 3% 3% 4% 1% 21% 18% 20% 22% 31% 33% 6% 9% 15% 13%
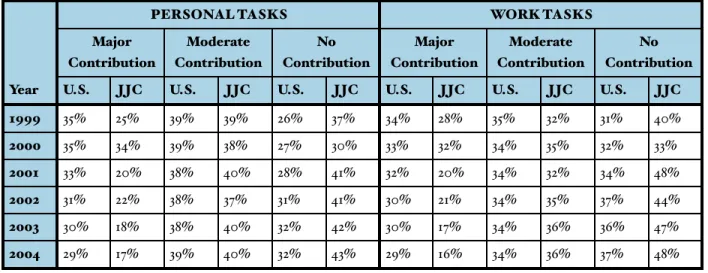
Table 5. How much have your experiences at this college contributed to your growth in learning to use a computer for personal tasks and work tasks?
Year
PERSONAL TASKS WORK TASKS
Major Contribution Moderate Contribution No Contribution Major Contribution Moderate Contribution No Contribution U.S. JJC U.S. JJC U.S. JJC U.S. JJC U.S. JJC U.S. JJC 1999 35% 25% 39% 39% 26% 37% 34% 28% 35% 32% 31% 40% 2000 35% 34% 39% 38% 27% 30% 33% 32% 34% 35% 32% 33% 2001 33% 20% 38% 40% 28% 41% 32% 20% 34% 32% 34% 48% 2002 31% 22% 38% 37% 31% 41% 30% 21% 34% 35% 37% 44% 2003 30% 18% 38% 40% 32% 42% 30% 17% 34% 36% 36% 47% 2004 29% 17% 39% 40% 32% 43% 29% 16% 34% 36% 37% 48%