MOVEMENT EFFECTS ON POLICY ADOPTION AND SOCIO-ECONOMIC OUTCOMES: THE CASE OF AFFORDABLE HOUSING MOBILIZATION IN THE UNITED STATES
Akram Al-Turk
A thesis submitted to the faculty at the University of North Carolina at Chapel Hill in partial fulfillment of the requirements for the degree of Master of Arts in the Department of Sociology
in the College of Arts and Sciences.
Chapel Hill 2016
Approved by:
Kenneth (Andy) Andrews Neal Caren
ABSTRACT
Akram Al-Turk: Movement Effects on Policy Adoption and Socio-Economic Outcomes: The Case of Affordable Housing Mobilization in the United States
(Under the direction of Kenneth (Andy) Andrews)
ACKNOWLEDGEMENTS
TABLE OF CONTENTS
LIST OF TABLES ... i
LIST OF FIGURES ... ii
INTRODUCTION ... 1
THE CASE: AFFORDABLE HOUSING IN THE UNITED STATES ... 4
THE EFFECTS OF COLLECTIVE ACTION ON POLICY OUTCOMES ... 6
DATA AND METHODS ... 10
RESULTS ... 16
CONCLUSION AND DISCUSSION... 21
TABLES AND FIGURES ... 25
APPENDIX A: DATA SOURCES ... 34
APPENDIX B. CODING SCHEME FOR ORGANIZATIONS ... 35
APPENDIX C. CITIES THAT ADOPTED FIRST AFFORDABLE HOUSING POLICY BETWEEN 1990 AND 2009 ... 36
APPENDIX D. COX REGRESSION MODELS WITH LOCAL ELECTION DATA, 1990 – 2009 ... 38
LIST OF TABLES
Table 1. Summary Statistics, City-Year Observations, 1990-2009………25
Table 2. Means of Independent Variables, by Policy Adoption……….27
Table 3. Cox Regression Models of Policy Adoption, 1990 – 2009………...28
Table 4. Means of Independent Variables, by Number of Units Built………....29
Table 5. Fixed Effects Models of Low-Income Units Built (inverse hyperbolic sine), 1990 – 2009……….….30
LIST OF FIGURES
Figure 1. Number of Housing Units Built and Total Number of Policies Adopted …………26
Figure 2. Average Number of Housing Organizations………..………26
Figure 3. Marginal Effects of Policy Adoption on Low-Income Housing Units
By Number of Organizations………31 Figure 4. Marginal Effects of Municipal Spending on Low-Income Housing
Units by Number of Organizations………31 Figure 5. Marginal Effects of Poverty on Low-Income Housing Units By
Number of Organizations……….………32 Figure 6. Marginal Effects of Policy Adoption on Low-Income Housing
INTRODUCTION
Do social movement organizations (SMOs) have an effect on policy impact? Much of the research on the outcomes of SMOs has focused on whether these organizations affect the political process or, in other words, whether they attain different kinds of responsiveness from political actors (Burstein 1991; Schumaker 1975). For example, collective actors may be granted access to policymakers (access responsiveness) (Gamson 1990) or their issue of interest is put on the political agenda, while in other cases, a law that seeks to address the issue is passed or
enforced (policy responsiveness). Less attention has been paid to what Schumaker calls impact responsiveness, the “degree to which the actions of the political system succeed in alleviating the grievances” of those demanding change (1975:495). In other words, while researchers have shown that collective action can have an effect on access, agenda-setting, policy adoption, and policy implementation, less is known about the effects of collective action on the social and economic impact that policies are intended to change.
What do we know about why SMOs have an effect on political responsiveness? Much of the research has suggested that collective actors have an effect on political outcomes when they are able to mobilize resources and if they operate in a favorable political context. In studies that examine the effects of the political environment, researchers find that political context—often measured as the partisan makeup of the electorate—plays a mediating role in the effectiveness of SMOs. The grievances of SMOs and the constituents they may represent are sometimes included in analyses, but much recent social movement research has argued that grievance is a poor predictor of both movement emergence and movement outcomes (but see Simmons 2014). Similarly, social structures—such as poverty and racial makeup—are rarely discussed in social movement outcomes research.
I address the questions above by focusing on the issue of affordable housing in the 200 most populous cities in the United States, and I examine whether SMOs, from 1990 until 2010, had an effect on two outcomes: 1) the adoption of either a housing trust fund or inclusionary zoning ordinance (policy responsiveness), and 2) the number of affordable housing units built with federal tax credits (impact responsiveness). Affordable housing in the United States is an appropriate policy issue for this kind of study for two primary reasons. First, organizations that work to alleviate issues related to affordable housing often focus their efforts on policy
advocacy, service provision (i.e., building housing units), or both, and therefore, unlike some social movement sectors, affordable housing organizations can potentially have a direct effect on both policy adoption and impact (or, alternatively, their impact, if any, on the latter may be indirect).
THE CASE: AFFORDABLE HOUSING IN THE UNITED STATES
According to estimates from the U.S. Census Bureau and the Department of Housing and Urban Development, more than a third of Americans in the mid-2000s either lived in physically
The federal government has historically played the most significant role in both shaping housing policy and providing housing assistance to low-income households. The government has used a mixture of subsidy programs and tax exemptions. Subsidy programs include funding for public housing, provisions for housing vouchers, and block grants to state and local governments to spend on community development and housing projects. The biggest tax exemption program is the Low-Income Housing Tax Credit (LIHTC), which has contributed to the development of at least 1.5 million rental units. The role of the federal government in affordable housing, however, has changed since the 1970s. Two trends are worth noting. The first is that the federal
government, in the mid-1980s, stopped funding the construction of new public housing and shifted much of its funding toward housing vouchers and LIHTC, both of which now account for over half of all federally subsidized rental assistance. The second trend of the last few decades is that more housing policy decisions are now made at the local and state levels.
households through the use of federal funds (Bratt 2006; Swanstrom and Koschinsky 2000; Vidal 2012).
THE EFFECTS OF COLLECTIVE ACTION ON POLICY OUTCOMES
Researchers have argued that the effects of collective action on political outcomes are based, in part, on collective actors’ abilities to mobilize resources and the political context in which they operate. Amenta et al. (2010) show that most recent social movements scholarship also takes into account political mediation, which looks at whether support from political actors affects the success of social movements. Based on studies that conclude that collective action led to a positive outcome, Amenta et al. (2010) find that most (94 percent) saw variations in effects when including mediating factors, such as partisan political context.
Researchers that have examined the effects of movements and advocacy organizations on different policy outcomes have argued that collective actors typically have a greater effect on outcomes in the earlier stages of the policy process (Duffy, Binder, and Skrentny 2010; King et al. 2005; Soule and King 2006). King et al. (2005) argue that each stage in the policy process has more stringent rules than the stage before it, and therefore movements and advocacy
organizations are likely to have less influence during later stages. Drawing on field theory, Duffy et al. (2010) argue that the policy formulation and implementation stages constitute different fields that are governed by different institutional and political logics.
If policy responses operate under different logics, it stands to reason that the factors social movement scholars have argued affect policy outcomes likely have varying effects on those outcomes. A few studies have examined these varying effects. Soule and King (2006) provide evidence from the process to pass the Equal Rights Amendment that, in earlier stages (e.g., the introduction of a bill), social movements, with the presence of political allies, matter because legislative action is less consequential and legislative rules are more lenient. On the other hand, later in the policy formulation stage, they show that the presence of political allies and social movements matters less. Olzak and Soule (2009) argue that social movements, especially those that use non-confrontational protest, have an effect on early stages in the policy process. Based on their case, they suggest that, while movements may not have a direct effect on legislation outcomes, they have an indirect effect—by influencing agenda-setting, which ultimately has an effect on later policy responses.
effect on impact, is that because they had an effect on earlier policy responses, such as agenda-setting and policy adoption, or did collective actors continue to have an influence, as Amenta et al. (2005) suggest, because they continued to be organized and viable?
While many studies of social movement outcomes focus on national-level issues, scholars have also examined the effects of movements and organizations at a more local level (Andrews 2001; Cress and Snow 2000; Martin 2001; Weldon 2011). At the municipal level, researchers have shown that the presence of social movement or advocacy organizations is positively associated with policy outcomes, including environmental sustainability policies, living wage policy adoption, and housing and community development expenditures (Portney and Berry 2015; Swarts and Vasi 2011; Yerena 2015). Although studies of social movement activity at the municipal level examine the same factors thought to influence national-level outcomes, one important distinction is about the policymaking process itself. The factors that influence the decisions being made at the municipal are different from those that influence higher levels of government (Berry and Portney 2014).
Researchers have argued that a number of political factors affect urban policymaking and interest group behavior. These include a city’s level of electoral competition (Trounstine 2006) and the partisanship of the local leadership (Ferreira and Gyourko 2009; Gerber and Hopkins 2011) and the electorate (Palus 2010; Swarts and Vasi 2011; Tausanovitch and Warshaw 2014).
Scholars have found that liberal policies—those that are intended to benefit larger and marginalized segments of society—are often a function of more electoral competition. This is due to the fact that, in theory, competitive elections stimulate higher voter turnout, including among citizens that would benefit from liberal policies (Soule and Olzak 2004). Scholars, however, have found contradictory empirical evidence on this relationship, and the causal
direction between the two is not clear. Trounstine (2006) shows that dominant urban regimes are, controlling for other factors, more likely to win elections by larger margins, and these dominant regimes spend less on public goods such as health and public welfare. One implication of this is that less competitive elections may either lead to or be a reflection of city leaders focusing less on similar public goods such as affordable housing.
DATA AND METHODS
Data for this paper are compiled from multiple sources. The unit of analysis is the city (defined as “place” by the U.S. Census Bureau), and the time period is between 1990 and 2009. Variables are measured annually. My analysis uses data on cities in the United States that had populations above 100,000 people in 1990 (N=200). The reason for this threshold is twofold. First, data availability is limited for smaller cities. Second, the administrative and legislative capacities of smaller cities are different from those of bigger cities, and therefore comparing the two may be misleading. Similar studies that have examined policy outcomes at the city level have used between 50 and 200 cities as their sample size (Martin 2001; McClure, Schwartz, and Taghavi 2015; Meltzer and Schuetz 2010; Metzger 2014).
Dependent Variables
To assess the effects of affordable housing organizations on both policy adoption and policy impact, three dependent variables will be used, one for the former and two for the latter.
Policy Adoption
Approximately 500 jurisdictions in the United States have at least one inclusionary zoning program. Of the 200 cities in my study, twenty-seven adopted at least one of these programs for the first time between 1990 and 2009. Data on these policies come from a database compiled by the National Housing Conference’s Center for Housing Policy in 2014 that relied on previous work done by the Lincoln Institute of Land Policy (National Community Land Trust Network 2014)
Cities also establish housing trust funds to encourage affordable housing. These funds are intended to ensure that adequate and dedicated public funding is used, among other things, toward the production of affordable housing. Thirty-three cities in my sample established a housing trust fund for the first time between 1990 and 2009. The Center for Community Change, a Washington, DC-based nonprofit organization, compiles data about which cities have a
housing trust fund and in what year a fund was established. The Center makes their data available on its website.
Socio-Economic Impact
information such as the project’s address, the number of units built in that project, the year the credit was allocated, the year the credit was placed in service, and other information.
Independent Variables
Data for my main independent variable of interest—affordable housing organizations— come from the Internal Revenue Service (IRS). The IRS updates its Business Master File (BMF) at least quarterly and posts this on its website. The BMF is a list of all tax-exempt organizations in the United States, and it contains over fifty variables—including income, date an organization received recognition of tax-exempt status, location, a National Taxonomy of Exempt Entities code (explained below), and activity codes—on these organizations. Although the IRS updates this information regularly, the file it posts online is a cumulative file and no archive files are available for download. However, the National Center for Charitable Statistics (NCCS) at the Urban Institute downloads this data regularly and provides researchers access to them (for a fee or through library subscriptions) going back to 1989. NCCS slightly modifies the IRS version, most notably by including the latest NTEE code for an organization if it is missing in the IRS file.
purpose of a cross-city study like this, however, it is unlikely that there would be systematic differences between cities or over time.
Political context has been shown to affect the passage of local policies such as living wage ordinances (Swarts and Vasi 2011) and housing policies such as inclusionary zoning (Meltzer and Schuetz 2010). My main political indicator is the partisanship of voters, in presidential elections from 1988 until 2008. Data sources for this measure are found in appendix A. I also include the proportion of city expenditures that are spent on housing and community
development. I use this measure as a potential predictor of both policy adoption and policy impact. The rationale for including municipal expenditures as a predictor of policy adoption is that this measure serves as a proxy for the political will of city officials. I use municipal expenditures as a predictor of policy impact because of a city government’s role in supplementing funding toward affordable housing.
Because of data limitations, I am only able to test the effects of local city politics for 129 cities. I use two measures: the proportion of residents in mayoral elections voting for a
Democratic candidate and the vote difference in those elections (to test the effects of electoral competition). I include this analysis in appendix D.
McKeen, and McGrath 2007). The third and fourth controls are the proportion of state
legislatures that are Democrats and the party of the governor in office (Klarner 2013a, 2013b). A number of city-level characteristics are included to test whether demographic or economic factors have an effect on my outcomes of interest. Demographic data come from the American Community Survey (ACS) or the Decennial Census. A city’s total population is included to ensure that the number of housing units built is not simply a function of the size of a city (Portney 2013), which would potentially have an effect on the resources a city can invest in affordable housing projects. To test whether a city’s level of housing needs (Martin 2001; Swarts and Vasi 2011) have an effect, I included data on poverty rates and racial composition.
I include the number of existing rental housing units that are affordable to low-income households as another control. Using data from the Integrated Public Use Microdata System and from HUD, the Urban Institute, among others, have calculated the number of affordable rental units that are available to extremely low-income renters (i.e., those with incomes below 30 percent of an area’s median income, or AMI). The Urban Institute uses the following formula to calculate adequate, affordable, and available housing units, at the county level, to low-income households in the following way: “affordable occupied units + affordable vacant units – units occupied by higher-income renters – substandard occupied units − substandard vacant units” (Leopold et al. 2015:16). I use their data, available at the organization’s website.
transformation can be interpreted similarly to the log transformation. The ihs is approximately equal to the log(2*x). Finally, in both sets of analyses, I lag all independent variables by one year. Descriptive statistics of all variables are found in table 1.
My analysis proceeds in two steps. I first estimate the effects of all affordable housing organizations, along with political factors and demographic controls, on the likelihood that a city adopts either an inclusionary zoning policy or a trust fund. For this analysis, I use a Cox
proportional hazards models. I only model first “failures,” and therefore once a city adopts a policy, it is removed from the risk set. I use the Efron method to handle ties, as this is typically more accurate than using the Breslow method (Singer and Willett 2003). Because data on organizational characteristics begin in 1989, my starting point for all my analyses begin then. Cities that adopted a policy before 1990 or after 2009 (n=10) are dropped from the risk set.
For these Cox regression models, I tested to see whether the proportional hazards assumption held by examining whether Schoenfeld residuals were correlated with time (Allison 2014). Results from this test show that none of the variables in my Cox regression models is correlated with time. Therefore, the proportional hazards assumption holds.
For my fixed-effect models, I tested to see whether I should use random-effects models instead. I use a Hausmann test. Results indicate that I can reject the null hypothesis that the random-effects model is efficient. Therefore, my use of the fixed-effects model is justified.
RESULTS
Figure 1 shows the time trends of the two dependent variables. The figure shows that forty-six of the two hundred cities in the sample adopted its first affordable housing policy between 1990 and 2009. About one policy a year was adopted in the 1990s, and almost half of the policies were passed in the first half of the 2000s. As for the average number of affordable housing units built, there was a steady increase until around 2003—a number of years before the 2008 financial crisis—when the average number of units began to decline steadily. Figure 2 shows the average number of housing organizations over the same twenty year period, indicating a steady increase in organizations over this time. The number of organizations did decline
slightly during and after the financial crisis.
Policy Adoption
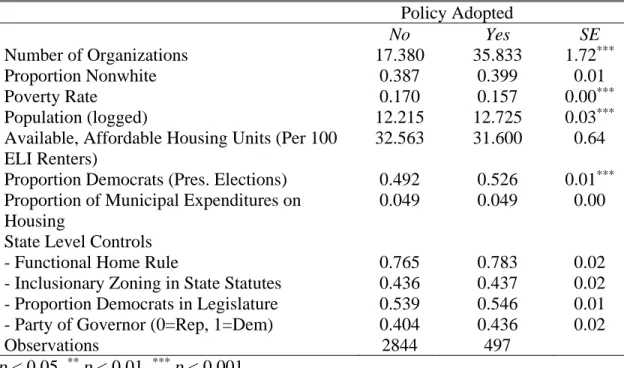
Table 2 presents means of potential explanatory variables for whether a city adopts an affordable housing policy (in cities where a policy was adopted, I measure the mean before a city adopted the policy). The table suggests that the number of organizations is positively associated with policy adoption. The bivariate relationship between political opportunity and policy adoption shows that there is a positive association between the proportion of the electorate that votes for a Democrat and policy adoption.
Appendix A shows a list of the cities that adopted their first affordable housing policy between 1990 and 2009 by poverty quartile and largely confirms this finding. Twenty-eight of the forty-six cities (61 percent) had poverty rates below the median in the year the policy was adopted.
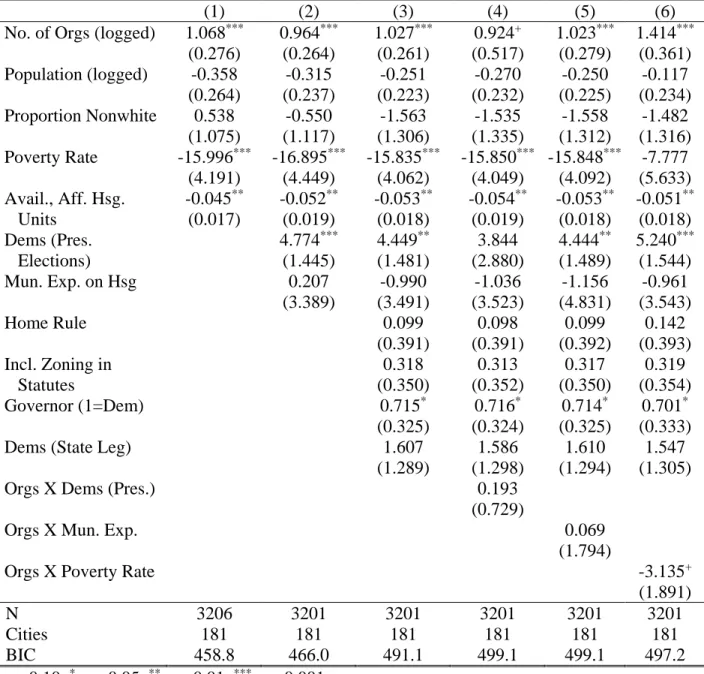
I present cox regression models in table 3 to test whether the above relationships hold in a multivariate analysis. Model 1 includes the number of organizations, along with demographic factors, and model 2 assesses the significance of the proportion of Democrats and the proportion of a city’s budget spent on housing expenditures. Model 3 includes these explanatory variables, along with state-level controls. These first three models produce similar results. The first is that, in all models, the number of housing organizations is positively associated with the likelihood of a policy being adopted. The results of model 3, for example, indicate that a 10 percent increase in the number of housing organizations is associated with a 10.8 percent (exp[1.027/10]) increased likelihood of policy adoption.
Models 1 through 3 in table 3 also show that the proportion of the electorate voting for a Democratic presidential candidate is positively associated with the likelihood of policy adoption, while the share of municipal expenditures that goes toward housing has null effects. The results from model 3 show that a 1 percentage point increase in the number of Democratic voters is associated with a 4.9 percent (exp[4.774/100]) increased likelihood of policy adoption.
Model 4 tests whether the effect of organizations is politically mediated by including an interaction term between the number of organizations and the proportion of people voting for a Democratic presidential candidate. Model 5 tests whether the effect of organizations may depend on municipal expenditures going toward housing. Both models show that these potential
mediating factors do not have an effect on policy adoption. The main effect of both models, however, is positive and at least marginally statistically significant, suggesting that, even in the absence of Democrats or a city’s commitment to fund housing programs and projects, the presence of organizations is positively associated with policy adoption.
Appendix D includes three variables to test the possibility that municipal elections have an effect on policy outcomes. Including these indicators reduces the size of the sample from 181 to 129, and the results suggest that local election results—the proportion of Democratic voters, the presence of a Democratic mayor, and electoral competition—do not have an effect on the likelihood of policy adoption. Further, the predictors found to have an effect in table 3—housing organizations, poverty, available and affordable housing units, the proportion voting for a Democratic presidential candidate, and the party of the state’s governor—continue to have an effect on policy adoption in this model.
Policy Impact
Results from the models in table 4, however, do not confirm some of these bivariate relationships. In particular, all models in the table point to one strong finding that mirrors results from the cox regressions: a city’s poverty rate is inversely related to the number of affordable housing units built. Model 1 in table 5, which includes both demographic variables and political indicators, shows that organizations do not have an effect on the number of units built.
Proportion Democrats and the presence of an affordable housing policy also do not have an effect, while the proportion of municipal spending on housing is positively associated with the number of housing units built. A 1 percentage point increase in municipal spending on housing is associated with a 4.2 percent (exp[4.096/100]) increase in the number of LIHTC housing units built. The poverty rate has a strong, negative association with units built. Results from model 5 indicate that a 1 percent increase in the poverty rate corresponds to a 15.7 percent
(exp[-17.112/100]) decrease in the number of housing units built.
The null findings for the effects of housing organizations and an affordable housing policy in table 5 may be masking some of the interactive effects that policies, organizations, and administrative spending often have on social policy outcomes. The consistently strong, negative effect that poverty has on both policy adoption and impact also requires further examination. Models 2-7 in table 5 and figures 3-5 present results from a number of interaction effects on the number of housing units built.
Model 2 includes an interaction between housing organizations and proportion
positively associated with the number of units built. More specifically, as the number of organizations increases above a particular threshold, the marginal effect of a policy on units built, shown in figure 3, is no longer positive.
Model 5 includes an interaction effect between organizations and municipal spending on housing. The results show that, on their own, organizations have no effect on units built. The interaction effect, shown more clearly in figure 4, on the other hand, suggests that an increase in the number of organizations increases the marginal effects of municipal spending. In other words, a city’s expenditures on housing are positively associated with units built when there are a sufficient number of organizations present and becomes more positive as the number of organizations increases.
The findings from models 2, 3, and 5 in table 5 suggest the following: a higher proportion of Democrats in a city does not affect organizations’ effects on units built, organizations have a positive marginal effect on units built in the absence of a policy (and vice versa), and the marginal effect of administrative spending on housing on units built increases as the number of organizations increases.
marginal effect of a policy being in place is positive in cities with low levels of poverty, and the marginal effect becomes negative in cities with high rates of poverty.
Taken together, figures 5 and 6 suggest the following: as poverty rates increase, the marginal effect of a policy in place on the number of units built decreases, while the marginal effect of organizations increases. These findings, along with the results from model 3—which indicated that policy adoption and the number of organizations may be working at odds with each other—suggest that poverty, policy adoption, and organizations interact together to produce different policy outcomes. If that is the case, it seems likely that organizations have varying effects that depend not only on how impoverished a city is or whether an affordable housing policy is in place, but also on different configurations of these two factors. I test this proposition in model 7 and show the results of the interaction terms in table 6. The results confirm findings from earlier models: organizations have a positive marginal effect on the number of housing units built in cities with higher rates of poverty and especially in high-poverty cities where no policy is in place.
CONCLUSION AND DISCUSSION
effect on socio-economic outcomes and point to three general implications for future research on the outcomes of SMO activity.
First, while SMOs may not have a direct effect on socio-economic outcomes, the findings of this paper suggest that SMOs have a moderating effect. Given that varying socio-economic outcomes are likely a result of the policies in place (if any), the administrative capacity of the implementing agency, and social conditions, it makes sense that SMOs, including those involved in service provision, may only play a minor or behind-the-scenes role. The research question, therefore, may need to shift from “Do SMOs have an effect on socio-economic outcomes to “Under what conditions do SMOs have an effect on socio-economic outcomes.”
The findings from this study suggest that SMOs have the following effects on other factors: 1) they dampen the negative effects of poverty on the number of affordable housing units built, 2) they bolster the effects of administrative spending on units built, and 3) they lessen the effects of an affordable housing policy on units built. I will come back to this third point below. The first two findings, then, indicate that SMOs have a positive, indirect effect on
socio-economic outcomes.
This finding has implications for future research. While much previous research on social movement outcomes examines only one policy domain (Amenta et al. 2010), two of the central findings of this paper—that SMOs have a positive effect on policy adoption, and that those policies influence whether SMOs have an effect on socio-economic outcomes—suggest that not examining multiple domains together potentially masks some of the mechanisms by which SMOs do or do not have an effect. For example, the findings of this paper suggest that the success of SMOs in earlier policy stages may dampen their effects in later stages, not necessarily because of any changes in the SMOs but because the policies in place may actually be working. Disentangling what happens between these stages, therefore, could help us better understand the mechanisms by which movements effect both policy and socio-economic changes.
Finally, this paper tested whether mobilization (the presence of SMOs) and/or political mediation (mobilization in different political contexts) had effects on policy and socio-economic outcomes. The political context was measured in two different ways—the proportion of people voting for a Democratic presidential candidate and the share of expenditures that a city spends on housing. The findings suggest that, when using electoral partisanship, there is little support that political mediation is associated with either policy adoption or impact. On the other hand, another version of political mediation—the effects of organizations conditional on municipal spending—did have a positive association with policy impact—the number of affordable housing units built.
TABLES AND FIGURES
Table 1. Summary Statistics, City-Year Observations, 1990-2009 N Mean Standard
Deviation
Min Max
Policy in Place 3620 0.114 0.318 0 1
LIHTC Units Built 3620 134.914 251.561 0 2994
Number of Organizations 3620 22.063 41.380 0 535
Population (logged) 3620 12.324 0.707 11.342 15.932
Proportion Nonwhite 3620 0.387 0.174 0.078 0.881
Poverty Rate 3620 0.166 0.061 0.032 0.349
Available, Affordable Housing Units (Per 100 Extremely Low-Income (ELI) Renters)
3620 32.035 13.098 8.863 75.769
Proportion Democrats (Pres. Elections)
3620 0.501 0.111 0.190 0.872 Proportion of Municipal Expenditures
on Housing
3620 0.049 0.048 0 0.382
State Level Controls
- Functional Home Rule 3620 0.770 0.421 0 1
Figure 1. Number of Housing Units Built and Total Number of Policies Adopted
Table 2. Means of Independent Variables, by Policy Adoption
Policy Adopted
No Yes SE
Number of Organizations 17.380 35.833 1.72***
Proportion Nonwhite 0.387 0.399 0.01
Poverty Rate 0.170 0.157 0.00***
Population (logged) 12.215 12.725 0.03***
Available, Affordable Housing Units (Per 100 ELI Renters)
32.563 31.600 0.64 Proportion Democrats (Pres. Elections) 0.492 0.526 0.01*** Proportion of Municipal Expenditures on
Housing
0.049 0.049 0.00
State Level Controls
- Functional Home Rule 0.765 0.783 0.02
- Inclusionary Zoning in State Statutes 0.436 0.437 0.02 - Proportion Democrats in Legislature 0.539 0.546 0.01 - Party of Governor (0=Rep, 1=Dem) 0.404 0.436 0.02
Observations 2844 497
Table 3. Cox Regression Models of Policy Adoption, 1990 - 2009
(1) (2) (3) (4) (5) (6)
No. of Orgs (logged) 1.068*** 0.964*** 1.027*** 0.924+ 1.023*** 1.414*** (0.276) (0.264) (0.261) (0.517) (0.279) (0.361) Population (logged) -0.358 -0.315 -0.251 -0.270 -0.250 -0.117
(0.264) (0.237) (0.223) (0.232) (0.225) (0.234) Proportion Nonwhite 0.538 -0.550 -1.563 -1.535 -1.558 -1.482
(1.075) (1.117) (1.306) (1.335) (1.312) (1.316) Poverty Rate -15.996*** -16.895*** -15.835*** -15.850*** -15.848*** -7.777
(4.191) (4.449) (4.062) (4.049) (4.092) (5.633) Avail., Aff. Hsg.
Units -0.045** (0.017) -0.052** (0.019) -0.053** (0.018) -0.054** (0.019) -0.053** (0.018) -0.051** (0.018) Dems (Pres. Elections) 4.774*** (1.445) 4.449** (1.481) 3.844 (2.880) 4.444** (1.489) 5.240*** (1.544)
Mun. Exp. on Hsg 0.207 -0.990 -1.036 -1.156 -0.961
(3.389) (3.491) (3.523) (4.831) (3.543)
Home Rule 0.099 0.098 0.099 0.142
(0.391) (0.391) (0.392) (0.393) Incl. Zoning in
Statutes 0.318 (0.350) 0.313 (0.352) 0.317 (0.350) 0.319 (0.354)
Governor (1=Dem) 0.715* 0.716* 0.714* 0.701*
(0.325) (0.324) (0.325) (0.333)
Dems (State Leg) 1.607 1.586 1.610 1.547
(1.289) (1.298) (1.294) (1.305)
Orgs X Dems (Pres.) 0.193
(0.729)
Orgs X Mun. Exp. 0.069
(1.794)
Orgs X Poverty Rate -3.135+
(1.891)
N 3206 3201 3201 3201 3201 3201
Cities 181 181 181 181 181 181
BIC 458.8 466.0 491.1 499.1 499.1 497.2
Table 4. Means of Independent Variables, by Number of Units Built Number of Units Built Above
Median Among All Cities
No Yes SE
Number of Organizations 10.433 33.928 1.32***
Proportion Nonwhite 0.366 0.408 0.01***
Poverty Rate 0.156 0.176 0.00***
Population (logged) 12.063 12.590 0.02***
Available, Affordable Housing Units
30.178 33.929 0.43***
Proportion Democrats (Pres. Elections)
0.489 0.514 0.00***
Proportion of Municipal Expenditures on Housing
0.053 0.046 0.00***
Policy Adopted 0.084 0.145 0.01***
Observations 1828 1792
Table 5. Fixed Effects Models of Low-Income Units Built (inverse hyperbolic sine), 1990 - 2009
(1) (2) (3) (4) (5) (6) (7)
No. of Orgs (logged) 0.138 (0.156) 0.454 (0.403) 0.159 (0.158) -0.246 (0.302) -0.015 (0.186) 0.148 (0.157) -0.279 (0.257) Population (logged) 0.207 (0.773) -0.059 (0.859) 0.187 (0.772) 0.565 (0.801) 0.360 (0.785) 0.089 (0.776) 0.587 (0.783) Proportion Nonwhite 1.298 (3.956) 0.525 (4.006) 0.473 (3.954) 2.033 (4.076) 1.463 (3.927) 0.470 (3.918) 0.744 (4.015) Poverty Rate -17.112** -17.522** -17.604** -22.459** -16.142** -16.190** -18.560**
(5.591) (5.624) (5.575) (7.228) (5.705) (5.561) (5.967) Avail., Aff. Hsg. Units -0.001 (0.011) -0.003 (0.012) -0.001 (0.011) 0.002 (0.011) -0.004 (0.011) -0.001 (0.011) 0.003 (0.011) Dems (Pres. Elections) 1.347 (1.172) 2.876 (2.020) 1.380 (1.175) 1.197 (1.156) 1.155 (1.179) 1.350 (1.171) 1.176 (1.174) Policy Adopted 0.145 0.202 1.193** 0.137 0.147 1.757**
(0.241) (0.245) (0.442) (0.243) (0.239) (0.619) Mun. Exp. on
Hsg 4.096** (1.434) 4.202** (1.415) 4.168** (1.440) 4.079** (1.443) -0.543 (2.335) 4.216** (1.430) 4.065** (1.468) Orgs X Dems
(Pres.)
-0.642 (0.719) Orgs X Policy
Adopted
-0.339*
(0.132) Orgs X Pov
Rate
2.251 (1.682) Orgs X Mun.
Exp.
2.405* (1.106) Policy X Pov
Rate
-10.262*
(4.281) No Pol., High
Pov
-1.583+ (0.810) No Pol., Low
Pov. -1.073* (0.536) Policy, High Pov. -0.402 (1.211) No Pol., High
Pov X Orgs
0.634* (0.282) No Pol., Low
Pov X Orgs
0.246 (0.202) Policy, High
Pov. X Orgs
0.246 (0.352)
Constant 1.773 4.759 2.357 -2.115 0.183 3.374 -1.313
(9.492) (10.440) (9.510) (9.747) (9.630) (9.571) (9.652)
N 3416 3416 3416 3416 3416 3416 3416
Cities 181 181 181 181 181 181 181
BIC 15439.8 15446.5 15441.9 15445.1 15441.8 15440.9 15466.8
Figure 3.
Figure 5.
Table 6. Marginal Effect of Organizations on Housing Units Built
Policy in Place
Yes No
Poverty Rate
High -0.033 0.355*
Low -0.279 -0.033
APPENDIX A: DATA SOURCES Policy Adoption Years Housing Trust Funds
Center for Community Change Inclusionary
Zoning Ordinances
National Housing Conference’s Center for Housing Policy; Lincoln Institute of Land Policy
Early 1990 - 2009 Policy Impact Affordable Housing Units Built with Low-Income Housing Tax Credits (LIHTC)
U.S. Department of Housing and Urban Development 1990 - 2009
Organizations
Affordable Housing Organizations
Internal Revenue Service; National Center for Charitable Statistics 1989, 1995 - 2009 Political Context Presidential Elections (by county)
U.S. Census Bureau; Federal Elections Project (American University); Charles Stewart
(http://web.mit.edu/cstewart/www/election2004.html)
1988 - 2008 Municipal
Budgets
Census of Governments; Pierson, Hand, and Thompson 2015
1990 - 2009 Local
Elections
Ferreira and Gyourko 2009; Gerber and Hopkins 2011; Tausanovitch and Warshaw 2014
1990 - 2009 Controls Governors and State Legislatures
Klarner 2013a, 2013b 1989 -
2009 State Home
Rule and Inclusionary Zone Statutes
Hollister, McKeen, and McGrath 2007 1989 - 2007
Affordable Housing Supply
Urban Institute; Integrated Public Use Microdata Series
2000 - 2009 Demographic
Factors
U.S. Census Bureau 1990 -
APPENDIX B. CODING SCHEME FOR ORGANIZATIONS
IRS NTEE Codes Keywords
Affordable Housing Organizations
L01 (Housing, Shelter Alliance/Advocacy Organizations); S01 (Community Improvement, Capacity Building Alliance/Advocacy Organizations); S21 (Community Coalitions)
“housing coalition”
S20 (Community, Neighborhood Development, Improvement (General)); S31 (Urban, Community Economic Development); S32 (Rural Development)
“community
APPENDIX C. CITIES THAT ADOPTED FIRST AFFORDABLE HOUSING POLICY BETWEEN 1990 AND 2009
City Poverty Quartile At Time of
Adoption
Year Policy Adopted --- --- ---
Charlotte, NC Low Poverty 2002
Indianapolis, IN Low Poverty 2000
Alexandria, VA Low Poverty 1992
Hayward, CA Low Poverty 2004
Oceanside, CA Low Poverty 1991
Irvine, CA Low Poverty 2003
Stamford, CT Low Poverty 2003
Virginia Beach, VA Low Poverty 2007
Santa Rosa, CA Low Poverty 1992
San Jose, CA Low Poverty 2003
Concord, CA Low Poverty 2004
Citrus Heights, CA Low Poverty 2003
Huntington Beach, CA Low Poverty 2004
--- --- ---
Oxnard, CA Low-middle Poverty 1999
Nashville, TN Low-middle Poverty 2000
Albuquerque, NM Low-middle Poverty 2007
Denver, CO Low-middle Poverty 2002
Portland, OR Low-middle Poverty 1996
Salt Lake City, UT Low-middle Poverty 1991
Pasadena, CA Low-middle Poverty 1991
Durham, NC Low-middle Poverty 2003
Anaheim, CA Low-middle Poverty 2005
Austin, TX Low-middle Poverty 1999
St Paul, MN Low-middle Poverty 1994
Winston-Salem, NC Low-middle Poverty 1991
Yonkers, NY Low-middle Poverty 2008
San Diego, CA Low-middle Poverty 1990
Evansville, IN Low-middle Poverty 2002
--- --- ---
Madison, WI Middle-high Poverty 2004
Louisville, KY Middle-high Poverty 2007
Tucson, AZ Middle-high Poverty 2006
Ann Arbor, MI Middle-high Poverty 2004
New York, NY Middle-high Poverty 2005
Oakland, CA Middle-high Poverty 2003
Sacramento, CA Middle-high Poverty 2000
Tempe, AZ Middle-high Poverty 2009
Minneapolis, MN Middle-high Poverty 2002
--- --- ---
Philadelphia, PA High Poverty 2005
Tallahassee, FL High Poverty 2005
St Louis, MO High Poverty 2001
Long Beach, CA High Poverty 2005
Atlanta, GA High Poverty 2009
Knoxville, TN High Poverty 1993
Los Angeles, CA High Poverty 2002
APPENDIX D. COX REGRESSION MODELS WITH LOCAL ELECTION DATA, 1990 – 2009
(1) Number of Orgs (logged) 0.921**
(0.324) Population (logged) -0.242
(0.269) Proportion Nonwhite -1.980
(1.467)
Poverty Rate -11.978**
(4.403) Avail., Aff. Hsg. Units -0.059** (0.022) Dems (Pres. Elections) 4.468**
(1.732)
Mun. Exp. on Hsg 3.954
(3.695)
Home Rule 0.400
(0.473) Incl. Zoning in Statutes 0.164
(0.409)
Governor (1=Dem) 1.105*
(0.462) Dems (State Legislature) 0.838
(1.806) Dems (Local Elections) 2.626
(2.261)
Democratic Mayor -0.771
(0.635) Vote Diff (Local Elections) -2.381
(1.825)
N 1850
Cities 129
BIC 373.8
REFERENCES
Allison, Paul David. 2014. Event History and Survival Analysis. Second edition. Los Angeles: Sage.
Amenta, Edwin. 2006. When Movements Matter : The Townsend Plan and the Rise of Social
Security. Princeton, N.J.: Princeton University Press.
Amenta, Edwin, Neal Caren, Elizabeth Chiarello, and Yang Su. 2010. “The Political Consequences of Social Movements.” Annual Review of Sociology 36:287––307. Amenta, Edwin, Caren Neal, and Sheera Joy Olasky. 2005. “Age for Leisure? Political
Mediation and the Impact of the Pension Movement on U.S. Old-Age Policy.” American Sociological Review 70(3):516–38.
Andrews, Kenneth T. 2001. “Social Movements and Policy Implementation: The Mississippi Civil Rights Movement and the War on Poverty, 1965 to 1971.” American Sociological Review 66(1):71–95.
Andrews, Kenneth T. and Bob Edwards. 2004. “Advocacy Organizations in the U.S. Political Process.” Annual Review of Sociology 30:479––506.
Ansolabehere, Stephen, Maxwell Palmer, and Amanda Lee. 2014. “Precinct-Level Election Data.” Retrieved (http://hdl.handle.net/1902.1/21919).
Basolo, Victoria. 2000. “City Spending on Economic Development Versus Affordable Housing: Does Inter-City Competition or Local Politics Drive Decisions?” Journal of Urban Affairs 22(3):317–32.
Benedictis-Kessner, Justin de and Christopher Warshaw. 2015. “Mayoral Partisanship and the Size of Municipal Government.” Forthcoming.
Berry, Jeffrey M. and Kent E. Portney. 2014. “The Group Basis of City Politics.” in Nonprofits and advocacy : engaging community and government in an era of retrenchment, edited by R. Pekkanen, S. R. Smith, and Y. Tsujinaka. Baltimore, Maryland: Johns Hopkins University Press.
Bratt, Rachel G. 2006. “Community Development Corporations: Challenges in Supporting a Right to Housing.” Pp. 340–59 in A Right to Housing: Foundation for a New Social Agenda, edited by R. Bratt, C. W. Hartman, and M. E. Stone. Philadelphia, PA: Temple University Press.
Cress, Daniel M. and David A. Snow. 2000. “The Outcomes of Homeless Mobilization: The Influence of Organization, Disruption, Political Mediation, and Framing.” American Journal of Sociology 105(4):1063–1104.
Dahl, Robert. 1961. Who Governs? : Democracy and Power in an American City. New Haven: Yale University Press.
Duffy, Meghan M., Amy J. Binder, and John D. Skrentny. 2010. “Elite Status and Social Change: Using Field Analysis to Explain Policy Formation and Implementation.” Social Problems 57(1):49–73.
Ferreira, Fernando and Joseph Gyourko. 2009. “Do Political Parties Matter? Evidence from U.S. Cities.” The Quarterly Journal of Economics 124(1):399––422.
Gamson, William. 1990. The Strategy of Social Protest. 2nd ed. Belmont, Calif.: Wadsworth Pub.
Gendron, Richard. 2006. “Forging Collective Capacity for Urban Redevelopment: ‘Power To,’‘Power Over,’’ or Both?” City & Community 5(1):5–22.
Gerber, Elisabeth R. and Daniel J. Hopkins. 2011. “When Mayors Matter: Estimating the Impact of Mayoral Partisanship on City Policy.” American Journal of Political Science
55(2):326–39.
Giugni, Marco. 1999. “How Social Movements Matter: Past Research, Present Problems, Future Developments.” Pp. xiii – xxxviii in How Social Movements Matter, edited by M. Giugni, D. | McAdam, and C. | Tilly. Minneapolis: University of Minnesota Press.
Goetz, Edward. 1993. Shelter Burden : Local Politics and Progressive Housing Policy. Philadelphia: Temple University Press.
Green, Gary P. and Arnold Fleischmann. 1991. “Promoting Economic Development A Comparison of Central Cities, Suburbs, and Nonmetropolitan Communities.” Urban Affairs Review 27(1):145–54.
Hajnal, Zoltan L. and Paul G. Lewis. 2003. “Municipal Institutions and Voter Turnout in Local Elections.” Urban Affairs Review 38(5):645––68.
Hollister, Timothy S., Allison M. McKeen, and Danielle G. McGrath. 2007. “National Survey of Statutory Authority and Practical Considerations for the Implementation of Inclusionary Zoning Ordinances.” http://www.inhousing.org/wp-content/uploads/document.pdf. Accessed September 23, 2016.
King, Brayden G., Marie Cornwall, and Eric C. Dahlin. 2005. “Winning Woman Suffrage One Step at a Time: Social Movements and the Logic of the Legislative Process.” Social Forces 83(3):1211–34.
King, Gary et al. 2007. “Record of American Democracy, All Precincts Data Files.” Retrieved (http://hdl.handle.net/1902.1/01956).
Kingdon, John. 1984. Agendas, Alternatives, and Public Policies. New York: Harper Collins. Klarner, Carl. 2013a. “Governors Dataset.” Retrieved (http://hdl.handle.net/1902.1/20408). Klarner, Carl. 2013b. “State Partisan Balance Data, 1937 - 2011.” Retrieved
(http://hdl.handle.net/1902.1/20403).
Leopold, Josh, Liza Getsinger, Pamela Blumenthal, Katya Abazajian, and Reed Jordan. 2015. “The Housing Affordability Gap for Extremely Low-Income Renters in 2013.” Retrieved December 11, 2015 (
http://www.urban.org/sites/default/files/alfresco/publication- pdfs/2000260-The-Housing-Affordability-Gap-for-Extremely-Low-Income-Renters-2013.pdf).
Leroux, Kelly. 2012. “Who Benefits from Nonprofit Economic Development? Examining the Revenue Distribution of Tax-Exempt Development Organizations Among U.S. Cities.”
Journal of Urban Affairs 34(1):65–80.
Martin, Isaac. 2001. “Dawn of the Living Wage The Diffusion of a Redistributive Municipal Policy.” Urban Affairs Review 36(4):470––96.
Marwell, Nicole P. 2010. “Privatizing the Welfare State: Nonprofit Community-Based Organizations as Political Actors.” in Politics and partnerships : the role of voluntary
associations in America’s political past and present, edited by E. Clemens and D. Guthrie. Chicago: University of Chicago Press.
McClure, Kirk. 2013. “Which Metropolitan Areas Work Best for Poverty Deconcentration with Housing Choice Vouchers.” Cityscape 15(3):209–36.
McClure, Kirk, Alex F. Schwartz, and Lydia B. Taghavi. 2015. “Housing Choice Voucher Location Patterns a Decade Later.” Housing Policy Debate 25(2):215–33.
Meltzer, Rachel and Jenny Schuetz. 2010. “What Drives the Diffusion of Inclusionary Zoning?” Journal of Policy Analysis and Management 29(3):578–602.
Meyer, Megan. 2010. “Social Movement Service Organizations: The Challenges and
Consequences of Combining Service Provision and Political Advocacy.” Pp. 533–50 in
Human Services as Complex Organizations, edited by Y. Hasenfeld. Los Angeles: Sage. National Community Land Trust Network. 2014. “National Directory of Inclusionary Housing
Programs.” http://cltnetwork.org/wp-content/uploads/2014/08/National-Directory-of-Inclusionary-Housing-Programs-8-26-14.pdf. Accessed September 23, 2016.
Olzak, Susan and Emily Ryo. 2007. “Organizational Diversity, Vitality and Outcomes in the Civil Rights Movement.” Social Forces 85(4):1561––91.
Olzak, Susan and Sarah A. Soule. 2009. “Cross-Cutting Influences of Environmental Protest and Legislation.” Social Forces 88(1):201––25.
Palus, Christine Kelleher. 2010. “Responsiveness in American Local Governments.” State & Local Government Review 42(2):133––50.
Peterson, Paul. 1981. City Limits. Chicago: University of Chicago Press.
Pierson, Kawika, Michael L. Hand, and Fred Thompson. 2015. “The Government Finance Database: A Common Resource for Quantitative Research in Public Financial Analysis.” edited by F. Emmert-Streib. PLOS ONE 10(6):e0130119.
Portney, Kent. 2013. Taking Sustainable Cities Seriously : Economic Development, the
Environment, and Quality of Life in American Cities. 2nd ed. Cambridge, Mass.: MIT Press.
Portney, Kent E. and Jeffrey M. Berry. 2015. “The Impact of Local Environmental Advocacy Groups on City Sustainability Policies and Programs.” Policy Studies Journal n/a – n/a. Schneider, Mark. 1989. The Competitive City: The Political Economy of Suburbia. Pittsburgh,
Pa.: University of Pittsburgh Press.
Schuetz, Jenny. 2006. “Codebook for the Local Housing Regulation Database.”
Schuetz, Jenny, Rachel Meltzer, and Vicki Been. 2009. “31 Flavors of Inclusionary Zoning: Comparing Policies From San Francisco, Washington, DC, and Suburban Boston.”
Journal of the American Planning Association 75(4):441–56.
Schumaker, Paul D. 1975. “Policy Responsiveness to Protest-Group Demands.” The Journal of Politics 37(2):488––521.
Schwartz, Alex. 2010. Housing Policy in the United States. 2nd ed. New York: Routledge. Simmons, Erica. 2014. “Grievances Do Matter in Mobilization.” Theory and Society 43(5):513–
Singer, Judith D. and John B. Willett. 2003. Applied Longitudinal Data Analysis. Oxford University Press.
Soule, Sarah A. and Brayden G. King. 2006. “The Stages of the Policy Process and the Equal Rights Amendment, 1972–1982.” American Journal of Sociology 111(6):1871–1909. Soule, Sarah A. and Susan Olzak. 2004. “When Do Movements Matter? The Politics of
Contingency and the Equal Rights Amendment.” American Sociological Review
69(4):473––97.
Stone, Clarence. 1989. Regime Politics: Governing Atlanta, 1946-1988. Lawrence, Kan.: University Press of Kansas.
Stucky, Thomas D. 2005. “Local Politics and Police Strength.” Justice Quarterly 22(2):139–69. Swanstrom, Todd and Julia Koschinsky. 2000. “Rethinking the Partnership Model of
Government-Nonprofit Relations: The Case of Community Development.” in Nonprofits in Urban America, edited by R. C. Hula and C. Jackson-Elmoore. Westport, CT: Quorum Books.
Swarts, Heidi and Ion Bogdan Vasi. 2011. “Which U.S. Cities Adopt Living Wage Ordinances? Predictors of Adoption of a New Labor Tactic, 1994-2006.” Urban Affairs Review
47(6):743–74.
Tausanovitch, Chris and Christopher Warshaw. 2014. “Representation in Municipal Government.” American Political Science Review 108(03):605––41.
Trounstine, Jessica. 2006. “Dominant Regimes and the Demise of Urban Democracy.” The Journal of Politics 68(04):879––93.
U.S. Department of Housing and Urban Development. 2015. “Worst Case Housing Needs: 2015 Report to Congress.” Retrieved December 11, 2015
(http://www.huduser.gov/portal//Publications/pdf/WorstCaseNeeds_2015.pdf).
Vasi, Ion Bogdan, Edward T. Walker, John S. Johnson, and Hui Fen Tan. 2015. “‘No Fracking Way!’ Documentary Film, Discursive Opportunity, and Local Opposition against Hydraulic Fracturing in the United States, 2010 to 2013.”” American Sociological Review.
Vidal, Avis C. 2012. “Housing and Community Development.” in The State of Nonprofit America, edited by L. Salamon. Washington, D.C.: Brookings Institution Press. Weldon, Laurel. 2011. When Protest Makes Policy: How Social Movements Represent
Wolman, Harold and David Spitzley. 1996. “The Politics of Local Economic Development.”
Economic Development Quarterly 10(2):115––50.
Yates, Larry Lamar. 2006. “Housing Organizing for the Long Haul: Building on Experience.” Pp. 213–39 in A Right to Housing: Foundation for a New Social Agenda, edited by R. Bratt, C. W. Hartman, and M. E. Stone. Philadelphia, PA: Temple University Press. Yerena, Anaid. 2015. “The Impact of Advocacy Organizations on Low-Income Housing Policy