Author references:
1. Public Health Agency of Canada, Ottawa, Ontario, Canada
2. Dalla Lana School of Public Health, University of Toronto, Toronto, Ontario, Canada 3. Department of Health Sciences, Carleton University, Ottawa, Ontario, Canada
4. Gillings School of Global Public Health, University of North Carolina, Chapel Hill, North Carolina, USA
Correspondence: Minh T. Do, Surveillance and Epidemiology Division, Public Health Agency of Canada, 785 Carling Avenue, Ottawa, ON K1A 0K9; Tel: 613-797-7587; Fax: 613-941-2057; Email: [email protected]
Urinary bisphenol A and obesity in adults: results from the
Canadian Health Measures Survey
Minh T. Do, PhD (1,2,3); Vicky C. Chang, MPH (1,2); Michelle A. Mendez, PhD (4); Margaret de Groh, PhD (1)
This article has been peer reviewed.
Tweet this article
https://doi.org/10.24095/hpcdp.37.12.02
Highlights
• This is the first Canadian study to investigate the association between bisphenol A (BPA) and adiposity measures.
• A higher level of urinary BPA is associated with greater odds of being obese among Canadian adults 18 to 79 years of age.
• Urinary BPA concentration is also positively associated with continu-ous measures of adiposity, includ-ing body mass index and waist circumference.
• Prospective studies with repeated measures are needed to address temporality and improve exposure classification.
prevalence and increasing production of synthetic chemicals, including bisphenol A (BPA).5 BPA is an endocrine-disrupting
chemical commonly found in food and beverages stored in polycarbonate plastic and epoxy resin containers.6 The primary
route of exposure to BPA is through dietary intake, although dermal exposure can also occur from skin contact with thermal paper (e.g. receipts, tickets).6
More than 90% of Canadians7 and
Americans8 have detectable levels of BPA
in their urine, indicating widespread expo-sure in human populations.
In vitro studies have shown that BPA enhances adipocyte cell differentiation, leading to excess fat accumulation.9
Rodent studies have also found BPA expo-sure to increase adipose tissue mass and promote weight gain.10 More recently,
Abstract
Introduction: Exposure to bisphenol A (BPA) has been shown to affect lipid metabo-lism and promote weight gain in animal studies. Recent epidemiological studies also support a link between BPA and obesity in human populations, although many were limited to a single adiposity measure or have not considered potential confounding by dietary factors. The purpose of this study is to examine associations between urinary BPA and adiposity measures in a nationally representative sample of Canadian adults.
Methods: We performed analyses using biomonitoring and directly measured anthropo-metric data from 4733 adults aged 18 to 79 years in the Canadian Health Measures Survey (2007–2011). We used multinomial and binary logistic regression models to esti-mate associations of urinary BPA with body mass index (BMI) categories (overweight vs. under/normal weight; obesity vs. under/normal weight) and elevated waist circum-ference (males: ≥ 102 cm; females: ≥ 88 cm), respectively, while controlling for potential confounders. Linear regression analyses were also performed to assess associations between urinary BPA and continuous BMI and waist circumference measures.
Results: Urinary BPA was positively associated with BMI-defined obesity, with an odds ratio of 1.54 (95% confidence interval [CI]: 1.002–2.37) in the highest (vs. lowest) BPA quartile (test for trend, p = .041). Urinary BPA was not associated with elevated waist circumference defined using standard cut-offs. Additionally, each natural-log unit increase in urinary BPA concentration was associated with a 0.33 kg/m2 (95% CI: 0.10–
0.57) increase in BMI and a 1.00 cm (95% CI: 0.34–1.65) increase in waist circumference.
Conclusion: Our study contributes to the growing body of evidence that BPA is posi-tively associated with obesity. Prospective studies with repeated measures are needed to address temporality and improve exposure classification.
Keywords: bisphenol A, endocrine disruptors, obesity, body mass index, waist
circumference, biomonitoring, Canadian Health Measures Survey
important factors contributing to the obe-sity epidemic.4
Given the dramatic increase in obesity over the past several decades, additional hypotheses are being explored to identify other potentially modifiable risk factors beyond the energy imbalance equation. Ecological studies initially reported a correlation between increasing obesity
Introduction
Obesity is a growing epidemic worldwide and is expected to exceed smoking as a leading contributor to the burden of chronic disease.1,2 In Canada, one in four
adults is obese.3 Excess consumption of
evidence of a relationship between BPA and obesity in humans has emerged but is limited to a small number of populations. To date, epidemiological studies in the USA,11,12 China,13 and Korea14,15 have
reported positive associations between BPA and adiposity measures in adults. Moreover, as an estrogen-like compound, BPA has been shown to affect males and females differently in animal models,16
although evidence of sex differences in the association between BPA and obesity in humans is limited.
Since 2007, the Canadian Health Measures Survey (CHMS) has been collecting bio-monitoring data and anthropometric mea-sures from a nationally representative sample of Canadians. Given widespread exposure to BPA in Canada and existing evidence supporting the link between BPA and obesity, we evaluated associations between urinary BPA and measures of adi-posity in adults aged 18 to 79 years using CHMS data, overall and by sex.
Methods
Data source and study population
This study utilized data from cycles 1 (2007–2009) and 2 (2009–2011) of the CHMS. Details of the CHMS have been described elsewhere.17,18 Briefly, the CHMS
is an ongoing cross-sectional survey that uses a multistage stratified sampling design to collect nationally representative data of the Canadian household popula-tion, excluding persons living on reserves or other Aboriginal settlements, full-time members of the Canadian Forces, and resi-dents of institutions and certain remote regions. Cycle 1 collected data from 5604 respondents aged 6 to 79 years at 15 sites across Canada; cycle 2 collected data from 6395 respondents aged 3 to 79 years at 18 sites. The sample for each cycle repre-sented approximately 96% of the Canadian population in the target age range.
The CHMS consists of an in-home house-hold interview capturing sociodemo-graphic, lifestyle, and health characteristics, followed by a mobile examination centre (MEC) visit for direct physical measures, including anthropometric measurements and collection of blood and urine samples. Written informed consent was obtained from each respondent. Protocols were reviewed and approved by Health Canada and the Public Health Agency of Canada (PHAC)’s Research Ethics Board.
Analyses for this study were restricted to adults aged 18 to 79 years at the time of the MEC visit (cycle 1: n = 3726; cycle 2: n = 3873). We pooled data from two CHMS cycles in order to increase sample size and statistical precision of estimates.19 While
all respondents providing urine samples in cycle 1 (n = 3702) were eligible for measurements of BPA, only a random subset of cycle 2 respondents (n = 1117) was selected for these measures, resulting in a combined sample of 4819 respon-dents. We further excluded pregnant women (n = 37) and respondents with missing urinary BPA and/or creatinine (n = 49), yielding a final sample of 4733 respondents.
Laboratory measurements
Single spot urine samples were collected as midstream urine in cycle 1 and first-catch urine in cycle 2. Cycle 2 respondents were also asked to refrain from urinating 2 hours prior to the MEC visit. The protocol was modified to accommodate new tests for infectious disease markers introduced in cycle 2.18 Despite these changes,
uri-nary BPA levels were similar for the two cycles.6 After collection and aliquoting,
urine samples were frozen at –20°C and shipped on dry ice to the testing labora-tory at the Institut national de santé pub-lique du Québec (Quebec, Canada) for analysis.
Concentrations of total BPA (free and con-jugated) were measured using gas chro-matography–tandem mass spectrometry based on previously described methods.7,20
The limit of detection (LOD) was 0.2 µg/L for both cycles. Concentrations below the LOD (n = 436; 9%) were assigned a value of LOD/2 (0.1 µg/L). We categorized uri-nary BPA concentrations into quartiles (< 0.7 µg/L, 0.7 to 1.2 µg/L, 1.3 to 2.4 µg/L, and > 2.4 µg/L) based on distribution in the overall study population. Additionally, BPA concentrations were natural-log transformed due to skewed distribution and analyzed as a continuous variable.
Urinary creatinine was used to adjust for urine dilution and was measured using the colorimetric end-point Jaffe method.21
Concentrations below the LOD (cycle 1: 0.035 g/L; cycle 2: 0.050 g/L) were coded as missing and excluded from the analy-ses (n = 9) as per Statistics Canada’s guidelines.19 To reduce potential bias
asso-ciated with systematic differences in uri-nary creatinine concentrations across
population characteristics (e.g. sex, age, race/ethnicity), we included creatinine as a covariate in all models instead of standardizing BPA concentrations for creatinine.22
Anthropometric measurements
Our primary outcome of interest was body mass index (BMI), derived from height and weight measured using standard pro-cedures.23 Standing height was measured
to the nearest 0.01 cm using a ProScale M150 digital stadiometer (Accurate Technology Inc., Fletcher, NC, USA). Weight was measured to the nearest 0.1 kg using a Mettler Toledo VLC with Panther Plus terminal scale (Mettler Toledo Canada, Mississauga, ON, Canada). BMI, which was calculated as weight (kg) divided by height squared (m2), was
clas-sified into the following categories: under-weight (< 18.5 kg/m2), normal weight
(18.5 to 24.9 kg/m2), overweight (25.0 to
29.9 kg/m2), obesity class I (30.0 to
34.9 kg/m2), and obesity class II or III
(≥ 35.0 kg/m2).4
As an indicator of abdominal fat, we also examined waist circumference, which was measured to the nearest 0.1 cm at the end of a normal expiration at the mid-point between the bottom of the rib cage and the top of the iliac crest.4 Central obesity
was defined using sex-specific waist cir-cumference cut-offs: ≥ 102 cm in males and ≥ 88 cm in females.4,24
Potential confounders
We identified potential confounders according to previous literature examining the BPA–obesity association in adults.11-15
(≥ 3.0 kcal/kg/day), moderately active (1.5 to 2.9 kcal/kg/day), or inactive (< 1.5 kcal/kg/day).
Given that dietary intake is the primary source of BPA exposure and also a known risk factor for obesity, several dietary mea-sures to control for potential confounding were developed utilizing the semi-quanti-tative food frequency questionnaire in the CHMS, which asked the respondents to report the number of times (per day, week, month, or year) certain types of foods or drinks were consumed over the past year. A diet quality score was derived using a similar approach as the construc-tion of a Mediterranean diet index.25 First,
we grouped food items into seven compo-nents (fruits; vegetables; legumes and nuts; cereals and grains; milk/dairy prod-ucts; fish and seafood; and red/processed meat) and calculated sex-specific median intakes (times per day) for each. With the exception of red/processed meat, all com-ponents were considered beneficial and assigned a value of ‘1’ when intake levels were above the median (red/processed meat intake below the median was assigned ‘1’). The overall diet quality score was determined by summing up
values across all components and was cat-egorized as low (0 to 3), medium (4 to 5), or high (6 to 7). In addition, we also examined consumption frequencies of foods or drinks that potentially contain BPA and/or are known to be “obesogenic” due to their high-energy content. These included sugar-sweetened beverages (e.g. regular/non-diet soft drinks, sport drinks, fruit-flavoured drinks), categorized as < 1 time/week, 1 to 6 times/week, or ≥ 1 time/day; and junk food (e.g. French fries, regular-fat potato/tortilla/corn chips, ice cream), categorized as < 1 time/week, 1 to 4 times/week, or ≥ 5 times/week.
Statistical analysis
To account for the complex sampling design of the CHMS, sampling weights were used in all our analyses.17,18 Variance
estimates were obtained using the boot-strap method. Analyses were performed using SAS version 9.3 (SAS Institute Inc., Cary, NC, USA) and SUDAAN version 11.0.1 (Research Triangle Institute, Research Triangle Park, NC, USA). Statistical signifi-cance was evaluated at p < .05, and tests were two-sided.
Descriptive analyses were conducted to examine distributions of characteristics in the total population and by BPA quartile. The Rao-Scott modified chi-square test was used to determine whether the distri-bution of BPA quartiles differed across cat-egories of each characteristic. Geometric mean (GM) urinary BPA concentrations were also calculated, and differences were assessed using the t-test with Bonferroni-adjusted p-values depending on the num-ber of comparisons.
We used multinomial logistic regression to examine associations between urinary BPA quartiles and BMI, categorized as under/normal weight (< 25.0 kg/m2;
ref-erence category), overweight (25.0 to 29.9 kg/m2), or obesity (≥ 30.0 kg/m2).
Tests for trend across quartiles were per-formed by modelling the median of each BPA quartile as a continuous variable. We also examined natural log-transformed BPA concentration as a continuous vari-able in a separate model. Furthermore, to assess the association between urinary BPA and central obesity (i.e. elevated waist circumference), binary logistic regression was performed. All basic mod-els adjusted for sex, age (continuous years),
TABLE 1
Geometric mean and distribution of urinary bisphenol A concentrations across population characteristics among Canadian adults 18 to 79 years of age (n = 4733), 2007–2011 Canadian Health Measures Survey
Characteristics Na %b GM
(µg/L) 95% CI
Urinary BPA quartile, %b,c
p-valued
1 2 3 4
All 4733 100 1.17 1.10–1.24 26.3 23.3 25.3 25.1
Sex .023
Male 2275 49.8 1.27 1.17–1.38 22.7 23.3 27.3 26.8
Female 2458 50.2 1.08 0.99–1.17 29.9 23.4 23.3 23.5
Age (years) .076
18–29 894 21.6 1.35 1.11–1.65 22.2E 24.3 25.2 28.3
30–39 899 17.4 1.34 1.19–1.50 22.5 22.1 27.4 28.1
40–49 967 21.1 1.07 0.91–1.27 28.8 21.3 22.2 27.7
50–59 602 18.8 1.18 0.98–1.44 23.6E 25.0 31.1 20.3
60–69 858 13.8 0.99 0.83–1.17 30.8 26.5 22.7 20.0
≥ 70 513 7.4 0.94 0.78–1.14 38.2 19.2 19.4 23.2
Race/ethnicity .096
White 3981 81.4 1.18 1.10–1.26 26.1 24.7 24.2 25.0
Non-white 747 18.6E 1.14 0.93–1.39 27.0 17.2 30.0 25.7
Highest level of education .681
Less than secondary school degree 656 12.2 1.11 0.94–1.32 29.0 26.5 21.2 23.2 Secondary school degree 1271 28.9 1.14 0.99–1.32 25.3 25.7 25.4 23.6 Post-secondary degree 2758 59.0 1.19 1.10–1.29 26.2 21.9 25.6 26.4
Characteristics Na %b GM
(µg/L) 95% CI
Urinary BPA quartile, %b,c
p-valued
1 2 3 4
Household income adequacy .534
Low/lower middle 1063 19.2 1.29 1.17–1.43 23.9 21.1 29.1 26.0 Upper middle 1586 31.0 1.09 0.97–1.23 29.0 23.0 25.1 23.0
High 2084 49.8 1.18 1.08–1.27 25.5 24.5 23.9 26.1
Smoking status .445
Never 2365 51.6 1.11 1.02–1.21 27.9 22.4 24.7 25.0
Former 1416 27.1 1.15 1.05–1.27 26.6 24.1 26.6 22.7
Current 952 21.3 1.34 1.14–1.58 22.0 24.7 24.9 28.5
Alcohol consumption .126
0–3 times/month 2426 50.3 1.16 1.07–1.26 27.5 21.6 24.6 26.3 1–6 times/week 1890 41.3 1.21 1.12–1.30 23.7 26.3 25.3 24.7
Daily 417 8.4 1.04 0.85–1.28 31.6 19.3 28.9 20.2
Physical activity .566
Active 1037 21.1 1.27 1.12–1.45 24.0 20.7 26.4 28.9
Moderately active 1215 24.5 1.17 1.02–1.35 26.4 23.0 26.0 24.6 Inactive 2481 54.5 1.13 1.04–1.22 27.1 24.5 24.5 23.9
Diet quality score .515
Low (0–3) 1998 43.7 1.26 1.14–1.39 25.0 21.5 26.4 27.1 Medium (4–5) 1922 40.1 1.14 1.01–1.27 25.7 24.5 26.2 23.6 High (6–7) 781 16.2 1.05 0.88–1.24 30.8 24.8 20.8E 23.6
Sugar-sweetened beverage consumption .182
< 1 time/week 2565 53.2 1.09 1.00–1.20 28.5 24.1 24.8 22.6 1–6 times/week 1419 31.1 1.26 1.16–1.38 22.9 23.3 26.0 27.8 ≥ 1 time/day 748 15.8 1.26 1.09–1.45 25.5 20.8 25.4 28.4
Junk food consumption .095
< 1 time/week 1181 24.6 1.00 0.83–1.20 32.3 25.2 21.3 21.2 1–4 times/week 2739 57.5 1.21 1.13–1.31 25.0 22.4 26.5 26.1 ≥ 5 times/week 811 17.9 1.29 1.11–1.51 22.0 23.7 27.0 27.3
Body mass index (kg/m2) .088
Underweight (< 18.5) 69 1.9E 0.84 0.42–1.67 ––F 49.0E ––F ––F
Normal weight (18.5–24.9) 1730 37.5 1.09 0.96–1.23 28.6 24.0 24.9 22.6 Overweight (25.0–29.9) 1737 35.2 1.21 1.08–1.36 24.9 22.2 26.7 26.2 Obesity class I (30.0–34.9) 744 16.1 1.23 1.00–1.51 28.2 21.6 20.5 29.7 Obesity class II or III (≥ 35.0) 442 9.3 1.34 1.13–1.59 18.8 22.8E 33.0 25.4E
Elevated waist circumference .823
No 2931 64.7 1.17 1.08–1.27 26.0 22.6 26.4 25.0
Yes (males: ≥ 102 cm; females: ≥ 88 cm) 1781 35.3 1.17 1.04–1.33 27.0 23.7 23.6 25.7
Abbreviations: BPA, bisphenol A; CI, confidence interval; GM, geometric mean.
Note: Percentages and GMs were weighted using sampling weights.
a Numbers may not sum up to the total (n = 4733) due to missing data for some variables. b Percentages may not sum up to 100% due to rounding.
c Quartile 1: < 0.7 µg/L; quartile 2: 0.7–1.2 µg/L; quartile 3: 1.3–2.4 µg/L; quartile 4: > 2.4 µg/L.
d p-value from the Rao-Scott modified chi-square test comparing the distribution of BPA quartiles across categories of each characteristic. E Interpret with caution (coefficient of variation is between 16.6% and 33.3%).
F Data do not meet Statistics Canada’s guidelines for release due to extreme variability (coefficient of variation > 33.3%). TABLE 1 (continued)
adults.24 Third, we re-ran the models
excluding respondents with self-reported health professional-diagnosed chronic con-ditions (cardiovascular disease [including heart attack, stroke, and any heart dis-ease], diabetes, and/or kidney disease) that may be related to obesity and BPA exposure/excretion.28,29 Fourth, since the
distribution of full-sample urinary BPA quartiles differed between males and females, we repeated sex-stratified models using sex-specific instead of full-sample quartiles.
Results
Characteristics of the study population, including urinary BPA concentrations, are presented in Table 1. Overall, the GM uri-nary BPA concentration was 1.17 µg/L and urinary creatinine concentration
(con-tinuous g/L). We then constructed multi-variate models by adding individual variables from the list of potential con-founders to the basic models. Variables were included in the final models if they were associated with both the exposure (BPA quartile; p < .20 from chi-square test) and the outcome (BMI or waist cir-cumference category; entered the regres-sion model at p < .20), or if they changed the sex-, age-, and creatinine-adjusted odds ratio (OR) for BPA by > 10%. In addition to sex, age, and urinary creati-nine, all BMI and waist circumference models adjusted for race/ethnicity, alco-hol consumption, and junk food con-sumption; waist circumference models additionally adjusted for sugar-sweetened beverage consumption. We also estimated
associations of urinary BPA (as quartiles or natural log-transformed continuous variable) with continuous measures of BMI and waist circumference using linear regression. Additionally, we stratified our analyses to explore potential effect modifi-cation by sex. Statistical significance of multiplicative interaction terms (sex × BPA) was also tested.
We performed a few sensitivity analyses. First, since fasting status (≥ 10 or < 10 hours) and time of urine collection (morning, afternoon, or evening) may be associated with urinary BPA levels,26,27 we assessed
potential confounding by these variables. Second, we restricted our models to respondents aged 18 to 64 years, as stan-dard BMI and waist circumference classifi-cations may not be applicable to elderly
TABLE 2
Associations between urinary bisphenol A and overweight and obesity (vs. under/normal weight) in adults 18 to 79 years of age, overall and by sex, 2007–2011 Canadian Health Measures Survey
Urinary BPA concentration
Model 1a Model 2b
N Overweight Obesity N Overweight Obesity
OR 95% CI OR 95% CI OR 95% CI OR 95% CI
Overall
Quartile 1 (< 0.7 µg/L) 1345 1.00 Ref 1.00 Ref 1342 1.00 Ref 1.00 Ref Quartile 2 (0.7–1.2 µg/L) 1010 0.94 0.59–1.50 1.05 0.71–1.54 1009 0.91 0.58–1.44 1.01 0.69–1.48 Quartile 3 (1.3–2.4 µg/L) 1210 1.10 0.73–1.67 1.23 0.83–1.81 1208 1.09 0.70–1.70 1.26 0.85–1.87 Quartile 4 (> 2.4 µg/L) 1157 1.18 0.76–1.83 1.56 1.02–2.38 1156 1.14 0.73–1.77 1.54 1.002–2.37
p-trendc .322 .036 .394 .041
Log BPA (continuous) 4722 1.05 0.90–1.22 1.15 1.01–1.31 4715 1.03 0.89–1.20 1.15 1.004–1.31
Males
Quartile 1 (< 0.7 µg/L) 537 1.00 Ref 1.00 Ref 537 1.00 Ref 1.00 Ref Quartile 2 (0.7–1.2 µg/L) 483 1.14 0.57–2.27 1.26 0.64–2.49 483 1.05 0.52–1.14 1.08 0.52–2.25 Quartile 3 (1.3–2.4 µg/L) 635 1.44 0.72–2.90 1.42 0.64–3.17 633 1.41 0.69–2.92 1.45 0.60–3.49 Quartile 4 (> 2.4 µg/L) 618 1.51 0.81–2.82 1.77 0.78–4.01 618 1.43 0.74–2.74 1.60 0.67–3.80
p-trendc .208 .193 .248 .266
Log BPA (continuous) 2273 1.17 0.95–1.45 1.19 0.94–1.52 2271 1.16 0.93–1.44 1.17 0.91–1.51
Females
Quartile 1 (< 0.7 µg/L) 808 1.00 Ref 1.00 Ref 805 1.00 Ref 1.00 Ref Quartile 2 (0.7–1.2 µg/L) 527 0.83 0.42–1.65 0.90 0.49–1.66 526 0.84 0.42–1.66 0.93 0.52–1.68 Quartile 3 (1.3–2.4 µg/L) 575 0.86 0.45–1.64 1.12 0.56–2.23 575 0.86 0.44–1.67 1.16 0.60–2.27 Quartile 4 (> 2.4 µg/L) 539 0.95 0.49–1.85 1.41 0.72–2.75 538 0.93 0.46–1.86 1.47 0.77–2.81
p-trendc .960 .211 .973 .169
Log BPA (continuous) 2449 0.92 0.77–1.11 1.12 0.92–1.36 2444 0.91 0.75–1.10 1.12 0.93–1.36
Abbreviations: BPA, bisphenol A; CI, confidence interval; OR, odds ratio; Ref, reference category.
a Adjusted for sex (overall model only), age, and urinary creatinine concentration.
b Adjusted for Model 1 covariates plus race/ethnicity, alcohol consumption, and junk food consumption.
(95% confidence interval [CI]: 1.10–1.24). GMs decreased with age and were signifi-cantly higher among males and those who consumed junk food ≥ 5 times/week (all
p < .05; data not shown). With the excep-tion of sex (p = .023), the distribution of BPA quartiles did not differ by any of the characteristics.
As shown in Table 1, 60% of Canadian adults were overweight (35%) or obese (25%), and 35% had an elevated waist circumference (i.e. centrally obese). GM urinary BPA concentrations increased with BMI, from 0.84 µg/L (95% CI: 0.42– 1.67) and 1.09 µg/L (95% CI: 0.96–1.23) among underweight and normal weight individuals, respectively, to 1.34 µg/L (95% CI: 1.13–1.59) among those in the class II/III obese categories (p-trend = 0.06). BPA concentrations did not differ by waist circumference category.
Table 2 presents associations of urinary BPA with BMI-defined overweight and obesity, overall and by sex. In the overall model adjusted for sex, age, and urinary creatinine (model 1), respondents in the highest BPA quartile had a significantly higher odds of being obese (vs. under/ normal weight) compared to those in the lowest quartile (OR = 1.56, 95% CI: 1.02– 2.38), with an increasing trend across increasing quartiles (p-trend = .036). Results remained largely unchanged fol-lowing additional adjustment for potential confounders (model 2) (OR [quartile 4 vs. 1] = 1.54, 95% CI: 1.002–2.37; p-trend = .041). Similarly, natural log-transformed BPA (continuous) was positively associ-ated with obesity (OR = 1.15, 95% CI: 1.004–1.31). For the overweight category, associations were generally positive but nonsignificant, with an OR of 1.14 (95% CI: 0.73–1.77) in the highest (vs. lowest) BPA quartile. When results were exam-ined by sex, associations between urinary BPA and both overweight and obesity did not reach statistical significance in either sex. Although there was no evidence of a significant sex × BPA interaction (p > .05; data not shown), we observed stronger positive associations in males than females for both overweight (OR [quartile 4 vs. 1] = 1.43 vs. 0.93) and obesity (OR [quartile 4 vs. 1] = 1.60 vs. 1.47).
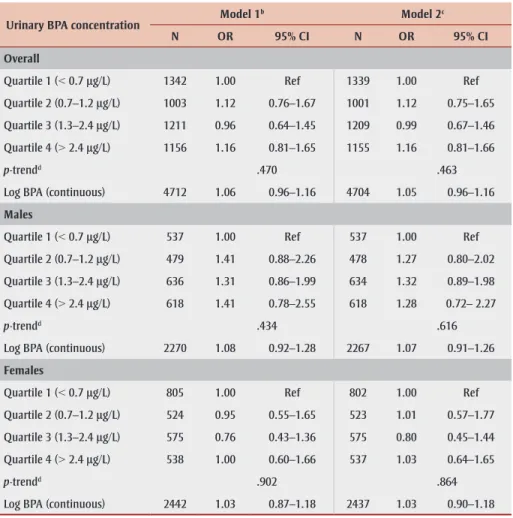
We did not find significant associations between urinary BPA and central obesity, overall (OR [quartile 4 vs. 1] = 1.16, 95% CI: 0.81–1.66; p-trend = .463) or by sex
(Table 3). Sex-stratified models suggested a stronger association in males than females (OR [quartile 4 vs. 1] = 1.28 vs. 1.03), although a statistically significant interaction was not found (p > .05; data not shown). Additional adjustment for height in the models to control for overall stature did not alter the results (data not shown).
Figure 1 presents associations of urinary BPA quartile with continuous measures of BMI and waist circumference. Respond-ents in the third and fourth BPA quartiles had significantly greater BMI (1.03 kg/m2,
95% CI: 0.30–1.76; and 1.06 kg/m2, 95%
CI: 0.18–1.93, respectively) compared to those in the first quartile. A similar pat-tern was observed for waist circumfer-ence, although statistical significance was
reached in the third (2.42 cm, 95% CI: 0.46–4.39) but not the fourth (2.73 cm, 95% CI: –0.14 to 5.60) quartile. Further-more, each natural-log increase in urinary BPA concentration was associated with a 0.33 kg/m2 (95% CI: 0.10–0.57) increase
in BMI and a 1.00 cm (95% CI: 0.34–1.65) increase in waist circumference (Table 4), with slightly stronger associations in females (p for interaction > .05; data not shown).
In our sensitivity analyses (data available by request), inclusion of fasting status or time of urine collection did not change effect estimates by > 10% in any of the models, indicating that these variables did not confound the associations observed. Next, analyses restricted to adults aged 18 to 64 years yielded similar results, with
TABLE 3
Associations between urinary bisphenol A and central obesitya in adults 18 to 79 years of age, overall and by sex, 2007–2011 Canadian Health Measures Survey
Urinary BPA concentration Model 1
b Model 2c
N OR 95% CI N OR 95% CI
Overall
Quartile 1 (< 0.7 µg/L) 1342 1.00 Ref 1339 1.00 Ref Quartile 2 (0.7–1.2 µg/L) 1003 1.12 0.76–1.67 1001 1.12 0.75–1.65 Quartile 3 (1.3–2.4 µg/L) 1211 0.96 0.64–1.45 1209 0.99 0.67–1.46 Quartile 4 (> 2.4 µg/L) 1156 1.16 0.81–1.65 1155 1.16 0.81–1.66
p-trendd .470 .463
Log BPA (continuous) 4712 1.06 0.96–1.16 4704 1.05 0.96–1.16
Males
Quartile 1 (< 0.7 µg/L) 537 1.00 Ref 537 1.00 Ref Quartile 2 (0.7–1.2 µg/L) 479 1.41 0.88–2.26 478 1.27 0.80–2.02 Quartile 3 (1.3–2.4 µg/L) 636 1.31 0.86–1.99 634 1.32 0.89–1.98 Quartile 4 (> 2.4 µg/L) 618 1.41 0.78–2.55 618 1.28 0.72– 2.27
p-trendd .434 .616
Log BPA (continuous) 2270 1.08 0.92–1.28 2267 1.07 0.91–1.26
Females
Quartile 1 (< 0.7 µg/L) 805 1.00 Ref 802 1.00 Ref Quartile 2 (0.7–1.2 µg/L) 524 0.95 0.55–1.65 523 1.01 0.57–1.77 Quartile 3 (1.3–2.4 µg/L) 575 0.76 0.43–1.36 575 0.80 0.45–1.44 Quartile 4 (> 2.4 µg/L) 538 1.00 0.60–1.66 537 1.03 0.64–1.65
p-trendd .902 .864
Log BPA (continuous) 2442 1.03 0.87–1.18 2437 1.03 0.90–1.18
Abbreviations: BPA, bisphenol A; CI, confidence interval; OR, odds ratio; Ref, reference category.
a Waist circumference ≥ 102 cm in males and ≥ 88 cm in females.
b Adjusted for sex (overall model only), age, and urinary creatinine concentration.
c Adjusted for Model 1 covariates plus race/ethnicity, alcohol consumption, junk food consumption, and sugar-sweetened
bever-age consumption.
slightly stronger associations for obesity (OR [quartile 4 vs. 1] = 1.64, 95% CI: 1.01–2.66; p-trend = .018), as compared to analyses conducted on the full sample. Similarly, when we restricted our analyses to respondents without specific chronic conditions, results did not change appre-ciably. Finally, when sex-stratified analy-ses were repeated using sex-specific instead of full-sample quartiles, effect esti-mates changed slightly (e.g. OR for obe-sity was attenuated in both sexes for quartile 4 vs .1) but were generally in the same direction, with stronger positive associations consistently observed in males.
Discussion
Using data from the CHMS, our study pro-vides, for the first time, an examination of
associations between BPA and indicators of obesity in the general Canadian adult population. We found that urinary BPA was positively associated with BMI-defined general obesity in a dose-depen-dent manner and that this association persisted after controlling for potential confounders, including diet-related fac-tors. These findings are consistent with other large-scale cross-sectional studies of adults in the USA11,12 and China,13 as well
as with studies in children.30-33 Effect sizes
in our study were slightly lower than those reported using the US National Health and Nutrition Examination Survey11
(OR [quartile 4 vs. 1] = 1.76)and were more similar with the study in Chinese adults13 (OR [quartile 4 vs. 1] = 1.50). A
possible explanation for the weaker asso-ciations, compared to US results, may be
related to the substantially lower BPA con-centrations in our study and the Chinese study. In addition, while our results dem-onstrated increasing odds of obesity across increasing urinary BPA quartiles, some studies reported a potential thresh-old or non-monotonic effect.11,15,32 Although
non-monotonic associations have been commonly observed for BPA and other endocrine disruptors in toxicological stud-ies,34 ubiquitous low-level exposures to
BPA in human populations present a chal-lenge for assessing and interpreting dose-response relationships.35
Consistent with previous studies,11,13,14 our
study also provides evidence for positive associations between urinary BPA and continuous BMI and waist circumference measures. However, unlike studies in the USA11,12 and Asia,13,14 we did not find an
association between urinary BPA and cen-tral obesity defined using waist circumfer-ence cut-offs. Although we used the same cut-offs as the US studies, differences in racial/ethnic makeup between the popula-tions may have contributed to the discrep-ant findings.36 Furthermore, it has been
shown that urinary BPA concentration dif-fered by race/ethnicity and was signifi-cantly higher among black compared to white Americans.27 However, owing to
small sample sizes of individual ethnic groups within our study population, we could not further control for race/ethnic-ity or examine race/ethnicrace/ethnic-ity-specific associations.
Several biological mechanisms have been proposed to explain the association between BPA and obesity, although the exact mode of action remains unclear. For example, BPA has been shown to promote adipocyte differentiation and fat accumu-lation,9 as well as bind to estrogen
recep-tors on adipocytes and inhibit the release of the hormone adiponectin.37 While most
animal studies focused on in utero expo-sure, Miyawaki et al.10 showed that BPA
exposure during both perinatal and post-natal periods led to weight gain in mice. Additionally, long-term exposure to BPA in adult mice was shown to increase a dipose tissue mass and induce insulin resistance, hyperglycemia, and hypercho-lesterolemia,38 suggesting the role of BPA
in the development of obesity and cardio-metabolic dysfunction. Similarly, epidemio-logical studies provide growing evidence that, in addition to obesity, exposure to BPA may be associated with increased risk of diabetes and cardiovascular disorders.39
FIGURE 1
Mean difference in (A) body mass index and (B) waist circumference across urinary bisphenol A quartiles (vs. quartile 1) in adults 18 to 79 years
of age, overall and by sex, 2007–2011 Canadian Health Measures Survey
Abbreviations: BMI, body mass index; BPA, bisphenol A.
Notes: Quartile 1: < 0.7 µg/L; quartile 2: 0.7–1.2 µg/L; quartile 3: 1.3–2.4 µg/L; quartile 4: > 2.4 µg/L.
All models adjusted for sex (overall models only), age, urinary creatinine concentration, race/ethnicity, alcohol consumption, and junk food consumption. Models for waist circumference additionally adjusted for sugar-sweetened beverage consumption. Error bars represent 95% confidence intervals.
Mean difference in BMI (kg/m
2)
A - Body mass index
Overall Males Females
3.0 2.5 2.0 1.5 1.0 0.5 0.0 -0.5 -1.0 -1.5
Urinary BPA Quartile
Mean difference in
wa
ist circumference (cm)
B - Waist circumference
Overall Males Females
8.0
6.0
4.0
2.0
0.0
-2.0
-4.0
1 2 3 4 1 2 3 4 1 2 3 4
Urinary BPA Quartile
Like most epidemiological studies, we did not find evidence of effect modification by sex in the association between urinary BPA and obesity. Sex differences in the BPA–obesity association have been impli-cated in animal studies,16,40 possibly
relat-ing to differences in BPA metabolism41 and
estrogen receptor expression,42 as well as
sex-specific effects of BPA on dietary intake and energy expenditure.43 Given
the biological plausibility, more research is needed to delineate potential sex differ-ences in BPA-induced health outcomes.
Strengths and limitations
This is the first Canadian study to exam-ine associations between BPA and indica-tors of obesity in adults. Strengths of our study include the population-based design, large sample size, direct anthropometric measurements, high-quality urinary BPA assays, and assessment of multiple poten-tial confounders, including several dietary factors. This is important as recent sys-tematic reviews have pointed out the lack of adjustment for diet, especially pro-cessed food consumption, as a major limi-tation of studies investigating associations between BPA and health outcomes.26,35,39
This study has several limitations. First, due to the cross-sectional nature of CHMS data, temporal relationships could not be established. It is possible that obese indi-viduals store, metabolize, and/or excrete BPA differently from non-obese individu-als, leading to higher BPA levels in their
TABLE 4
Associations between log-transformed urinary bisphenol A and continuous measures of body mass index and waist circumference in adults 18 to 79 years of age, overall and by sex,
2007–2011 Canadian Health Measures Survey
Body mass index (kg/m2)a Waist circumference (cm)b
N βc 95% CI N βc 95% CI
Overall
Log BPA (continuous) 4715 0.33 0.10 to 0.57 4704 1.00 0.34 to 1.65
Males
Log BPA (continuous) 2271 0.28 –0.04 to 0.59 2267 0.72 –0.22 to 1.67
Females
Log BPA (continuous) 2444 0.38 0.73 to 2.28 2437 1.16 0.39 to 1.92
Abbreviations: BPA, bisphenol A; CI, confidence interval.
a Adjusted for sex (overall model only), age, urinary creatinine concentration, race/ethnicity, alcohol consumption, and junk
food consumption.
b Adjusted for sex (overall model only), age, urinary creatinine concentration, race/ethnicity, alcohol consumption, junk food
consumption, and sugar-sweetened beverage consumption.
c Mean change in body mass index (kg/m2) or waist circumference (cm) per natural-log unit increase in urinary BPA
concentration.
urine.44,45 Nonetheless, a recent
prospec-tive cohort study of women showed that higher urinary BPA concentration at base-line was associated with greater weight gain during a 10-year follow-up,46 although
additional longitudinal studies in both sexes are warranted. Second, single spot urine measures may not be representative of long-term exposure to BPA. Consid-erable within-person variability has been shown in urinary BPA measured through-out the day and week47 and over a period
of 1 to 3 years,48 likely relating to
varia-tions in dietary intake. However, our sen-sitivity analyses showed that time of urine collection and fasting status did not con-found the associations observed. More-over, a recent panel study collected repeated measures of urinary BPA and BMI over a 3-year period and found sig-nificant positive associations with over-weight in elderly adults regardless of whether single or average BPA measures were analyzed.15
Conclusion
In a nationally representative sample of Canadian adults, we showed that urinary BPA was positively associated with gen-eral obesity, as well as with continuous BMI and waist circumference. While the imbalance between energy intake and energy expenditure remains a major con-tributor to obesity, health and economic consequences of obesity attributable to BPA exposure should not be ignored.49
Furthermore, although BPA is not currently
prohibited in Canada, except in baby bot-tles and cosmetic products, it has been recommended to limit BPA exposure from food packaging given potential effects on health outcomes such as obesity.6 This
underscores the need to further explore the role of BPA as a potential environmen-tal obesogen. Future studies should aim to collect prospective data with repeated measures over extended time periods in order to improve exposure classification and address the temporal relationship between BPA and obesity.
Acknowledgements
The CHMS was conducted by Statistics Canada in partnership with Health Canada and PHAC with funding from the Canadian federal government. No external funding was obtained for this study.
Conflicts of interest
The authors declare no conflicts of interest.
Authors’ contributions and
statement
MTD and VCC conceptualized the study, conducted the data analyses, interpreted the data, and drafted the manuscript. MAM and MdG contributed to the inter-pretation of data, provided expertise and guidance in specific areas, and critically reviewed and revised the manuscript.
The content and views expressed in this article are those of the authors and do not necessarily reflect those of the Government of Canada.
References
1. Jia H, Lubetkin EI. Trends in qua-lity-adjusted life-years lost contri-buted by smoking and obesity. Am J Prev Med. 2010;38(2):138-44.
2. Manuel DG, Tuna M, Hennessy D, et al. Projections of preventable risks for cardiovascular disease in Canada to 2021: a microsimulation modelling approach. CMAJ Open. 2014;2(2): E94-101.
4. World Health Organization. Obesity: preventing and managing the global epidemic: report of a WHO consulta-tion. Geneva, Switzerland: World Health Organization; 2000.
5. Baillie-Hamilton PF. Chemical toxins: a hypothesis to explain the global obesity epidemic. J Altern Complement Med. 2002;8(2):185-92.
6. Health Canada. Second report on human biomonitoring of environ-mental chemicals in Canada: results of the Canadian Health Measures Survey, cycle 2 (2009–2011). Ottawa (ON): Health Canada; 2013.
7. Bushnik T, Haines D, Levallois P, Levesque J, Van Oostdam J, Viau C. Lead and bisphenol A concentrations in the Canadian population. Health Rep. 2010;21(3):7-18.
8. Calafat AM, Ye X, Wong LY, Reidy JA, Needham LL. Exposure of the U.S. population to bisphenol A and 4-ter-tiary-octylphenol: 2003–2004. Environ Health Perspect. 2008;116(1):39-44.
9. Masuno H, Iwanami J, Kidani T, Sakayama K, Honda K. Bisphenol A accelerates terminal differentiation of 3T3-L1 cells into adipocytes through the phosphatidylinositol 3-kinase pathway. Toxicol Sci. 2005;84(2): 319-27.
10. Miyawaki J, Sakayama K, Kato H, Yamamoto H, Masuno H. Perinatal and postnatal exposure to bisphenol A increases adipose tissue mass and serum cholesterol level in mice. J Atheroscler Thromb. 2007;14(5):245-52.
11. Carwile JL, Michels KB. Urinary bis-phenol A and obesity: NHANES 2003–2006. Environ Res. 2011;111(6): 825-30.
12. Shankar A, Teppala S, Sabanayagam C. Urinary bisphenol A levels and measures of obesity: results from the National Health and Nutrition Examination Survey 2003–2008. ISRN Endocrinol. 2012;2012:965243.
13. Wang T, Li M, Chen B, et al. Urinary bisphenol A (BPA) concentration asso-ciates with obesity and insulin resis-tance. J Clin Endocrinol Metab. 2012; 97(2):E223-7.
14. Ko A, Hwang MS, Park JH, Kang HS, Lee HS, Hong JH. Association between urinary bisphenol A and waist circu-mference in Korean adults. Toxicol Res. 2014;30(1):39-44.
15. Lee MR, Kim JH, Choi YH, Bae S, Park C, Hong YC. Association of bisphenol A exposure with overweight in the elderly: a panel study. Environ Sci Pollut Res Int. 2015;22(12):9370-7.
16. Caporossi L, Papaleo B. Exposure to bisphenol A and gender differences: from rodents to human evidences and hypothesis about the health effects. J Xenobiotics. 2015;5(1):5264.
17. Statistics Canada. Canadian Health Measures Survey (CHMS) data user guide: cycle 1. Ottawa (ON): Statistics Canada; 2011.
18. Statistics Canada. Canadian Health Measures Survey (CHMS) data user guide: cycle 2. Ottawa (ON): Statistics Canada; 2013.
19. Statistics Canada. Instructions for combining cycle 1 and cycle 2 Canadian Health Measures Survey (CHMS) data. Ottawa (ON): Statistics Canada; 2014.
20. Institut national de santé publique du Québec. Analytical method for the determination of bisphenol A, triclo-san, triclocarban and pesticide meta-bolites in urine by GC-MS-MS (E-454), condensed version for CHMS. Québec (QC): Laboratoire de toxicology; 2009.
21. Institut national de santé publique du Québec. Analytical method for the determination of urine creatinine on Hitachi 917 (C-530), condensed ver-sion. Québec (QC): Laboratoire de toxicologie; 2008.
22. Barr DB, Wilder LC, Caudill SP, Gonzalez AJ, Needham LL, Pirkle JL. Urinary creatinine concentrations in the U.S. population: implications for urinary biologic monitoring measure-ments. Environ Health Perspect. 2005; 113(2):192-200.
23. Canadian Society for Exercise Physiology. The Canadian Physical Activity, Fitness and Lifestyle Approach (CPAFLA), 3rd ed. Ottawa (ON): Canadian Society for Exercise Physiology; 2003.
24. Douketis JD, Paradis G, Keller H, Martineau C. Canadian guidelines for body weight classification in adults: application in clinical practice to screen for overweight and obesity and to assess disease risk. CMAJ. 2005;172(8):995-8.
25. Mendez MA, Popkin BM, Jakszyn P, et al. Adherence to a Mediterranean diet is associated with reduced 3-year incidence of obesity. J Nutr. 2006; 136(11):2934-8.
26. LaKind JS, Goodman M, Mattison DR. Bisphenol A and indicators of obesity, glucose metabolism/type 2 diabetes and cardiovascular disease: a systematic review of epidemiologic research. Crit Rev Toxicol. 2014; 44(2):121-50.
27. LaKind JS, Levesque J, Dumas P, Bryan S, Clarke J, Naiman DQ. Comparing United States and Canadian population exposures from National Biomonitoring Surveys: bis-phenol A intake as a case study. J Expo Sci Environ Epidemiol. 2012; 22(3):219-26.
28. Lang IA, Galloway TS, Scarlett A, et al. Association of urinary bisphenol A concentration with medical disorders and laboratory abnormalities in adults. JAMA. 2008;300(11):1303-10.
29. You L, Zhu X, Shrubsole MJ, et al. Renal function, bisphenol A, and alk-ylphenols: results from the National Health and Nutrition Examination Survey (NHANES 2003–2006). Environ Health Perspect. 2011;119(4):527-33.
30. Bhandari R, Xiao J, Shankar A. Urinary bisphenol A and obesity in U.S. children. Am J Epidemiol. 2013; 177(11):1263-70.
31. Eng DS, Lee JM, Gebremariam A, Meeker JD, Peterson K, Padmanabhan V. Bisphenol A and chronic disease risk factors in U.S. children. Pediatrics. 2013;132(3):E637-45.
32. Trasande L, Attina TM, Blustein J. Association between urinary bisphe-nol A concentration and obesity pre-valence in children and adolescents. JAMA. 2012;308(11):1113-21.
34. Vandenberg LN. Non-monotonic dose responses in studies of endocrine dis-rupting chemicals: bisphenol A as a case study. Dose Response. 2013; 12(2):259-76.
35. Oppeneer SJ, Robien K. Bisphenol A exposure and associations with obe-sity among adults: a critical review. Public Health Nutr. 2015;18(10): 1847-63.
36. Lear SA, James PT, Ko GT, Kumanyika S. Appropriateness of waist circumfe-rence and waist-to-hip ratio cutoffs for different ethnic groups. Eur J Clin Nutr. 2010;64(1):42-61.
37. Hugo ER, Brandebourg TD, Woo JG, Loftus J, Alexander JW, Ben-Jonathan N. Bisphenol A at environmentally relevant doses inhibits adiponectin release from human adipose tissue explants and adipocytes. Environ Health Perspect. 2008;116(12):1642-7.
38. Marmugi A, Lasserre F, Beuzelin D, et al. Adverse effects of long-term expo-sure to bisphenol A during adulthood leading to hyperglycaemia and hyper-cholesterolemia in mice. Toxicology. 2014;325:133-43.
39. Rancière F, Lyons JG, Loh VH, et al. Bisphenol A and the risk of cardiome-tabolic disorders: a systematic review with meta-analysis of the epidemiolo-gical evidence. Environ Health. 2015;14:46.
40. vom Saal FS, Nagel SC, Coe BL, Angle BM, Taylor JA. The estrogenic endo-crine disrupting chemical bisphenol A (BPA) and obesity. Mol Cell Endocrinol. 2012;354(1-2):74-84.
41. Takeuchi T, Tsutsumi O, Nakamura N, et al. Gender difference in serum bisphenol A levels may be caused by liver UDP-glucuronosyltransferase activity in rats. Biochem Biophys Res Commun. 2004;325(2):549-54.
42. Davis KE, Neinast MD, Sun K, et al. The sexually dimorphic role of adi-pose and adipocyte estrogen recep-tors in modulating adipose tissue expansion, inflammation, and fibro-sis. Mol Metab. 2013;2(3):227-42.
43. Mackay H, Patterson ZR, Khazall R, Patel S, Tsirlin D, Abizaid A. Organizational effects of perinatal exposure to bisphenol-A and diethyls-tilbestrol on arcuate nucleus circuitry controlling food intake and energy expenditure in male and female CD-1 mice. Endocrinology. 2013;154(4): 1465-75.
44. Hays SM, Aylward LL, Blount BC. Variation in urinary flow rates accor-ding to demographic characteristics and body mass index in NHANES: potential confounding of associations between health outcomes and urinary biomarker concentrations. Environ Health Perspect. 2015;123(4):293-300.
45. Geens T, Neels H, Covaci A. Distribution of bisphenol-A, triclosan and n-nonylphenol in human adipose tissue, liver and brain. Chemosphere. 2013;87(7):796-802.
46. Song Y, Hauser R, Hu FB, Franke AA, Liu S, Sun Q. Urinary concentrations of bisphenol A and phthalate metabo-lites and weight change: a prospec-tive investigation in US women. Int J Obes (Lond). 2014;38(12):1532-7.
47. Ye X, Wong LY, Bishop AM, Calafat AM. Variability of urinary concentra-tions of bisphenol A in spot samples, first morning voids, and 24-hour col-lections. Environ Health Perspect. 2011;119(7):983-8.
48. Townsend MK, Franke AA, Li X, Hu FB, Eliassen AH. Within-person reproducibility of urinary bisphenol A and phthalate metabolites over a 1 to 3 year period among women in the Nurses’ Health Studies: a prospective cohort study. Environ Health. 2013; 12(1):80.