THE COMMUNITY ECOLOGY OF PLANT PARASITES: FROM COINFECTIONS TO METACOMMUNITIES
Fletcher William Halliday
A dissertation submitted to the faculty at the University of North Carolina at Chapel Hill in partial fulfillment of the requirements for the degree of Doctor of Philosophy in the Department
of Biology.
Chapel Hill 2017
Approved by: Charles Mitchell
Allen Hurlbert James Umbanhowar
© 2017
ABSTRACT
FLETCHER WILLIAM HALLIDAY: The Community Ecology of Plant Parasites: from Coinfections to Metacommunities
(Under the direction of Charles E. Mitchell)
New emerging diseases and methodological advances have generated a recent surge in
disease ecology research and renewed interest in identifying the ecological processes that structure parasite communities. Yet ecologists still lack a general framework for understanding the drivers of parasite diversity. Metacommunity theory is a general ecological framework that
has been used to understand patterns of community composition in many ecological systems. This dissertation leverages one key insight from metacommunity theory – that multiple processes
operate across different spatial and temporal scales to control the composition of local
communities – to understand parasite communities within hosts. In this work, I used experimental studies to examine the community ecology of parasites that infect wild host plants over space and
time.
At the smallest spatial scale, I explored how interactions among parasites in the same host
leaf during coinfection alter parasite epidemics. Within host leaves, parasite growth was influenced by coinfections, but coinfections were often prevented by the sequence of parasite infection, generating priority effects within hosts. Coinfections, priority effects, and the severity
At the largest spatial scale, I explored how characteristics of host communities influence
the diversity of parasite metacommunities. Parasite diversity across host communities depended on host diversity and resource supply to hosts. Host richness alone could not explain most
changes in parasite diversity. However, shifting host composition allowed disease amplification, depending on parasite transmission mode. These effects also varied over time: the structure of host communities changed in response to initial host diversity and resource supply to hosts,
leading to altered parasite richness and abundance. Together, these results highlight the utility of multiscale approaches to disease ecology. Specifically, integrating concepts from community
ACKNOWLEDGEMENTS
The completion of this dissertation was only achieved thanks to many collaborators, friends, and family members. First, I wish to thank my committee members, for challenging me
to think more critically about my research questions, design, and implementation. Rytas Vilgalys helped me find traction in an unexplored study system. Allen Hurlbert and James Umbanhowar provided statistical and theoretical advice. James rarely missed an opportunity to challenge an
assumption, question a relationship, or suggest and alternative approach, and this research is better for it. Peter White’s inquisitiveness and insight is infectious, and Peter’s unanswerable
questions about generality in ecology guided my research approach during graduate school. Charles Mitchell is the type specimen of a great mentor, giving me space and resources to pursue countless projects early on when time wasted was time well spent; motivating me to finally
analyze my results and advising me on how to write them up when it was time to finish; and patiently listening when I talked and talked and talked for what must have seemed like and
endless and unrelenting amount of time. Most importantly, Charles has been my advocate during this particularly vulnerable time in my career.
I would like to acknowledge my funding sources. Much of my research was funded by
the NSF-USDA joint program in Ecology and Evolution of Infectious Diseases (NSF grant DEB-1015909 and USDA-NIFA AFRI grant 2016-67013-25762). The NSF Graduate Research
summer funding which allowed me to perform full-time field work each summer after the GRFP
expired. UNC’s Mrs. Coker Fellowship provided me a stipend for the Fall 2010 and Fall 2011 semesters. UNC’s WC Coker Fellowship provided summer funding and a stipend for the Fall
2017 semester. UNC’s Graduate School Dissertation Completion Fellowship provided a stipend for Fall 2015 and Spring 2016. During my remaining time at UNC, the Department of Biology provided TA-ships to support me.
I have benefitted tremendously from my labmates. Rob Heckman, Megan Rúa, Miranda Welsh, and Kayleigh O’Keeffe provided sage advice and critical feedback. They improved my
writing, stopped me from pursuing many half-baked research ideas, prevented mid-season fieldwork meltdowns, and generally improved my outlook on science. Bradley Saul changed the
way I think about causation in research. I owe James Cronin for much of my early intellectual development during graduate school. I am thoroughly convinced that without his guidance, I would not have received the graduate research fellowship that opened so many doors for me.
Erin Mordecai was a role model, demonstrating how to balance a productive work life with a fulfilling personal one.
Peter Wilfahrt and Rob Heckman are wonderful collaborators and even better friends. We
began a collaborative experiment on a whim, and through their tutelage and hard work, this project ultimately formed two chapters in this dissertation, and the backbone of my academic career.
During my time in graduate school, I have benefitted from coffee, and conversations, hikes, writing workshops, arguments, and board games with Peter, Rob, Erin, Bianca Lopez,
There are no words to describe how valuable these friendships have been to me. I’ve particularly
benefitted from knowing Andrew Loyd, who taught me everything that I know about plant pathology, gardening, and brewing.
My research benefitted from assistance and discussions with many undergraduate students, particularly Briana Whitaker, Markus Le, Kristina Jacobs, Robert Price, Ben Robb,
Anita Simha, Prahlada Papper, and a group of 15 students from Santa Rosa Junior College, who designed and implemented a novel study on an emerging pathogen.
I want to thank my family. Louise Abrahams, Ashley Halliday and Ann Halliday provided roofs over my head and warm dinners during months of field work that ultimately did
not make it into this dissertation. Ashley was also a tireless field assistant during a time when I would have otherwise been completely alone. Hugo, Stanley, and Penelope were helpful
distractions when I needed them most. Thank you to Ivo, who was born just as this document came together. I am so grateful for the countless sleepless nights spent worrying about you rather than that damned final dissertation chapter.
Finally, I want to thank my spouse Simone. In 2010, we tied the knot and promptly moved across the country to a strange place with few personal connections. It has turned out to
be the greatest adventure of my life, and I could not have done it without your guidance and understanding as my partner. Graduate school was an opportunity to find my personal and
too much? Simone facilitated my exploration of these limits, but also served as an anchor,
TABLE OF CONTENTS
LIST OF TABLES ... xiv
LIST OF FIGURES ... xvi
CHAPTER 1 : INTRODUCTION ... 1
CHAPTER 2 : INTERACTIONS AMONG SYMBIONTS OPERATE ACROSS SCALES TO INFLUENCE PARASITE EPIDEMICS ... 7
Introduction ... 7
Within-host interactions that determine parasite growth rates ... 8
Within-host priority effects ... 9
Parasite phenology may alter within-host interactions and epidemics ... 10
Methods ... 11
Study system ... 11
Experimental Design ... 12
Survey ... 14
Data analysis ... 15
Results ... 17
Does parasite phenology alter epidemics? ... 17
growth rates? ... 19
Discussion ... 21
Conclusions ... 24
CHAPTER 3 : HOST IMMUNITY MODIFIES INTERACTIONS AMONG PARASITES AND ALTERS PARASITE EPIDEMICS ... 32
Introduction ... 32
Methods ... 35
Experimental design ... 37
Survey ... 38
Disease metrics ... 39
Data analysis ... 39
Results ... 42
Does host immunity alter within-host priority effects? ... 42
Do immune-mediated priority effects alter parasite prevalence? ... 43
Does host immunity alter within-host parasite growth? ... 43
What are the consequences for immune-mediated parasite interactions on parasite epidemics? ... 44
Discussion ... 45
CHAPTER 4 : A MULTIVARIATE TEST OF DISEASE RISK REVEALS CONDITIONS LEADING TO DISEASE AMPLIFICATION ... 52
Host composition and species richness ... 57
Resource supply treatment ... 59
Quantification of host abundance, parasite abundance and parasite richness ... 59
Data analysis ... 61
Results ... 63
Discussion ... 66
CHAPTER 5 : ASSEMBLY OF THE HOST COMMUNITY INFLUENCES PARASITE RICHNESS AND ABUNDANCE IN A PLANT DIVERSITY EXPERIMENT ... 74
Introduction ... 74
Changes in host species richness during community assembly ... 75
Changes in exotic host abundance during community assembly ... 76
Changes in host phylogenetic diversity during community assembly ... 77
Methods ... 78
Host composition and species richness ... 79
Resource supply treatment ... 80
Quantification of host community assembly ... 80
Quantification of parasite abundance and parasite richness ... 81
Data analysis ... 83
Results ... 85
APPENDIX A: SUPPLEMENTARY MATERIAL FOR CHAPTER 2. ... 100
A1. Surveys to determine parasite order of arrival into the host population ... 100
A2. Details of planting treatments and leaf surveys ... 101
A3. Details of data analysis ... 102
A4. Supplemental Figures ... 106
A5. Supplemental tables ... 108
APPENDIX B: SUPPLEMENTARY MATERIAL FOR CHAPTER 3. ... 114
B1. Supplemental tables ... 114
APPENDIX C: SUPPLEMENTARY MATERIAL FOR CHAPTER 4. ... 117
C1. Supplemental tables ... 117
APPENDIX D: SUPPLEMENTARY MATERIAL FOR CHAPTER 5. ... 123
D1. Supplemental tables ... 123
D2. Supplemental figures ... 128
LIST OF TABLES
Table 2.1 – Biology and ecology of the focal symbionts ... 26
Table 5.1– Test of mediation for the final (reduced) model. Fully mediated model includes paths from experimental treatments to mediators only. Partially mediated models include paths from experimental treatments to mediators and responses. ... 92
Table A2.1 – Cohort 1 survival analysis ANOVA ...108
Table A2.2 – Cohort 2 survival analysis ANOVA ... 109
Table A2.3 – Cohort 3 survival analysis ANOVA ... 109
Table A2.4 – Reduced model coefficients. Models were reduced from a full model using likelihood ratio tests to remove non-significant interactions. Estimates are only provided if they were included in the reduced model. Significant effects (p<0.05) from those likelihood ratio tests are indicated in bold. Coefficients are exponentiated. ... 110
Table A2.5 – Cohort 1 longitudinal linear mixed model ANOVA ... 111
Table A2.6 – Cohort 2 longitudinal linear mixed model ANOVA ... 112
Table A2.7 – Cohort 3 longitudinal linear mixed model ANOVA ... 112
Table A2.8 – Reduced model coefficients. Models were reduced from a full model using likelihood ratio tests to remove non-significant interactions. Estimates are only provided if they were included in the reduced model. Significant effects (p<0.05) from those likelihood ratio tests are indicated in bold. Coefficients are on a log scale. ... 113
Table B3.1 – Reduced model coefficients. Models were reduced from a full model using likelihood ratio tests to remove non-significant interactions. Estimates are only provided if they were included in the reduced model. Coefficients are exponentiated for Cox mixed models and on a log scale for longitudinal mixed models ... 114
Table B3.2 – Disease risk [Cox mixed model] ANOVA ... 115
Table B3.3 – Parasite Prevalence ANOVA ... 115
Table B3.4 – Infection severity [longitudinal linear mixed model] ANOVA ... 116
Table B3.6 – Parasite Burden ANOVA ... 116 Table C4.1 – ANOVA for parasite abundance and parasite richness
models. A) Parasite abundance, B) Rarefied parasite richness. ... 117 Table C4.2 – ANOVA for multi-response regression models.
“Response” is the multivariate response of insect and microbial
parasite abundance and richness ... 118 Table C4.3 – Estimated model terms for the transformed responses insect
abundance, insect richness, microbial abundance, and microbial richness. (a) fixed coefficients (averaged over block), (b) the
variance covariance matrix (left) and correlations (right) ... 119 Table C4.4 – Parasite morphospecies (symptoms in brackets) and associated hosts ... 120 Table D5.1 – Parasite morphospecies and their associated host species
grouped into four categories: A) planted host species, B) native colonizing host species, C) exotic colonizing host species, and D) host species with unknown geographic provenance. Parasite morphospecies is presented in the leftmost column, with parasite
type in brackets and genbank accession numbers in parentheses. ... 124 Table D5.2 – Piecewise SEM goodness of fit Test. A) Conditional
independence claims for a direct separation test using the full model. B) Results of the direct separation test (p<0.05 indicates
that the model should be rejected) ... 125 Table D5.3 – Coefficient estimates from the full model. Estimates are
standardized to a common scale to facilitate comparisons.
Correlations among dependent variables are indicated by ~~. ... 126 Table D5.4 – Coefficient estimates from the final (reduced) model.
Estimates are standardized to a common scale to facilitate
comparisons. Significant predictors (p<0.05) are indicated in bold.
LIST OF FIGURES
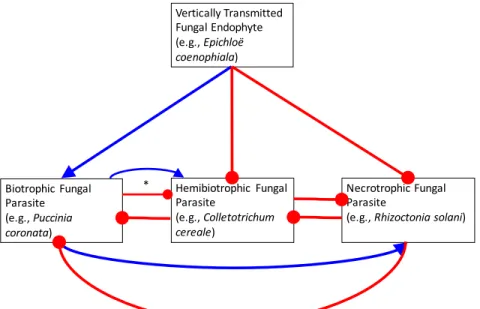
Figure 2.1 - Hypothetical interaction network between a vertically transmitted fungal endophyte and subsequently colonizing fungal parasites. Blue arrows represent positive interactions (e.g., facilitation). Red clubs represent negative interactions
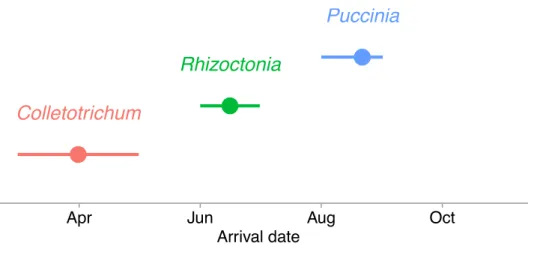
(e.g., inhibition). ... 27 Figure 2.2 - Parasite sequence of arrival into the host population during
2013 – 2015 surveys. Points represent the average first date that at least 1% of host leaves in 2013 and 2014 and 1% of plots in 2015 were infected by each parasite. Error bars represent the earliest and latest
date of first infection across the surveys. ... 28 Figure 2.3 - Seasonal epidemics in three experimental cohorts of hosts.
Points represent parasite prevalence (the proportion of leaves infected across all sentinel hosts) in each survey. Illustrative lines are LOESS fit to the data with span=0.9. Vertical lines represent the dates that each cohort was placed into the field, highlighting
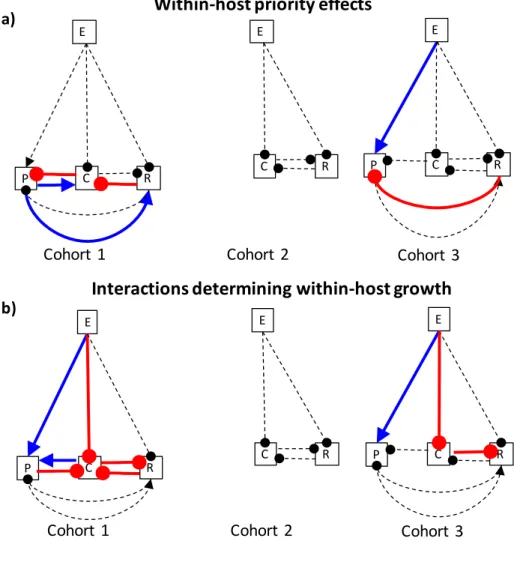
the overlap in time among cohorts. ... 29 Figure 2.4 – Summary of symbiont interaction network indicated by the
interaction models. Blue arrows represent positive interactions (e.g., facilitation). Red clubs represent negative interactions (e.g., inhibition). Dashed lines represent hypothesized interactions that were not supported by the models (p>0.05). “E” stands for Epichloë coenophiala, “P” stands for Puccinia coronata, “C” stands for Colletotrichum cereale, “R” stands for Rhizoctonia solani.
a) Within-host priority effects from Cox-proportional hazards models. b) Interactions influencing within-host growth from longitudinal
linear mixed models. ... 30 Figure 2.5 – Model-estimated relative risk of infection as leaves age.
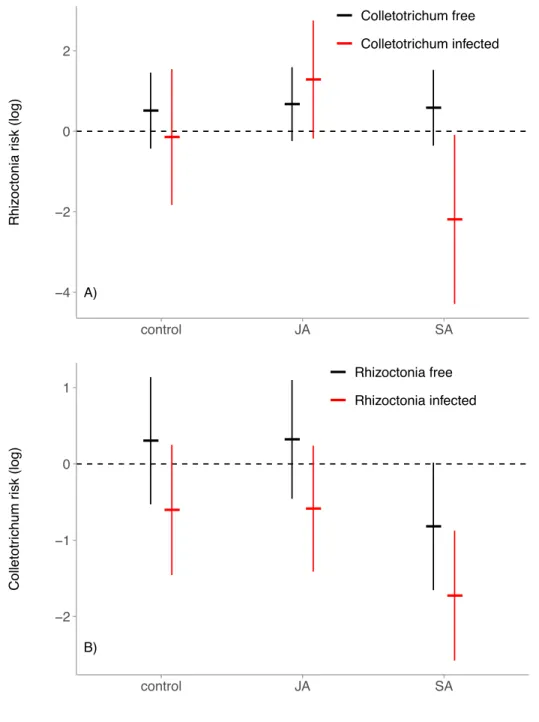
Figure 3.1 – Model-estimated relative risk of infection. Plots are results of the reduced Cox mixed models, and are on a logarithmic scale. Points represent the treatment mean and error bars represent the 95% confidence interval. A value above zero indicates that the experimental treatment, or previous infection of a leaf by the other parasite (red) increased the risk of subsequent infection by the focal parasite. A value below zero indicates that the treatment or previous infection decreased the risk of subsequent infection by the focal parasite. a) Rhizoctonia infection risk. b) Colletotrichum
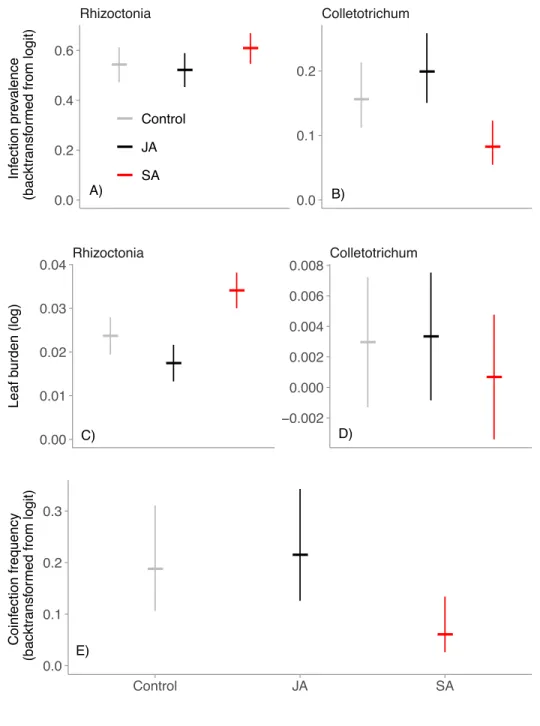
infection risk. ... 49 Figure 3.2– Model-estimated effects of experimental treatments (grey =
control, black = JA, red = SA) on epidemics of Colletotrichum and Rhizoctonia. Points represent the treatment mean and error bars represent the 95% confidence interval. a) Rhizoctonia infection prevalence, calculated as the proportion of leaves across the entire plant that were infected by each parasite. b) Colletotrichum infection prevalence. c) Rhizoctonia leaf burden, calculated as the area under the disease progress stairs for each parasite. d) Colletotrichum leaf burden. e) Coinfection frequency, calculated as the proportion of longitudinally surveyed leaves that became coinfected during the
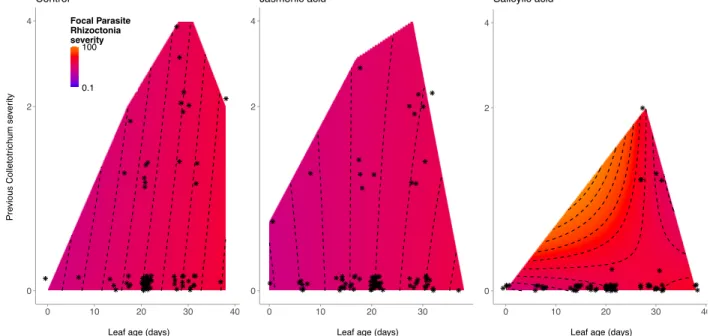
course of the experiment. ... 50 Figure 3.3 – Model-estimated within-host parasite growth. Plots are results
of the reduced longitudinal mixed models, showing the rate at which log-transformed infection severity by Rhizoctonia increased as leaves age (i.e., parasite growth rate), and the effects of previous Colletotrichum infection on that relationship. Colors and contour lines represent mode-estimated Rhizoctonia infection severity. Points represent individual observations of leaves over the course
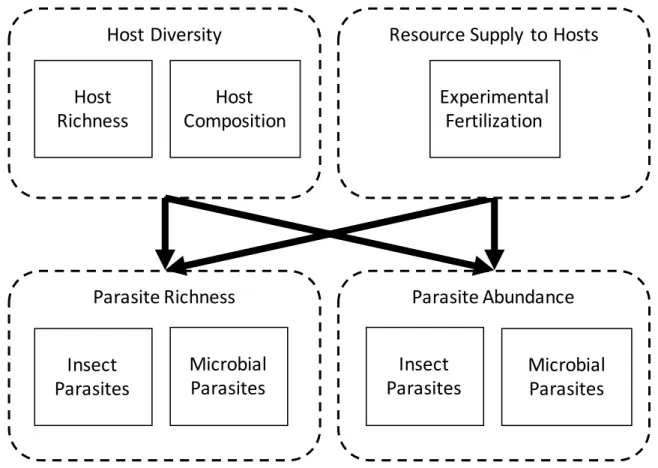
of the experiment. ... 51 Figure 4.1 – Relationships among host diversity, resource supply to hosts,
parasite richness, and parasite abundance can be decomposed into their component parts. Host diversity effects can be decomposed into those that are driven by variation in host composition and those driven by variation in host species richness. Parasite richness and abundance can be decomposed into characteristics of parasite
species, such as parasite taxonomic groups (here, insects vs microbes). ... 71 Figure 4.2– Effects of host diversity (monoculture, polyculture) and
resource supply to hosts (ambient, black circles; fertilized, red triangles) on parasite abundance, back-transformed from the inverse hyperbolic sine (top, panels A and B), and rarefied parasite
richness. The right panels (B and D) show the effects of host
diversity after accounting for variation in host composition. ... 72 Figure 4.3 - Effects of host diversity (mono = monoculture; poly =
polyculture) and resource supply to hosts (ambient, black circles; fertilized, red triangles) on insect and microbial parasite abundance and richness, calculated using a multi-response regression with standardized response variables. The panels show the effects of host diversity on insect and microbial parasite abundance and richness before (top) and after (bottom) accounting for host composition. For example, the leftmost four points (top panel) show positive effects of host diversity (i.e., amplification effect) and negative effects of soil fertilization on insect abundance; the amplification effect becomes non-significant after accounting for composition (bottom panel). Estimates are from a reduced model omitting the non-significant interaction between host diversity and resource supply. Error bars represent 95% confidence intervals. Coefficients that share a letter do not differ significantly as determined
by the Bonferroni correction, α* = 0.05/4 = 0.0125. ... 73 Figure 5.1 – Hypothesized effects of host diversity and resource supply on
parasite richness and abundance, mediated by future host community structure (i.e. community assembly). Straight arrows represent causal relationships, and curved arrows represent correlations. A) Conceptual metamodel. B) Statistical measurement (full) model: Residuals are denoted by ε for response variables and ζ for mediating variables. Each dependent variable may be altered by the experimental covariate of block, modeled as a linear combination of coefficients, where the number of coefficients equals the number of levels minus 1. These block effects are depicted with four
covariates (BLK 2 – BLK 5) and brackets around the dependent
variables. Paths are labeled a-o for reference in the text. ... 93 Figure 5.2 – Piecewise structural equation model results for the final
(reduced) model. Dashed lines are non-significant (p> 0.05). All coefficients are standardized. Correlations between errors are denoted with double-headed arrows. R2 is the marginal R2 from the linear mixed-model, which represents the variance explained
by fixed effects in the model. *p = 0.056 ... 94 Figure 5.3 – Bivariate relationships among modelled parameters represented
in the model (e.g., the left panel in (d) shows the effect of plant species richness on parasite richness after accounting for the effects of exotic abundance and plant phylogenetic diversity on parasite
richness). Regression lines are drawn for significant relationships only. ... 95 Figure A2.1 – Cohort 1 within-host parasite growth. Plots are results of
the reduced longitudinal mixed models, showing the rate at which log-transformed infection severity among infected leaves increased as leaves age (i.e., parasite growth rate), and the effects of other symbionts on that relationship. a-c) Colletotrichum infection severity as a function of previous Puccinia infection severity, previous
Rhizoctonia infection severity, and endophyte infection, respectively. Colors and contour lines represent model-estimated Colletotrichum infection severity. d-e) Puccinia infection severity as a function of previous Colletotrichum infection severity and endophyte infection, respectively. f) Rhizoctonia infection infection severity as a function of previous Colletotrichum infection severity. Points represent individual observations of leaves over the course of the experiment. “Neg effects” are the number of leaves where the model estimated a negative effect of the other parasite on the focal parasite. “Pos effects” are the number of leaves where the model estimated a positive effect. “Mean effect” is the model-estimated per-capita effect of the other parasite on the focal parasite. * denotes estimated effects for models where there was no interaction between leaf age and previous infection severity by the other parasite. † denotes estimated effects for models where the main effect was non-
significant. These model results are summarized in Figure 2.4b. ... 106 Figure A2.2 – Cohort 3 within-host parasite growth. Plots are results of
the reduced longitudinal mixed models, showing the rate at which log-transformed infection severity among infected leaves increased as leaves age (i.e., parasite growth rate), and the effects of other symbionts on that relationship. a) Colletotrichum infection severity as a function of endophyte infection. b) Puccinia infection severity as a function of endophyte infection. c) Rhizoctonia infection severity as a function of previous Colletotrichum infection severity. †
denotes estimated effects for models where the main effect was
non-significant. These model results are summarized in Figure 2.4b. ... 107 Figure C4.1 – Effects of host diversity (mono = monoculture plots;
composition. Coefficients that share a letter do not differ significantly as determined by multiple comparisons tests with the Bonferroni correction, α* = 0.05/4 = 0.0125. Estimates are from the full model that includes a non-significant interaction
between host diversity and soil fertility. ... 121 Figure C4.2 – Effects of host diversity (monoculture plots; polyculture
plots) and resource supply to hosts (ambient, black; fertilized, red) on the abundance of each parasite morphospecies, standardized to a common variable. Violins show distribution of the data. Asterisks
show the mean of each group. ... 122 Figure D5.1 – The final (reduced) model with parasite richness rarefied
to two host individuals per plot. A subsample of two host individuals represents the minimum number of host individuals sampled per plot. Dashed lines are non-significant (p<alpha = 0.05). All coefficients are standardized. Correlations between errors are denoted with double-headed arrows. R2 is the marginal R2 from
the linear mixed-model. ... 128 Figure D5.2 – The final (reduced) model with parasite richness rarefied
to five host individuals per plot. A subsample of five host individuals represents the median number of host individuals sampled per plot. Dashed lines are non-significant (p<alpha = 0.05). All coefficients are standardized. Correlations between errors are denoted with double-headed arrows. R2 is the marginal R2 from the linear
mixed-model. ... 129 Figure D5.3 – Piecewise structural equation model results for the full
model. Dashed lines are non-significant (p> 0.05). All coefficients are standardized. Correlations between errors are denoted with
CHAPTER 1: INTRODUCTION
The diversity of parasites – organisms that live in and on hosts, potentially causing disease
– may rival the diversity of all other organisms on earth (Dobson et al. 2008). Yet, until recently, parasite diversity comprised an undervalued component of global biodiversity. In natural systems, parasite diversity can influence disease risk and host community structure (Hersh et al. 2012,
Johnson et al. 2013a). Understanding the drivers of parasite diversity may be important for
predicting the emergence and spread of infectious diseases, an increasingly urgent need due to the
emergence of diseases that pose threats to human, wildlife, and ecosystem health (Daszak et al. 2000, Hatcher et al. 2012, Boyd et al. 2013). However, despite the importance of parasites, ecologists still lack a general framework for understanding the drivers of parasite diversity.
Metacommunity theory is a general framework for understanding the processes that shape ecological communities including those of parasites (Mihaljevic 2012, Richgels et al. 2013,
Dallas and Presley 2014). One key insight from metacommunity theory is the observation that multiple processes operate simultaneously across spatial and temporal scales to control the composition of local communities (Leibold et al. 2004, Holyoak et al. 2005, Logue et al. 2011).
This dissertation applies this insight from metacommunity theory to advance a more general understanding of the processes structuring parasite communities in nature.
influenced by “regional processes”, which occur across larger spatial and temporal gradients.
Furthermore, regional processes can influence the richness and abundance of species available to colonize the local scale, thereby defining the subset of interactions that can occur in a given
place and time (Fukami 2015). Because of the intimate association between parasites and a single individual host, local processes are likely to operate within host individuals while regional processes should operate across hosts (Kuris et al. 1980, Dove and Cribb 2006, Bordes and
Morand 2008, 2009, Borer et al. 2016).
To explore this concept from metacommunity theory, the research presented in this
dissertation utilizes a model system: fungal parasites that infect wild plant leaves. This research spans spatial scales, from individual coinfections within host leaves to entire parasite
metacommunities across communities of hosts, to identify the processes that influence parasite
diversity. At the smallest scale, I consider a plant leaf to represent a local habitat patch for parasites (follwing Tollenaere et al. 2015). At this scale, interactions occur among parasites as
they compete for resources within host plants or alter host immune responses. Just as multiple habitat patches scale up to form metapopulations and metacommunities, so, too, do habitat patches within hosts, scaling up from host leaves to host individuals to host populations and
communities (Borer et al. 2016). At the scale of a host community, characteristics of the host community that determine the movement or spread of parasites, such as the density of
susceptible hosts or host competence, may alter parasite diversity (Seabloom et al. 2015). Host communities also change over time in a process known as community assembly
(HilleRisLambers et al. 2011), and these changes over time during host community assembly
Using these insights from metacommunity theory, this dissertation addresses two broad
questions: 1) How do interactions among parasites and other microorganisms influence parasite epidemics across scales? 2) How do characteristics of host communities, which change over
time during host community assembly, interact with characteristics of individual parasite species to alter the richness and abundance of entire parasite metacommunities? The results of this work show that interactions among parasites at the scale of host leaves can alter parasite epidemics
across hosts, but these interactions are dependent on characteristics of an individual host’s immune system as well as parasite phenology across hosts. At the scale of host communities,
host composition can interact with characteristics of individual parasites to alter parasite diversity, but this effect changes over time as host communities assemble. These results
highlight the dynamic and often complex pathways that connect host and parasite communities
across space and time.
CHAPTER SUMMARIES
In Chapter 2, I explore how interactions among symbionts (i.e., any organism that spends at least one life history stage living in or on a single host individual, including, but not limited to
parasites) influence parasite epidemics across scales. Parasite epidemics may be influenced by interactions among symbionts, which can depend on past events at multiple spatial scales. Within
host individuals, interactions can depend on the sequence in which symbionts infect a host, generating priority effects. Across host individuals, interactions can depend on parasite
phenology. To test the roles of parasite interactions and phenology in epidemics, I performed a
symbiont, into a wild host population, and tracked foliar infections caused by three common
fungal parasites. Within hosts, parasite growth was influenced by coinfections, but coinfections were often prevented by priority effects among symbionts. Across hosts, parasite phenology
altered host susceptibility to secondary infections, symbiont interactions, and ultimately the magnitude of parasite epidemics. Together, these results indicate that parasite phenology can influence parasite epidemics by altering the sequence of infection and interactions among
symbionts within host individuals.
In Chapter 3, I tested whether coinfections, priority effects, and the severity of infections
were altered by host immunity. Parasite epidemics can be influenced by interactions among parasites. These interactions may result from the host immune response to prior infection, resulting in priority effects. I hypothesized that immune-mediated interactions and priority
effects would depend on parasite feeding strategies. To test the role of host immunity on parasite interactions and epidemics, I applied plant immune-signaling hormones to sentinel plants,
embedded into a wild host population, and tracked foliar infections caused by two common fungal parasites. Within hosts, parasite growth and priority effects were influenced by the immune-signaling hormone, Salicylic Acid (SA). Hosts treated with SA experienced fewer
coinfections, lower prevalence of an endemic parasite, and increased severity of infection by an epidemic parasite. Together, these results indicate that host immunity can alter within-host
priority effects and within-host parasite growth among infected hosts, resulting in shifts in parasite prevalence, the frequency of coinfection, and the severity of disease experienced by hosts.
In Chapter 4, I explore how characteristics of host communities interact with
metacommunities (i.e., disease risk). Theory predicts that increasing biodiversity will dilute the
risk of infectious diseases under certain conditions and will amplify disease risk under others. Yet, few empirical studies demonstrate amplification. This contrast may occur because few studies have
considered the multivariate nature of disease risk, which includes richness and abundance of parasites with different transmission modes. To address this question, I designed a field experiment in collaboration with Rob Heckman, Peter Wilfahrt, and Charles Mitchell that manipulated host
(plant) richness, composition, and resource supply to hosts. Using a multivariate statistical model developed for biodiversity-ecosystem-multifunctionality, I revealed that (1) host richness alone
could not explain most changes in disease risk, and (2) shifting host composition allowed disease amplification, depending on parasite transmission mode. Overall, this study demonstrates that multiple drivers, related to both host community and parasite characteristics, can influence disease
risk. Further, it provides a framework for evaluating multivariate disease risk in other systems. In Chapter 5, I used the same multi-factorial field experiment as in Chapter 4 to test
whether the effects of host diversity and resource supply to hosts on parasite richness and
abundance change over time as host communities assemble. Increased host diversity is commonly associated with a reduction in disease risk. However increased host diversity is also commonly
associated with shifts in host species composition and host phylogenetic diversity. Many empirical studies show that these characteristics of host communities that are correlated with host diversity
may actually drive the relationship between host diversity and disease risk. The association
between these characteristics and host diversity, and their influence on disease risk may result from host community assembly over time. To test this, we planted herbaceous perennial communities at
measured post-assembly host composition, and host species richness, and quantified post-assembly
disease risk by measuring parasite richness and parasite abundance. We hypothesized that initial host richness and resource supply to hosts would alter parasite richness and abundance by altering
post-assembly host richness, the abundance of exotic host species, and the phylogenetic diversity of the host community. Consistent with our hypothesis, the effects of initial host richness and resource supply to hosts depended on subsequent changes in these three measures of host richness
and composition. These results support the growing body of evidence that parasite abundance is most strongly influenced by host composition and phylogenetic diversity. In contrast to previous
studies, these results highlight a causal relationship between host richness and parasite abundance, despite the strong association between host composition and parasite abundance. Consequently, these results provide a new mechanism by which host richness may alter disease: host richness
influenced host compositional changes, which subsequently altered disease. Together, these results provide insight into the multiple pathways that connect host and parasite communities during host
CHAPTER 2: INTERACTIONS AMONG SYMBIONTS OPERATE ACROSS SCALES TO INFLUENCE PARASITE EPIDEMICS
Introduction
The diversity of parasites and pathogens (hereafter, “parasites”) can influence parasite epidemics (Dobson et al. 2008, Hersh et al. 2012, Johnson et al. 2013b). More generally,
epidemics may be driven by interactions among diverse parasites and other symbionts that share a host (Rynkiewicz et al. 2015, Susi et al. 2015, Busby et al. 2016). Many field-based studies of symbiont interactions employ a largely “deterministic” framework (following Fukami 2015), in
which the strength and direction of these interactions are assumed to be fixed (Fenton et al. 2014). However, interactions among symbionts may also be contingent on past events. Within
hosts, priority effects occur when interactions are contingent on the sequence in which symbiont species infect an individual host (e.g., Kennedy et al. 2009; Hoverman et al. 2013; Adame-Avarez et al. 2014). Across hosts, symbiont species often differ in their phenology, thus
emerging or arriving into a host population sequentially (Schmidt et al. 2007, Dumbrell et al. 2011, Mundt and Sackett 2012). Yet the influence of parasite phenology on parasite interactions
Within-host interactions that determine parasite growth rates
A symbiont is any organism that spends at least one life history stage living in or on a single host individual; symbionts span the continuum from parasites, which reduce host fitness,
to mutualists, which increase host fitness (Starr 1975). Understanding how interactions among symbionts within hosts influence parasite epidemics is an important frontier in disease ecology (Rynkiewicz et al. 2015, Seabloom et al. 2015, Tollenaere et al. 2015). Coinfecting symbionts
may interact by competing for limiting resources in the host or via their impacts on host physiology, including host immune responses (Lello et al. 2004, Tollenaere et al. 2015). These
interactions, which can generate mixtures of inhibition and facilitation among coinfecting symbionts, can alter symbiont population dynamics in both plants and animals (Eswarappa et al. 2012, Tollenaere et al. 2015). However, whereas symbiont interactions can be readily measured
in the lab (Graham 2008), measuring symbiont interactions in the field is more challenging (Fenton et al. 2010, 2014, Zhan and McDonald 2013). Although many analytical approaches
have been proposed, model validation using theoretical (Fenton et al. 2010) and field-collected data (Fenton et al. 2014) indicates that longitudinal mixed-models of within-host parasite growth provide the most reliable measurement of symbiont interactions during natural epidemics.
While these models can reliably measure interactions within hosts (Hellard et al. 2015), they implicitly assume that the strength and direction of pairwise interactions among coinfecting
symbionts is the same regardless of the historical context in which they occur (i.e.,
“deterministic” following Fukami 2015). This assumption is true for some parasites (e.g., Sousa 1993), but interactions among coinfecting symbionts may also be contingent on the sequence of
different past events, these models may fail to identify important interactions if the strength and
direction of those interactions depend on the past events each host experienced. Longitudinal mixed-models may also miss important interactions when prior infection prevents coinfections
altogether via induced resistance or other mechanisms of interference (Rohani et al. 2003, Leventhal et al. 2015).
Within-host priority effects
Within hosts, interactions among symbionts may result from priority effects, in which the per-capita strength of inhibition or facilitation among symbionts is altered by their sequence of
arrival (Hoverman et al. 2013, Werner and Kiers 2015, Mordecai et al. 2016). Among free-living species, priority effects are common and their impacts are well-established (Fukami 2015), and
within-host priority effects may be similarly common among symbionts. Vannete & Fukami (2014) posited that priority effects are most likely to occur when species exhibit high niche overlap. This occurs when species require similar resources, share natural enemies, or for
symbionts, respond to similar host immune processes. Additionally, priority effects should be more common when the early arriving species have large impacts on that niche and when the late
arriving species are highly sensitive to the availability of that niche (Vannette and Fukami 2014). These requirements may be commonly fulfilled for symbionts sharing a host. Because all symbionts require host resources for survival, growth, and reproduction (Stearns 1992, Roff
1993), they may exhibit some niche overlap and high sensitivity to the availability of that niche when they coinfect the same host individual. The resulting interactions among coinfecting
arriving symbionts by impacting host fitness (Randall et al. 2013) or altering host immunity
(Lello et al. 2004, Graham 2008, Cobey and Lipsitch 2013). Impacts on host fitness and immunity may be related to the symbiont’s feeding strategy (Newton et al. 2010). Thus,
symbiont feeding strategies may underlie and predict their priority effects.
Within-host priority effects among symbionts have been studied relatively extensively using mathematical models (Rohani et al. 2003, Leventhal et al. 2015, Mordecai et al. 2016) and
experimental laboratory inoculations (e.g., Kennedy et al. 2009; Natsopoulou et al. 2015; Werner & Kiers 2015; Klemme et al. 2016). However, extrapolating from lab inoculations to natural
epidemics can be challenging. For example, lab inoculations often require unrealistically high concentrations of symbiont inoculum, potentially generating unrealistic interactions among symbionts. Yet within-host priority effects have largely remained unmeasured under field
conditions (but see Laine 2011).
Parasite phenology may alter within-host interactions and epidemics
Symbionts often vary in their phenology, causing them to emerge or arrive into a host population sequentially (Schmidt et al. 2007, Dumbrell et al. 2011). Variation in the timing of
parasite emergence can alter the rate of parasite spread across a landscape (Mundt et al. 2009, Tian et al. 2015), thereby directly altering parasite epidemics. Variation in phenology may also indirectly influence epidemics by altering within-host interactions. The sequence in which
symbionts infect individual hosts may be altered by the sequence in which symbionts arrive into the host population, thereby altering within-host priority effects. Those changes in within-host
influence which symbiont interactions can influence parasite growth or reproduction within
hosts, which may slow or accelerate epidemics of coinfecting parasites (Susi et al. 2015, Ezenwa 2016). Yet the degree to which symbiont interactions and epidemics are driven by parasite
phenology remains untested.
This experiment utilized the host tall fescue and four co-occurring symbionts to examine how parasite phenology alters (1) parasite epidemics, (2) within-host priority effects among
symbionts, and (3) within-host symbiont interactions that determine parasite growth rates. To measure these effects, we quantified parasite incidence and infection severity on three cohorts of
sentinel tall fescue plants. The cohorts were distributed across the growing season such that each cohort experienced a different sequence of parasite arrival, with all three parasites arriving sequentially in the first cohort, two parasites arriving at the same time followed by a third in the
second cohort, and all three parasites arriving simultaneously in the third cohort. Here, we experimentally measure for the first time how parasite phenology influences epidemics of
coinfecting parasites in the field. We then show that the sequence of arrival due to parasite phenology modified both within-host priority effects and within-host interactions that determine parasite growth.
Methods Study system
This experiment focused on four common fungal symbionts of the host, tall fescue (Lolium arundinaceum): the parasites Puccinia coronata, Colletotrichum cereale, and
Rhizoctonia solani, and the vertically transmitted endophyte, Epichloë coenophiala (Table 1).
within-host fungal interactions have been tested experimentally, leading to specific predictions
for our system (Fig. 2.1). Biotrophic fungal parasites commonly facilitate necrotrophs, which inhibit biotrophs via a combination of competition for host resources and induced resistance
(Mundt et al. 1995, Al-Naimi et al. 2005, Spoel et al. 2007, Kliebenstein and Rowe 2008). We therefore expected Puccinia to facilitate Rhizoctonia, and Rhizoctonia to inhibit Puccinia. Hemibiotrophs initially infect hosts as biotrophs, during which time we expected them to
experience antagonism from both biotrophs and necrotrophs, to inhibit other biotrophs, and to facilitate necrotrophs. When they switch to a necrotrophic feeding strategy, we expected them to
still experience antagonism from necrotrophs, but to be facilitated by biotrophs, and to inhibit other nectrotrophs and biotrophs. Integrating across this ontogenetic shift, we expected
Colletotrichum to inhibit both Puccinia and Rhizoctonia, Puccinia to have either (indicated by *
in Fig. 2.1) a net positive or a net negative effect on Colletotrichum, and Rhizoctonia to have a net negative effect on Colletotrichum. Vertically transmitted fungal endophytes can facilitate or
suppress infection by fungal parasites via resource competition and changes in host immunity, which depend on parasite feeding strategies (Potter 1980, Potter 1982, Liu et al. 2006, Saikkonen et al. 2013). Therefore, we expected the endophyte to facilitate biotrophs such as Puccinia, and
to inhibit hemibiotrophs and necrotrophs such as Colletotrichum and Rhizoctonia.
Experimental Design
The study was carried out at Widener Farm, an old field in Duke Forest Teaching and Research Laboratory (Orange County, NC, USA) that produced row crops until 1996. Since
During the 2013 - 2015 growing seasons, we observed sequential arrival of each parasite
species into the host population, with Colletotrichum arriving first, followed by Rhizoctonia, and then Puccinia (Fig. 2.2, Table 2.1, Appendix A1). Specifically, Colletotrichum infected at least
30% of leaves in every survey between 2013 and 2015. Rhizoctonia infections began appearing on leaves in July 2014 and June 2015. Puccinia emerged in September 2013 and 2014 and in August 2015.
To evaluate the effects of the sequence of arrival of parasites into the host population, we placed three cohorts of uninfected, sentinel outplants into the existing vegetation at different
times during the parasites’ natural epidemics during the 2015 growing season. We used surveys of existing plants to determine when an epidemic of one parasite had begun, and transplanted the next cohort of plants shortly after that. The first cohort was placed on 22 June 2015, during the
Colletotrichum epidemic, but before other parasite epidemics began. The second cohort was
placed on 27 July 2015, shortly after the start of the Rhizoctonia epidemic, but before the
Puccinia epidemic began. The third cohort was placed on 21 September 2015, shortly after the
start of the Puccinia epidemic, when all three parasites were present. Environmental conditions may drive parasite phenology. We therefore tracked infections on each cohort until the first hard
freeze on 29 Oct 2015, allowing for the comparison of epidemics among the cohorts at the same time. Because roughly one new leaf emerged per week on each plant, each cohort included
leaves of the same age that were exposed to the same environmental conditions during the time when multiple cohorts were in the field.
Each cohort consisted of 40 plants (20 from endophyte-infected seed and 20 from
herbivory, and transplanted into the field by burying each plant in its individual pot in a hole
within an approximately 16m2 area that was fenced to exclude vertebrate herbivores. The relative location of individual plants in the field was randomized across all three cohorts, and plants were
rearranged weekly to homogenize exposure to fungal parasites. Plants that failed to establish or that resulted from seed contamination by the wrong species were excluded from analyses. This resulted in a total of 30 plants from the first cohort (13 from endophyte-infected seed and 17
from endophyte-free seed), 40 plants from the second cohort (20 from endophyte-infected and 20 from endophyte-free seed), and 36 plants from the third cohort (19 from endophyte-infected and
17 from endophyte-free seed) that were evaluated for symbiont interactions (Additional details in Appendix A2). All plants were harvested on 29 October 2015.
Survey
All leaves on one focal tiller (ramet) of each plant (genet) were surveyed weekly for infection by foliar parasites. Each leaf was surveyed from emergence to senescence, or until the
end of the study. This yielded 303 total leaves in the first cohort, 206 leaves in the second cohort, and 204 leaves in the third cohort. On each leaf, the initial date of symptomatic infection by each
parasite was recorded, and the percent of leaf area infected by that parasite (“infection severity”) was estimated by visually comparing leaves to reference images of leaves of known infection severity (Mitchell et al. 2002, 2003).
Leaf age was used as a proxy for exposure to parasite propagules. When plants were transplanted into the field and initially surveyed, pre-existing leaves were assigned age 0. Each
leaves were individually identified based on their vertical order on the tiller, with their age
recorded as the days since age 0.
At the conclusion of the experiment, we tested endophyte infection via immunoblot
(Agrinostics Ltd. Co, Watkinsville, GA) and microscopy, but were unable to detect endophyte infection in the experimental plants. We also tested endophyte infection via immunoblot on 100 seeds from the seed lot used to propagate infected hosts. 98% of the
endophyte-infected and 0% of the endophyte-free seeds tested positive for endophyte infection. Endophyte infection in seeds was also confirmed via microscopy, but tests on plants grown from these seeds
confirmed that host seeds were endophyte-infected, but that host plants were not.
Data analysis
Leaves were analyzed as hosts because each parasite infection is restricted to a single leaf. Each model analyzed one cohort of plants, and included one dependent variable pertaining to one parasite species (“the focal parasite”). Each model accounted for both nestedness (leaves
nested within host plants) and temporal autocorrelation between surveys caused by seasonal changes in the environment (Appendix A3). We analyzed all data in R version 3.2.3 (R Core
Team 2015).
To evaluate the magnitude of epidemics, we used parasite prevalence. This was calculated as the proportion of host leaves infected by each parasite.
We modeled parasite interactions following the analytical framework described in Fenton et al (2014). Specifically, we modeled focal parasite infection at a given time as a linear function
applied this framework to both within-host priority effects and within-host interactions that
determine parasite growth.
To evaluate within-host priority effects, we used a Cox-proportional hazards mixed
model from the R package, coxme (Therneau 2012), to measure the probability of infection by the focal parasite. The dependent variable in each model was time to infection. This time to infection is modeled as emerging from a baseline rate of infection that is shared by all
individuals and modified by a linear combination of predictor variables. Leaves that do not become infected are right-censored, meaning that time to infection is assumed to be greater than
the time of observation. Exponentiated coefficients on predictor variables are interpreted as multiplicative changes in infection rate.
To evaluate within-host interactions that determine parasite growth rate, we modeled the
growth of each focal parasite as its change in infection severity with respect to leaf age, using the nlme package for linear mixed effects models (Pinheiro et al. 2016). The dependent variable,
severity, was log-transformed to increase linearity of the relationship to predictors and homoscedasticity of the residuals. This measure of focal parasite growth encompasses both lesion expansion and new infections within leaves.
For both within-host priority effects and within-host interactions that determine parasite growth, some models contained multiple interactions involving leaf age that were non-significant
and had correlated parameter estimates, indicating that the interactions were redundant. To avoid such redundancy, non-significant interactions among fixed-effects were removed from models using likelihood ratio tests (Crawley 2007, Zuur et al. 2009), and overall impacts of symbiont
interactions were then determined by evaluating the parameter estimates from the reduced
leaf age and previous infection severity), the overall impact of each symbiont was assessed by
evaluating model-estimated values of each predictor variable over the range of observed values, weighted by the number of observations of each value. This way, we avoided extrapolating
model results into areas where there was no data.
Results Does parasite phenology alter epidemics?
Parasite sequence of arrival had a profound impact on the epidemics of all three parasites (Fig. 2.3). These impacts can be seen in terms of the peak prevalence of each parasite.
Colletotrichum prevalence was highest (nearly 70%) in the first cohort, when
Colletotrichum was able to colonize hosts in the absence of other parasites. In the two later
cohorts, when at least one other parasite species was present in the field when plants were transplanted, Colletotrichum peak prevalence decreased to less than 20%.
Rhizoctonia prevalence was lowest (less than 30%) in the first cohort, when
Colletotrichum was able to colonize hosts first. In the second cohort, when plants were
transplanted into the field after the Rhizoctonia epidemic had begun, Rhizoctonia prevalence
increased substantially, to a peak of 85%. Although still higher than in the first cohort, peak prevalence was reduced to 73% in the third cohort, indicating a potential negative effect of Puccinia on Rhizoctonia when they were able to colonize host individuals at the same time.
Puccinia prevalence was highest in the first cohort, when Colletotrichum was able to
colonize hosts first. This pattern differs from Colletotrichum and Rhizoctonia prevalence, which
had begun. Thus, rather than responding to arrival of Puccinia into the host population, Puccinia
prevalence appeared to respond to the magnitude of the Rhizoctonia epidemic, which in turn was modulated by the sequence of arrival of Rhizoctonia and Colletotrichum into the host population.
Does parasite phenology alter within-host priority effects?
For each cohort, we measured within-host priority effects by evaluating how previous
infection of a leaf by other symbionts (parasites and endophyte) influenced the risk of subsequent infection by each focal parasite. Within-host priority effects varied among cohorts (Fig. 2.4a). This is consistent with the hypothesis that parasite phenology modifies within-host priority
effects.
In the first cohort (Fig. 2.5a-c), where hosts were exposed to Colletotrichum before the
other parasites, previous infection by Colletotrichum was initially associated with increased relative risk of subsequent infection by Puccinia that switched to become increasingly negative as leaves aged (X2=11.59, df=1, p=0.0007). Previous infection by Puccinia was associated with
an increased risk of subsequent infection by Colletotrichum that weakened as leaves aged (X2=17.50, df=1, p<0.0001), and an increased risk of subsequent infection by Rhizoctonia that
weakened as leaves aged (X2=6.76, df=1, p=0.0093). Previous infection by Rhizoctonia was associated with an increasingly negative relative risk of subsequent infection by Colletotrichum as leaves aged (X2=7.09, df=1, p=0.0078). Finally, the endophyte did not influence infection risk
of any focal parasite in the first cohort (Table A2.1, A2.4).
In the second cohort, where uninfected hosts were exposed to Rhizoctonia and
Colletotrichum at the same time, no significant relationships were identified between
infection in the second cohort, and so its interactions with other parasites were not evaluated
statistically. However, the lack of infections by Puccinia may be evidence of a strong priority effect by Rhizoctonia, mediated by host mortality. In the second cohort, 94% of Rhizoctonia
infections occurred on leaves uninfected by any other parasite, and Rhizoctonia reached its highest severity (up to 80% of leaf area damaged) in those infections. Consequently, 40% of plants in the second cohort died by the time the Puccinia epidemic began, and host mortality
nearly doubled in the following two weeks, essentially eliminating the chance of Puccinia establishing an infection in that cohort.
In the third cohort (Fig. 2.5d), where uninfected hosts were exposed to all three parasites simultaneously, previous infection by Rhizoctonia was initially associated with an increased relative risk of subsequent infection by Puccinia that switched to become increasingly negative
as leaves aged (X2=14.97, df=1, p=0.0001). Previous infections by Puccinia and Colletotrichum were not associated with any changes in risk of infection by other parasites (Table A2.3, A2.4).
Finally, the endophyte was associated with an increased risk of infection by Puccinia (X2=4.80, df=1, p=0.029).
Does parasite phenology alter within-host interactions that determine parasite growth rates?
For each cohort, we evaluated how previous infection (presence/absence for the
endophyte, log+1-transformed infection severity during the previous survey for other parasites)
influenced the log-transformed infection severity of each focal parasite in infected leaves and the rate at which infection severity increased as leaves aged (i.e., the focal parasite growth rate
varied among cohorts (Fig. 2.4b, Table A2.5-A2.8). This is consistent with the hypothesis that
parasite phenology moderates these interactions.
In the first cohort, (Fig. A2.1), previous infection severity of Colletotrichum was associated
with increased Puccinia growth (F1,127=9.22, p<0.01), generating a positive per-capita effect of Colletotrichum on Puccinia across 78% of infected leaves. Previous infection severity of
Colletotrichum was marginally significantly associated with decreased Rhizoctonia growth
(F1,109=3.08, p=0.05), and previous infection severity of Puccinia and Rhizoctonia were each associated with decreased Colletotrichum growth (F1,355=3.44, p=0.04; and F1,355=9.16, p<0.01,
respectively). Together these effects generated negative per-capita effects of Colletotrichum on Rhizoctonia, and of both Puccinia and Rhizoctonia on Colletotrichum, across more than 99% of
infected leaves. Finally, the endophyte had a negative effect on Colletotrichum growth (F1,25=6.4,
p=0.02) and a positive effect on Puccinia growth (F1,23=10.58, p<0.001; Table A2.5, A2.8). In the second cohort, no significant relationships were identified between Rhizoctonia,
Colletotrichum, or the endophyte, and because Puccinia only established a single infection in the
second cohort, its interactions with other parasites were not evaluated (Table A2.6, A2.8). In the third cohort, previous Colletotrichum severity was associated with decreased
Rhizoctonia growth (F1,135=4.64, p=0.03; Table A2.7, A2.8, Fig. A2.2), generating a negative per-capita effect of Colletotrichum on Rhizoctonia across 99% of infected leaves. The endophyte
facilitated Puccinia growth (F1,29=8.87, p=0.01; Fig. A2.2), and inhibited Colletotrichum growth (F1,39=4.97 p=0.03; Fig. A2.2). Rhizoctonia and Puccinia did not significantly affect the growth of other parasites (Table A2.7, A2.8).
Discussion
This experiment aimed to evaluate whether parasite phenology alters symbiont
interactions and consequently parasite epidemics. The results indicate that parasite phenology
can be an important source of historical contingency for parasites, though some caution should be used when interpreting specific relationships between symbionts, owing to a lack of
replication over multiple sites and years. Historical contingency has recently been applied to
describe any ecological outcome influenced by the order or timing of past events (Fukami 2015). This can include processes like priority effects, ecological succession, and community assembly.
Here, experimental manipulation of parasite sequence of arrival into the host population modified within-host priority effects, within-host interactions that determine parasite growth rates, and parasite prevalence. Together, these results indicate that historical contingency can
profoundly influence parasite epidemics and interactions.
In this system, parasite phenology acted similarly to regional-scale processes in
free-living communities. Interactions among individuals define the scale of “local processes”, including both deterministic interactions and priority effects (Ricklefs 1987). Local processes can be strongly influenced by processes at larger spatial scales, termed “regional processes”.
Regional processes can influence the potential for priority effects by altering the sequence of arrival in a local patch (Fukami 2015). Similarly, variation in parasite sequence of arrival into the
host population may have influenced within-host priority effects by altering the sequence of infection within leaves. In the first cohort, 74% of all leaves that became infected by any parasite were infected by Colletotrichum first. That number was reduced to 16% and 27% in the second
population sequentially (Schmidt et al. 2007, Mundt et al. 2009, Dumbrell et al. 2011, Tian et al.
2015), and these results indicate that this can be a regional source of historical contingency that influences local interactions among symbionts.
The three experimental cohorts also profoundly altered patterns of parasite prevalence. This effect may have arisen from altered susceptibility to secondary infection driven by changes in the sequence of infection within individual hosts. For example, hosts experienced high
mortality in the second cohort, where plants were exposed to epidemics of both Rhizoctonia and Colletotrichum. The high mortality was apparently due to increased colonization of healthy
leaves by Rhizoctonia, and precluded infection by other parasites. Similar resource preemption can occur when species with adequate propagule supply are able to rapidly colonize available habitat, and then prevent potential competitors from colonizing (Rohani et al. 2003, Tilman
2004, Limberger and Wickham 2011, Livingston et al. 2012).
Across the three experimental cohorts, and consistent with many laboratory inoculation
studies (e.g., Adame-Avarez et al. 2014; Natsopoulou et al. 2015; Klemme et al. 2016), some interactions among symbionts were contingent on the sequence of infection within individual hosts, generating priority effects within those hosts. Furthermore, among those interactions that
were contingent on the sequence of infection, the strength or direction of that priority effect was often influenced by leaf age. In other words, within-host priority effects experienced their own
contingencies.
This contingency of priority effects on leaf age was largely consistent with mechanisms of interactions among parasites differing in feeding strategy. Biotrophic parasites can facilitate
another (Glazebrook 2005, Thaler et al. 2012). However, this crosstalk is temporary and spatially
restricted within plants (Spoel et al. 2007, Koornneef et al. 2008). Consequently, facilitation by biotrophs may weaken as leaves age and are exposed to more necrotrophs (Vos et al. 2015). This
experiment provides some support for this hypothesis. The facilitative effect of Puccinia, an obligate biotroph, on both Colletotrichum, a hemibiotroph, and Rhizoctonia, a necrotroph, weakened as leaves aged in the first cohort. In contrast, necrotrophic parasites often antagonize
biotrophs via resource preemption when they kill host cells (Al-Naimi et al. 2005). This may strengthen over time if necrotroph growth within the host reduces the availability of live host
cells that biotrophs can infect. Antagonism by necrotrophs may therefore strengthen as leaves age. Our experiment supports this hypothesis as well. The antagonistic effect of Rhizoctonia on Colletotrichum increased as leaves aged in the first cohort. Our results are also consistent with
effects of leaf age that are relatively independent of parasite feeding strategy. Some interactions may experience a lag time between infection by the first parasite and the biochemical changes
that induce resistance to subsequent infections. In these circumstances, priority effects should increase as leaves age (e.g., the effect of Rhizoctonia on Colletotrichum in Cohort 1). Induced resistance can also weaken over time (Underwood 1998, Laine 2011). In these circumstances,
priority effects should decrease as leaves age (e.g., the effect of Puccinia on both Rhizoctonia and Colletotrichum in Cohort 1). These results indicate that parasite feeding strategy may be a
key factor influencing parasite interactions.
We hypothesized that the endophyte could alter parasite infection and within-host growth by two mechanisms. First, the endophyte may compete with parasites for resources (e.g., Pańka
endophyte was unable to leave the seeds and colonize leaf tissue. Nonetheless, the endophyte
influenced parasite infection and within host growth. The second hypothesized mechanism is that the endophyte alters inducible host defenses against the parasites (e.g., Saikkonen et al. 2013).
This is hypothesized to occur via two host defense systems, each responding to different parasite feeding strategies, and between which there is cross-talk; together these may allow the endophyte to inhibit Rhizoctonia, facilitate Puccinia, and facilitate infection but inhibit growth of
Colletotrichum. Defense priming (e.g., Conrath et al. 2006), further enhances these responses to
parasites, is systemic, and persists long after exposure to symbionts (Pieterse et al. 2014) . Our
results are consistent with the effects of the endophyte on the parasites being mediated by these host defense systems.
Finally, we found that parasite phenology can alter the sequence of parasite arrival into a
host population. This may subsequently alter the sequence of arrival onto individual hosts. Within-host priority effects occur when that sequence of arrival onto host individuals influences
the probability of coinfection (e.g., Mordecai 2011, Fukami 2015, Fukami et al. 2016). Consequently, these results demonstrate a mechanism by which parasite phenology can alter within-host priority effects.
Conclusions
Symbiont interactions influenced natural epidemics in multiple ways, often
simultaneously. Within hosts, we found evidence of priority effects that prevented coinfection. When hosts became coinfected, deterministic interactions influenced parasite growth.
contingency in epidemics. Moreover, these results demonstrate that symbiont interactions can
influence parasite epidemics across scales. These results may advance a more general
understanding of how regional processes influence local interactions. Regional processes are
rarely measured because they often occur over experimentally and observationally intractable time scales (but see Viana et al. 2016). This experiment supports the growing body of literature suggesting that symbionts represent tractable models for studying ecological processes that
Table 2.1 – Biology and ecology of the focal symbionts
Parasite Disease caused Feeding Strategy Transmission Seasonality Colletotrichum
cereale
anthracnose Hemibiotroph - initially colonizes and extracts resources from living cells, but then switches to kill living cells and extract resources from the dead tissue Mucilaginous spores, primarily dispersed by rain splash
Infections occur on most plants
throughout the growing season
Puccinia coronata
crown rust Obligate biotroph - can only infect and survive on living host tissue
Windborne spores
A single epidemic begins around early September and increases until the growing season ends
Rhizoctonia
solani AG1-1A brown patch Facultative necrotroph - can survive in the soil as a saprobe, and when it infects plants, it kills living cells and extracts resources from the dead tissue.
Hyphal growth and
fragmentation, not spores.
A single epidemic starts around July and tapers off as temperatures cool in the fall
Epichloë coenophiala
none Intercellular endophyte - restricted to living plant tissue and systemic through aboveground tissues. Vertical transmission via seedborne mycelium
Figure 2.1 - Hypothetical interaction network between a vertically transmitted fungal endophyte and subsequently colonizing fungal parasites. Blue arrows represent positive interactions (e.g., facilitation). Red clubs represent negative interactions (e.g., inhibition).
Vertically Transmitted Fungal Endophyte (e.g., Epichloë coenophiala)
Biotrophic Fungal Parasite (e.g., Puccinia coronata)
Hemibiotrophic Fungal Parasite
(e.g., Colletotrichum cereale)
Necrotrophic Fungal Parasite
Figure 2.2 - Parasite sequence of arrival into the host population during 2013 – 2015 surveys. Points represent the average first date that at least 1% of host leaves in 2013 and 2014 and 1% of plots in 2015 were infected by each parasite. Error bars represent the earliest and latest date of first infection across the surveys.
●
●
●
Colletotrichum
Rhizoctonia
Puccinia
Apr Jun Aug Oct