VEHICULAR TRAFFIC EXPOSURE TO POLYCYCLIC AROMATIC HYDROCARBONS AND BREAST CANCER RISK
Irina Mordukhovich
A dissertation submitted to the faculty of the University of North Carolina at Chapel Hill in partial fulfillment of the requirements for the degree of Doctor of Philosophy in the Department
of Epidemiology in the Gillings School of Global Public Health.
Chapel Hill 2013
iii ABSTRACT
Irina Mordukhovich: Vehicular Traffic Exposure to Polycyclic Aromatic Hydrocarbons and Breast Cancer Risk
(Under the direction of Marilie D. Gammon)
Polycyclic aromatic hydrocarbons (PAHs) are ubiquitous environmental pollutants, known human lung carcinogens, and potent mammary carcinogens in animal models. However, the association between PAHs and breast cancer in women is unclear. Vehicular traffic is a major source of ambient PAH exposure. This study evaluates the association between residential exposure to vehicular traffic-related PAHs and risk of breast cancer, overall and by tumor
subtype, and within strata of nucleotide excision repair and base excision repair genotypes and fruit/vegetable intake. For this population-based study, residential histories, dietary intake, and other factors were assessed in 1996-1997 for 1,508 newly diagnosed breast cancer cases and 1,556 controls. Residential traffic exposure estimates were reconstructed using a validated model for the years 1960 through 1995. The following single nucleotide polymorphisms were genotyped: ERCC1 8092C/A, OGG1 Ser326Cys, XPA -4A/G, XPD Lys751Gln and Asp312Asn, XPF Arg415Gln, XPG Asp1104His, XRCC1 Arg194Trp and Arg399Gln. Medical records and archived tumor tissue were used to determine case tumor subtype.
iv
estimates, compared with below the median (1.44 (0.78, 2.68)). Associations between recent traffic exposure in 1995 (top 5% vs. below the median) and breast cancer were attenuated toward the null (1.14 (0.80, 1.64)), but were stronger among women with low fruit/vegetable intake (1.46 (0.89, 2.40)) and hormone-receptor negative tumors (1.67 (0.91, 3.05)). Associations were approximately two- to three-fold stronger among women with variant alleles for XPD
v
TABLE OF CONTENTS
List of Tables………...…...viii
List of Figures………...x
List of Abbreviations………..…xi
Chapter I: Background……….1
Breast Cancer Biology and Epidemiology……….……..1
Environmental Exposures and Breast Cancer……….……….5
PAH Exposure Sources and Associations with Breast Cancer……….…..……...…7
Traffic and Air Pollution……….…………...28
PAHs and Breast Cancer: Proposed Mechanisms………..46
DNA Repair Mechanisms: Biology and Epidemiology……….61
Addressing Limitations of Previous Investigations………...76
Summary and Conclusions……….………....79
Chapter II: Research Methods………...81
Research Aims, Hypotheses, and Study Rationale………....………81
Long Island Breast Cancer Study Project (LIBCSP)……….……89
Results from the LIBCSP: PAH-Related Exposures and Breast Cancer………….……..93
PAH Exposure Assessment: A Historical Geographic Model……….……..96
Genotyping Assays……….………..104
Covariate Assessment……….………..110
vi
Strengths and Limitations………120
Summary………...…………125
Chapter III: Exposure to Traffic-Related Polycyclic Aromatic Hydrocarbons and Breast Cancer Risk………127
Introduction………..127
Materials and Methods……….128
Results………..134
Discussion………...……….136
Conclusions………..139
Supplemental Material………...………..145
Chapter IV: Polymorphisms in DNA Repair Genes, Traffic-Related Polycyclic Aromatic Hydrocarbon Exposure, and Breast Cancer Risk……….148
Introduction……….…….148
Materials and Methods……….……149
Results……….….154
Discussion………156
Conclusions………..161
Chapter V: Discussion………..167
Summary of Study Aims and Rationale………...167
Summary of Results……….……167
Comparison to Previous Studies ………..…...168
Biological Plausibility and Potential Underlying Mechanisms……….…….….172
Study Limitations……….173
vii
Future Directions, Public Health Implications and Conclusions……….177
viii LIST OF TABLES
Table 3.1. Distributions of cumulative residential vehicular traffic PAH exposure estimates…140 Table 3.2. Residential traffic polycyclic aromatic hydrocarbon exposure
estimates by case-control status………..…...………..141 Table 3.3. Associations between varying time ranges of exposure to PAHs
from residential traffic and breast cancer risk………..………142 Table 3.4. Associations between residential vehicular traffic exposure and
breast cancer risk, within strata of fruit/vegetable intake and menopausal status…...…143 Table 3.5. Associations between residential vehicular traffic PAH exposure
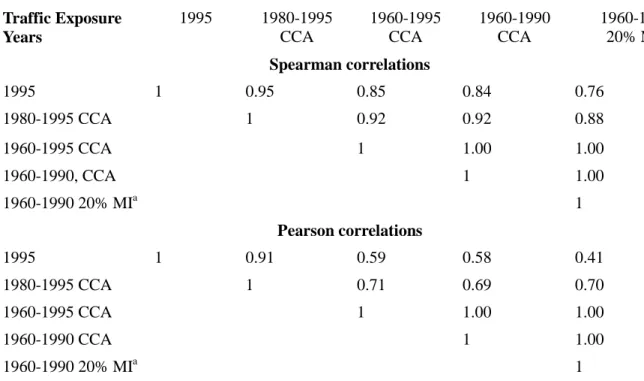
and the risk of breast cancer categorized by tumor hormone receptor status……...…...144 Table 3.6. Correlations between selected residential vehicular traffic PAH
exposure variables………...……….147 Table 4.1. Associations between traffic polycyclic aromatic hydrocarbon
exposure in 1995 and breast cancer, stratified by DNA repair genotype………..……...162 Table 4.2. Associations between traffic polycyclic aromatic hydrocarbon
exposure in 1960-1990 and breast cancer, stratified by DNA repair genotype…………164 Table 4.3. Associations between traffic PAH exposure and breast cancer, stratified
by combined DNA repair genotypes in XPD, XRCC1, and OGG1 ………...….……….…166 Table A2.1 Previously reported participant characteristics by case-control status.……….180
Table A2.2. Associations between traffic exposure in the year 1995 and breast
cancer, overall and among long-term residents………....182
Table A2.3. Associations between selected residential traffic exposure variables
and breast cancer, removing participants with the highest exposure levels…………...183
Table A2.4. Associations between traffic polycyclic aromatic hydrocarbon exposure
and breast cancer, varying the relative contribution of the pre-arrival surrogate…...….184
Table A2.5. Associations between traffic PAH exposure and breast cancer,
turning off the intersection component of exposure model……….…185 Table A2.6. Associations between traffic PAH exposure and breast cancer, with
ix
Table A2.7. Associations between selected residential traffic exposure variables
and breast cancer categorized by tumor characteristics………..….187 Table A2.8. Previously reported main effects of DNA repair polymorphisms on
x
LIST OF FIGURES
Figure A1.1 Metabolism of Polycyclic Aromatic Hydrocarbons in Relation to
xi
LIST OF ABBREVIATIONS ACS: American Cancer Society
Ah: Aryl hydrocarbon AP: Apurinic
ATSDR: Agency for Toxic Substances and Disease Registry BER: Base excision repair
BPDE: Benzo[a]pyrene diolepoxide
CA EPA: California Environmental Protection Agency
CARB: California Environmental Protection Agency Air Resources Board CCA: complete case analysis
CI: Confidence interval CK5/6: Cytokeratin 5/6 CO: Carbon monoxide CYP: Cytochrome P450
EGFR: Epidermal growth factor receptor EHHI: Environment and Human Health, Inc. ELISA: Enzyme-linked immunosorbent assay ER: Estrogen receptor
ERCC1: Excision repair cross-complementing group 1 FEN1: Flap structure-specific endonuclease 1
FFQ: Food frequency questionnaire FP: Fluorescence polarization
xii GGR: Global genome repair
GST: Glutathione S-transferase
HER2: Human epidermal growth factor receptor 2 HR: Homologous recombination
HWE: Hardy-Weinberg equilibrium
IARC: International Agency for Research on Cancer IQR: interquartile range
LIBCSP: Long Island Breast Cancer Study Project LIG1: DNA ligase I
MALDI-TOF: Matrix-assisted laser desorption/ionization time-of-flight MI: Multiple imputation
MMR: Mismatch repair
NCRP: National Council on Radiation Protection and Measurement NER: Nucleotide excision repair
NHEJ: Non-homologous end-joining repair NTP: National Toxicology Program
OGG1: 8-oxoguanine DNA glycosylase 1 OR: Odds ratio
OSHA: Occupational Health and Safety Administration PAH: Polycyclic aromatic hydrocarbons
PBS: Phosphate-buffered saline
xiii PM: Particulate matter
PR: Progesterone receptor ROS: Reactive oxygen species SD: Standard deviation
SNP: Single nucleotide polymorphism TCR: Transcription-coupled repair TSP: Total suspended particulates US: United States
USDOT: United States Department of Transportation US EPA: United States Environmental Protection Agency UV: Ultraviolet
VOCs: Volatile organic compounds WHO: World Health Organization XP: Xeroderma pigmentosum
1
CHAPTER I: BACKGROUND
This investigation aims to examine associations between historical residential traffic-related polycyclic aromatic hydrocarbon (PAH) exposure and breast cancer, and to examine gene-environment interactions between traffic PAHs and DNA repair polymorphisms with
respect to breast cancer risk. Secondary aims include examining effect modification of the traffic PAH-breast cancer association by fruit and vegetable intake and menopausal status, and
evaluating associations between traffic PAHs and breast cancer with cases categorized according to tumor hormone receptor status and p53 mutation status.
The following chapter provides a detailed review of the relevant literature. Specifically, Chapter I presents information regarding breast cancer biology and epidemiology, PAH sources, including traffic and air pollution, and relevant metabolic pathways, including DNA repair processes and genetic polymorphisms.
BREAST CANCER BIOLOGY AND EPIDEMIOLOGY
2 breast cancer unless otherwise noted.
The human breast is primarily composed of lobules (glands which produce breast milk) and ducts for the release of milk (ACS 2009-2010). The breast also contains lymphatic, connective, and fatty tissues (ACS 2009-2010). Most diagnosed breast cancers are ductal or lobular adenocarcinomas (ACS 2009-2010, ACS 2011, Kelsey and Horn-Ross 1993), and are invasive (i.e. having spread out of one tissue type into another) rather than in situ (ACS 2009-2010, ACS 2011). Invasive ductal carcinoma is the most common form of the disease (ACS 2011).
The risk factors and etiology of breast cancer, both genetic and lifestyle/environmental, are incompletely understood. Confirmed genetic risk factors for breast cancer are divided into three categories: (1) rare, high-penetrance genetic mutations (e.g. in BRCA1 or BRCA2) that confer a large personal risk of breast cancer, (2) rare, intermediate-penetrance genetic mutations (e.g. in ATM or CHEK2), and (3) low-penetrance, common single nucleotide polymorphisms (SNPs) that confer a low personal risk of breast cancer but are so prevalent as to be significant on a public health/population level (e.g. SNPs found in FGFR2 or LSP1) (Turnbull and Rahman 2008).
Family history of breast cancer, which represents shared genetic and
lifestyle/environmental factors (Lichtenstein et al. 2000), is also an established risk factor for the disease (ACS 2009-2010), especially for women with more than one affected relative (ACS 2009-2010). However, most women diagnosed with breast cancer do not have a family history of this disease (Mayo Clinic 2011).
3
parity, late menopause, early menarche, and little or no lactation), medical history (exposure to ionizing radiation, hormone replacement therapy use, recent oral contraceptive use, high breast density, personal history of certain types of benign breast disease, and personal history of breast and certain other cancers), body mass index, alcohol intake, and low physical activity levels. Breast cancer risk factor profiles differ by menopausal status (Barlow et al. 2006, Velentgas and Daling 1994). For example, obesity is an established risk factor for postmenopausal breast cancer, but is negatively associated with premenopausal breast cancer risk (Rose and Vona-Davis 2010, Velentgas and Daling 1994).
Many breast cancer risk factors are related to systemic circulating estrogen levels (Brody and Rudel 2003, Pike et al. 1993). For example, in postmenopausal women, endogenous
estrogen mainly originates in adipose tissue stores. Therefore, increased body size is likely to be related to postmenopausal breast cancer risk through estrogenic pathways (Hankinson 2005-2006). Circulating estrogen levels are consistently associated with postmenopausal breast cancer risk in epidemiologic research (Hankinson et al. 2004, 2005-2006, Kaaks et al. 2005, Key et al. 2002). Clinical investigations report that estrogen receptor antagonists, such as the drug
tamoxifen, can prevent breast cancer development (ACS 2009-2010, Visvanathan et al. 2009). Breast cancer risk factor profiles, both genetic and lifestyle/environmental, differ with respect to tumor estrogen and progesterone receptor (ER/PR) status (Althuis et al. 2004, Chen and Colditz 2007, Colditz et al. 2004, Garcia-Closas and Chanock 2008). Estrogen plays a role in the development of a subset of breast tumors: "ER+ tumors are those with the capacity to be stimulated by estrogen (Dickson and Stancel 2000) and among these, PR expression is
4
could be attributable in part to differences in tumor hormone receptor status distribution between study populations (Chen and Colditz 2007).
Breast cancer risk factor patterns may also differ with respect to tumor subtypes defined by hormone receptor status in combination with other markers such as human epidermal growth factor receptor 2 (HER2/neu)orcytokeratin immunohistochemical expression status (Chen and Colditz 2007, Millikan et al. 2008, Susan G. Komen for the Cure 2010, Yang et al. 2011). More specifically, breast tumors are generally classified into the following molecular subtypes: luminal A (ER+ or PR+, HER2-), luminal B (ER+ or PR+, HER2+), HER2 type (ER-, PR-, HER2+), and triple-negative (ER-, PR-, HER2-). Using data on immunohistochemical expression of
cytokeratin 5/6 (CK5/6) and epidermal growth factor receptor (EGFR) proteins, triple-negative breast cancer can be further categorized into basal-like (ER-, PR-, HER2-, CK5/6+ or EGFR+) and unclassified (ER-, PR-, HER2-, CK5/6-, EGFR-) subtypes (Chen and Colditz 2007,
McCullough L. et al, unpublished data, Millikan et al. 2008, Susan G. Komen for the Cure 2010, Yang et al. 2011). Although it is too early to make definitive conclusions, research suggests that triple-negative breast cancer differs in etiology from hormonally responsive breast cancer, with studies reporting positive associations between triple-negative cancer, parity and premenopausal body mass (McCullough L et al, unpublished data, Millikan et al. 2008, Susan G. Komen for the Cure 2010, Yang et al. 2011). Triple-negative breast cancer comprises approximately 10-25% of all breast cancers, and is overrepresented among premenopausal and African American women (Chen and Colditz 2007, Carey et al. 2006, 2010, McCullough L et al, unpublished data).
Hormonally responsive, luminal tumors are the predominant breast cancer subtypes in the United States, particularly among White, postmenopausal women (Potter et al. 1995).
5
Pharoah et al. 1999, Ross and Fletcher 1998, Susan G. Komen for the Cure 2010). Triple-negative and HER2 type cases generally have worse prognoses than luminal cases (Carey et al. 2006, 2010, McCullough L et al, unpublished data, Susan G. Komen for the Cure 2010), and luminal A cases have the best prognosis of any subtype (Susan G. Komen for the Cure 2010). Cases with p53 mutation-positive tumors tend to have worse prognoses than p53 mutation-negative cases (Pharoah et al. 1999); p53-mutation positive breast tumors are more likely to be hormone-receptor negative (Olivier et al. 2006).
ENVIRONMENTAL EXPOSURES AND BREAST CANCER
Studies of immigrant groups report that breast cancer rates gradually increase from the levels of immigrants' country of origin to the levels of their new country. This process continues into subsequent generations (Buell 1973, Kelsey and Horn-Ross 1993, Kliewer and Smith 1995). These results suggest the importance of lifestyle or environmental factors to breast
carcinogenesis (Kelsey and Horn-Ross 1993). Also pointing to a lifestyle/environmental component to breast cancer development is the relatively low breast cancer concordance
observed in studies of monozygotic twins (Brody and Rudel 2003, Lichtenstein et al. 2000, Mack et al. 2002).
Breast cancer rates vary greatly between countries and regions (Althuis et al. 2005, Hulka et al. 2008). Rates are higher in more developed and urban regions, both geographically and historically (Althuis et al. 2005, Bray et al. 2004, Kelsey and Berkowitz 1988, Laden and Hunter 1998, MacMahon 2006, Nasca et al. 1992, Reynolds et al. 2004, Sturgeon et al. 1995). In the United States, breast cancer rates are highest in the Northeast, and elevated rates are also
6
in known lifestyle, reproductive, and demographic breast cancer risk factors (Laden et al. 1997, Laden and Hunter 1998, Sturgeon et al. 1995, 2003). However, differing environmental
exposure profiles between regions may also play a role.
With the exception, to some extent, of accidents in which large amounts of radiation or environmental pollutants are released (Brody and Rudel 2003, Laden and Hunter 1998),
investigations examining environmental exposures in relation to cancer outcomes are challenging to conduct given a number of methodological issues (Laden and Hunter 1998). These include (1) difficulty finding a truly unexposed group given the ubiquity of many environmental
contaminants, (2) difficulty measuring exposures and reconstructing individual exposure histories, and (3) small hypothesized relative risks, requiring very large studies for sufficient statistical power (Laden and Hunter 1998).
Certain environmental chemicals have been hypothesized to increase breast cancer risk due to their genotoxic or hormonally active properties (Brody and Rudel 2003, el-Bayoumy et al. 1992, Laden and Hunter 1998, Morris and Seifter 1992, Nasca and Pastides 2008). However, most of these environmental contaminants have not shown a consistent association with breast cancer risk in epidemiologic research. For example, the potential relationship between
7
investigations (Gammon et al. 1998, Hulka et al. 2008). Studies may point to a weak association between electromagnetic fields and male breast cancer (Erren 2001, Weiss et al. 2005).
High-level ionizing radiation is an established environmental risk factor for breast cancer (Laden and Hunter 1998), as seen in studies of nuclear fallout and medical treatments (ACS 2009-2010, Laden and Hunter 1998, Land et al. 2003). Electric light at night, which affects circadian rhythm and melatonin production (Stevens 2009a), is also consistently related to breast cancer based on studies of sleep duration, blindness, non-day shift work, and light pollution (ACS 2009-2010, Kolstad et al. 2008, Stevens 2009a,b) (Straif et al. 2007). Bulky PAH-related DNA adducts, a form of DNA damage induced by polycyclic aromatic hydrocarbons (PAHs), are the only other environmentally-related factor consistently associated with breast cancer risk in epidemiologic research (Gammon et al. 2004a, Gammon and Santella 2008, Li et al. 1996, 2002, Perera et al. 1995, Rundle et al. 2000a).
PAH EXPOSURE SOURCES AND ASSOCIATIONS WITH BREAST CANCER
PAHs are ubiquitous environmental contaminants which contain at least two conjoined aromatic rings (Bostrom et al. 2002, International Agency for Research on Cancer [IARC] 2010). These chemicals are formed as incomplete combustion by-products of organic matter (e.g. fossil fuels; Phillips 1999, Samanta et al. 2002). Humans are exposed to PAHs via inhalation,
8
PAHs are established mammary carcinogens in laboratory rodents (Hecht et al. 2002). Certain PAHs and PAH sources (e.g. vehicular exhaust, cigarette smoke) are classified as confirmed, probable, or possible human carcinogens by several health and environmental
agencies, largely based on lung cancer studies (California Environmental Protection Agency [CA EPA] 1999, IARC 2010, Minnesota Department of Health 2004, National Toxicology Program [NTP] 2011, Straif et al. 2005, United States Environmental Protection Agency [US EPA] 2011). The association between PAHs and breast cancer in humans is not well researched and is
therefore currently unclear (Gammon and Santella 2008).
Associations between PAHs and cancer risk are difficult to evaluate for several reasons. PAH sources are usually complex mixtures of various PAHs and non-PAH carcinogens. Also, exposure to PAHs is ubiquitous, which complicates defining a referent group (Boffetta et al. 1997). Associations between PAHs and cancer risk are likely to be influenced by individual susceptibility factors as well as PAH exposure levels, which both differ between study populations (Bostrom et al. 2002)
Occupational PAH Exposure
Occupational exposure to PAHs occurs among firefighters (Caux et al. 2002), traffic policemen (Merlo et al. 1998), toll booth operators (Tsai et al. 2004a), professional drivers (Boffetta et al. 1997), heavy equipment and crane operators, and road, railroad, dock, coke-oven, aluminum, and iron and steel foundry workers (Boffetta et al. 1997, Gammon and Santella 2008, Mastrangelo et al. 1996). Other occupational PAH sources include but are not limited to rubber production, shale oil extraction, wood impregnation, energy generation from coal, oil and other fuels (including coal gasification), carbon black, carbon electrode and calcium carbide
9
al. 1997, Bostrom et al. 2002, IARC 2010). Certain workers are exposed to especially high levels of vehicular exhaust, a major PAH source. Relevant occupations include “transportation and garage work, underground mining, vehicle maintenance and examination, traffic control, logging, firefighting and heavy equipment operation” (IARC 1989).
Ambient levels of benzo[a]pyrene, a commonly measured carcinogenic PAH, range widely across occupational settings (i.e. between approximately 0.1 and 100,000 ng/m3) (Angerer et al. 1997, Castaño-Vinyals et al. 2004, IARC 2010, Ovrebo et al. 1995).
Occupational PAH exposure occurs mainly through inhalation of both gaseous and particulate PAHs and skin absorption (Boffetta et al. 1997, IARC 2010). PAHs may be absorbed through the skin from contact with coal or petroleum-derived products such as tar, soot, or pitch (Bostrom et al. 2002, IARC 2010).
Few investigations examining associations between PAHs and breast cancer are
conducted in occupational settings (Cantor et al. 1995, Labreche et al. 2010, Petralia et al. 1999, Weiderpass et al. 1999). This is largely because of the paucity of women available for such research (Brody and Rudel 2003). Two studies did not find elevated breast cancer rates among women with higher estimated occupational PAH exposures (Cantor et al. 1995, Weiderpass et al. 1999). Another study reported a positive association between employment in motor vehicle repair and breast cancer risk (Band et al. 2000). One investigation reported increased
10
a recent study reported associations between postmenopausal breast cancer and PAH exposure determined from occupational histories, especially from petroleum sources and for exposure prior to age 36 (Labreche et al. 2010). Upon stratification by tumor hormone receptor status, associations with PAHs from petroleum sources were present only for ER and PR-positive breast tumors. No significant or marginal findings were reported with respect to hormone receptor status when evaluating occupational PAH exposure from all sources (Labreche et al. 2010). General Population PAH Exposure: An Overview
In the general population, major PAH exposure sources include cigarette smoke
(Besaratinia et al. 2002), grilled, smoked or broiled foods (Phillips 1999), wood and coal-burning stoves, house dust (Lewis 1999), PAH-contaminated food crops (Bostrom et al. 2002, Morris and Seifter 2002, Phillips 1999), and air pollution from industrial emissions, traffic, and heating (Bostrom et al. 2002, IARC 2010, Lioy and Greenberg 1990, Narvaez et al. 2008). Additional PAH sources include cooking, candles and incense (Wallace 2000), contaminated soil (IARC 2010), certain pharmaceutical products (IARC 2010), space heaters, and wood, leaf and garbage burning (Bostrom et al. 2002, Friedman and Calabrese 1977, Mumtaz et al. 1996, Ramesh et al. 2004).
11 (Shen et al. 2011).
PAHs have been detected in water supplies, especially in urban areas (Bostrom et al. 2002, Morris and Seifter 1992, IARC 2010). This is due to traffic runoff (Ramesh et al. 2004), atmospheric deposition, and industrial pollution (IARC 2010, Ramesh et al. 2004). However, drinking water PAH levels are generally low due to the relative insolubility of PAHs and effective water treatment procedures (IARC 2010). Emissions from natural sources such as forest fires or volcanoes comprise a small fraction of PAHs relative to anthropogenic sources of these chemicals at ground level (Bostrom et al. 2002). It is estimated that, on average, an individual's exposure to carcinogenic PAHs from all sources amounts to approximately 3 μg per day in the general population (Castaño-Vinyals et al. 2004). Due to the ubiquity of PAH
exposure, nearly all members of the general population have measurable concentrations of urinary PAH metabolites (Huang et al. 2004, IARC 2010).
Diet is the main source of PAH exposure among occupationally exposed non-smokers (IARC 2010, Phillips 1999, Ramesh et al. 2004). Average daily dietary PAH intake is estimated to range from several nanograms to several micrograms (IARC 2010). PAHs are found in a wide variety of foods, most notably barbecued, broiled, grilled or smoked meat. They are also found in other cooked foods, foods that are processed or preserved in certain ways (e.g. oils, cereals, breads), and in environmentally contaminated foods, including vegetables, dairy products, and seafood (IARC 2010, Larsson et al. 1983, Lijinsky 1991, Ramesh et al. 2004, Roth et al. 1998). Atmospheric PAH deposition leads to contamination of foods via water, soil and air (Bostrom et al. 2002, IARC 2010, Ramesh et al. 2004, Shabad and Cohan 1972). PAH
12
areas (Bostrom et al. 2002, Ramesh et al. 2004). Crop deposition is an important source of PAH exposure in the general population (Bostrom et al. 2002).
PAH dose from inhalation has been estimated to be approximately 5-10% of dietary dose in the general population (Bostrom et al. 2002, Lioy et al. 1988). One study reported that for male non-smokers between 19 and 50 years of age, the contributions of dietary and ambient sources to total PAH dose were 96.2% and 1.6%, respectively (IARC 2010, Menzie et al. 1992). However, environmental ambient PAHs can show stronger associations with PAH-DNA adducts than diet, smoking, or occupational exposures (Beyea et al. 2006, Eder 1999). It is known that “the carcinogenic risk of PAH mixtures is highly dependent on the exposure pathway” (Ramesh et al. 2004). The impact of different exposure routes on effective biological PAH dose is unclear (Bostrom et al. 2002).
Associations between PAH-related sources and breast cancer have been explored in general population settings. Briefly, surrogates for PAH exposure that have been evaluated in relation to breast cancer risk include cigarette smoke, grilled or smoked meat intake, PAH-DNA adducts, and air pollution exposure (Bonner et al. 2005, Gammon et al. 2004a, Rundle et al. 2000a, Steck et al. 2007, Terry and Rohan 2002). The results of these efforts are described in more detail in later sections of this document. In addition, one ecological study found a null association between very low-level PAH water contamination and breast cancer after adjustment for known breast cancer risk factors (Dean et al. 1988, Laden and Hunter 1998). Another
13 metabolites) and breast cancer risk (Lee et al. 2010). Tobacco Smoke
PAH Content of Cigarette Smoke
Tobacco smoke contains several PAHs, including benzo[a]pyrene and dibenzo[a,l]pyrene, which are both potent mammary carcinogens in laboratory animals (Cavalieri et al. 1991, el-Bayoumy et al. 1995, Hecht et al. 2002). Other PAHs, such as dibenz[a,h]anthracene and benz[a]anthracene, are also found in cigarette smoke (Smith et al. 2000). Many non-PAH carcinogenic chemicals, including aromatic amines and N-nitrosamines, are found in tobacco smoke as well (Terry and Rohan 2002).
The concentration and carcinogenic activity of benzo[a]pyrene and other PAHs may be higher in sidestream than in mainstream smoke (IARC 2010, Jinot and Bayard 1996, Laden and Hunter 1998, Morris and Seifter 1992, Nasca and Pastides 2008, Nelson 2001). For example, a study of smokers found that benzo[a]pyrene exposure per 100 cigarettes ranged from 0.5 to 7.8 mg in mainstream smoke and from 2.5 to 19.9 mg in sidestream smoke (Castaño-Vinyals et al. 2004, IARC 1983).
Biological Relevance of PAHs in Cigarette Smoke to Breast Cancer Risk
14
damage according to in vivo and in vitro studies as well as epidemiological investigations (Husgafvel-Pursiainen 2004, Lodovici and Bigagli 2009).
It is also known that certain PAHs, including those found in cigarette smoke (Hecht 2002), are highly carcinogenic to the mammary gland in laboratory animals (el-Bayoumy et al. 1995, Huggins and Yang 1962, Ranadive and Karande 1963, Santodonato 1997).
Benzo[a]pyrene from cigarette smoke likewise induces neoplastic transformation of human breast epithelial cells in vitro (Russo et al. 2002).
Smoking can impact ovarian function, leading to earlier menopause onset (Kaufman et al. 1980, Tanko and Christiansen 2004). Cigarette smoke may also exhibit antiestrogenic properties, independent of effects on the ovaries (Band et al. 2002, Tanko and Christiansen 2004). For example, studies report that smoking induces hydroxylation of estrogens (specifically, via the 2-hydroxylation pathway); the metabolic products, 2-hydroxyestrogens, show little estrogenic activity and are rapidly cleared from the bloodstream (Meek and Finch 1999, Michnovicz et al. 1986, Tanko and Christiansen 2004). Similarly, an in vitro investigation using breast cancer cells reported that PAHs, a component of tobacco smoke, “inhibited estradiol-induced cell
15
PAHs also exhibit weak estrogenic activity (Santodonato 1997), and cigarette smoke has been reported to induce transcription via the estrogen receptor (Meek and Finch 1999).
The literature regarding passive smoking and endpoints related to ovarian function or estrogenic activity is relatively sparse. A recent investigation among young women reported that passive smokers had higher serum estrogen levels (for estrone, estradiol, estriol, and
16-hydroxyestrone) than active smokers, when smoking status was classified according to serum cotinine levels (Soldin et al. 2011). Serum estradiol and estriol levels were higher among passive smokers relative to both active smokers and non-smokers in this study, whether classified by serum cotinine levels or by self-report (Soldin et al. 2011). Another investigation, which did not include active smokers, reported negative associations between passive smoke exposure and urinary estrone conjugate levels among premenopausal women (Chen et al. 2005). Active smoking, but not passive smoking, has been associated with decreased antimullerian hormone levels, a marker of ovarian function (Plante et al. 2010). In another study, follicle-stimulating hormone levels, also a marker of ovarian function, were higher among active smokers (66% higher) and passive smokers (39% higher) relative to women with no active or passive smoking exposure (Cooper et al. 1995). Several investigations report negative associations between age at menopause and active smoking, but not passive smoking (Cooper et al. 1999, Cramer et al. 1995, Mikkelsen et al. 2007), though one earlier study did report a negative association between age at menopause and passive smoking (Everson et al. 1986). Active smoking, but not passive smoking, was associated with reduced mammographic density in a 2010 investigation (Butler et al. 2010).
Assessment of Smoking Patterns in Epidemiological Investigations
self-16
report and classified in a variety of ways (Terry and Rohan 2002). The most crude smoking exposure categorizations are ever/never smoking or current/former/never smoking. Some studies, especially those conducted more recently, have collected more comprehensive information on smoking patterns, including estimates of frequency, intensity, duration and recency of smoking (Terry and Rohan 2002).
Reporting of smoking patterns is subject to recall bias and social desirability bias (Brigham et al. 2010). Self-reported smoking exposure has been validated against measured cotinine levels (Nasca and Pastides 2008, Patrick et al. 1994). However, cotinine reflects only recent smoking, and cannot differentiate between levels of tobacco smoke exposure (Nasca and Pastides 2008, Patrick et al. 1994). Research has demonstrated long-term consistency of smoking reports that were collected at different time points across the life course, though concordance is not absolute (Brigham et al. 2010).
Associations with Breast Cancer
An association between cigarette smoke and breast cancer is biologically plausible based on knowledge of relevant mechanisms and pathways, cigarette smoke components, and
toxicokinetics (Hecht et al. 2002). Furthermore, smoking is a risk factor for cancers in other organs which are not directly exposed to tobacco smoke, such as the bladder and pancreas (Brennan et al. 2000, Lynch et al. 2009, Terry and Rohan 2002). The association between smoking and breast cancer has been widely studied (Terry and Rohan 2002). However, results are inconsistent across investigations (positive, null, and negative) (Palmer and Rosenberg 1993, Terry and Rohan 2002). A review by Terry and Rohan (2002) concluded that a true negative association between smoking and breast cancer is extremely unlikely.
17
polymorphisms, such as NAT2 slow acetylators (Ambrosone et al. 2008, Terry and Goodman 2006, Terry and Rohan 2002), for smoking before first birth, and for long-term passive or active smoking (Khuder and Simon 2000, Morabia 2002, Terry and Rohan 2002). For example, the literature examining associations between long-term residential passive smoke exposure and breast cancer consistently reports positive associations (Gammon et al. 2004b, Hirayama 1984, Laden and Hunter 1998, Morabia et al. 1996, Smith et al. 1994, Wells 1991).
Women may be more susceptible to initiating breast carcinogens prior to pregnancy because breast epithelial cells have not undergone terminal differentiation and are at "a peak of cell replication" (Nasca and Pastides 2008, Russo and Russo 2004). Differing results for passive versus active smoking may be due to (1) a potential antiestrogenic effect of smoking that could be present upon active but not passive exposure levels, as described above (Band et al. 2002), (2) differences in duration or timing of exposure to passive versus active smoke, as women were historically more likely to be exposed earlier in life to passive than to active smoke, (3) the failure of many studies of active smoking to remove passive smokers from the referent group, which could attenuate results (Morabia et al. 1996, Terry and Rohan 2002), and (4) competing causes of death potentially resulting from active but not passive smoking exposure levels (Dr. Marilie Gammon, personal communication 2010). It should be noted that "the California Environmental Protection Agency has concluded that regular exposure to secondhand smoke is causally related to breast cancer diagnosed in younger, primarily premenopausal women" (ACS 2009-2010) (Miller et al. 2007).
Cigarette smoking was associated with the presence of breast tumor p53 mutations in one study (Conway et al. 2002), but this result was not confirmed in a larger investigation
18
differentially associated with breast tumor hormone receptor status subtypes (Althuis et al. 2004), although individual investigations have reported evidence of differential associations (e.g. Britton et al. 2002, Gammon et al. 2004b).
Grilled and Smoked Meat
PAH Content of Grilled and Smoked Meat
PAHs are found on or near the surface of grilled, barbecued and smoked meat (Morris and Seifter 1992 Steck et al. 2007). Smoke is formed during the incomplete combustion of hydrogen and carbon in fat dripping onto a heat source; the smoke rises and deposits PAHs on meat (IARC 2010, Kazerouni et al. 2001, Lijinsky 1991, Steck et al. 2007). In addition, PAHs are deposited on meat during preservation by smoke curing (IARC 2010). PAHs are formed directly on charred meat (Jagerstad and Skog 2005). Cooked meat also contains non-PAH carcinogens, such as heterocyclic amines (Taylor et al. 2009).
PAH levels in cooked meat depend on several factors, including cooking method,
temperature and duration, doneness level, distance from the heat source, the amount of fat on the meat, and whether or how much fat dripped onto the heat source (IARC 2010, Kazerouni et al. 2001, Lijinsky 1991, Lijinsky and Shubik 1965, Morris and Seifter 1992, Ramesh et al. 2004). PAH levels in smoked meat depend on the specific smoking technique used (Gomaa et al. 1993, IARC 2010). It is estimated that, on average, an individual's dietary intake of PAHs in the US is less than 2 μg per kg of food (Agency for Toxic Substances and Disease Registry [ATSDR] 1995). The highest levels of dietary PAHs are found in charred meat (up to 10-20 μg per kg of food) (Castaño-Vinyals et al. 2004, Phillips 1999).
Assessment of Grilled and Smoked Meat Intake in Epidemiological Studies
19
questionnaires or other dietary questionnaires. To a more limited extent, nutritional
epidemiology studies may use biomarkers of exposure including DNA adducts and urinary metabolites to evaluate certain types of short-term dietary intake (IARC 2010, Ramesh et al. 2004, Roth et al. 2001, Strickland et al. 2002).
Study questionnaires can be used to reconstruct dietary PAH exposures through questions on intake patterns and cooking methods. Researchers can evaluate associations between health outcomes and specific PAH-containing foods (such as grilled and smoked meat), or can use a combination of questionnaire responses and databases of measured PAH concentrations in foods to construct a dietary PAH exposure index (Kazerouni et al. 2001, Sinha et al. 2005, Steck et al. 2007).
Regarding the latter approach, while PAH content in foods can be physically measured by assessing concentrations of several PAHs (Guillen 1994, Phillips 1999), this is difficult in
practice given that PAH profiles differ between foods and not all PAHs are easily measured (IARC 2010). Another option is to assess benzo[a]pyrene as a surrogate for all dietary PAHs (Kazerouni et al. 2001) (IARC 2010). Benzo[a]pyrene is both a strong carcinogen and a
20
Dietary questionnaires are hampered by a number of methodological limitations, including recall bias (Byers et al. 1983). Recall bias may be especially problematic when assessing dietary intake in the distant past. A number of studies have attempted to validate long-term dietary recall and reported correlation coefficients ranging from 0.13 to 0.59 (Bakkum et al. 1988, Byers et al. 1983, Jensen et al. 1984, Lindsted and Kuzma 1989, Maruti et al. 2005, Sobell et al. 1989, Wu et al. 1988) (Steck et al. 2007). The resultant misclassification can bias results towards or away from the null for a multi-level dietary variable (Steck et al. 2007). Previous research suggests that recall bias for dietary intake is generally not differential by cancer case-control status (Byers et al.1983, Freidenreich et al. 1992, Holmberg et al. 1996, Jensen et al. 1984, Steck et al. 2007). However, one breast cancer study found that recall bias patterns for reporting of meat intake differed by case-control status, though not in a consistent direction with respect to different meat variables (Holmberg et al. 1996).
In most epidemiological studies of meat consumption and breast cancer risk,
questionnaires focused only on recent meat intake, most commonly in the past year (Steck et al. 2007). Longer-term exposure may be more relevant to breast carcinogenesis (Clark et al. 1997). In addition, many dietary questionnaires do not (or do not adequately) evaluate cooking methods (Steck et al. 2007), which does not allow differentiation between overall meat intake and intake of grilled, smoked or barbecued meat specifically (Steck et al. 2007). Studies that do evaluate cooking techniques or doneness preferences differ in the method of assessing this information (Sinha et al. 2000, Steck et al. 2007, Zheng et al. 1998). Resulting variation in reporting dietary habits may impact effect estimates.
Associations with Breast Cancer
21
inconsistent results (Hermann et al. 2002, Missmer et al. 2002). All three meta-analyses published on this topic show elevated effect estimates for total or red meat intake (Boyd et al. 1993, 2003, Taylor et al. 2009). In contrast, a pooled analysis of 8 prospective cohort studies found null associations between breast cancer and total, red, or white meat intake (Missmer et al. 2002). Studies consistently report null or negative associations between breast cancer and white meat intake (Ambrosone et al. 1998, Delfino et al. 2000, Goodman et al. 1992, Missmer et al. 2002, Steck et al. 2007, van der Hel et al. 2004).
Most (Dai et al. 2002, Deitz et al. 2000, Krajinovic et al. 2001, Zheng et al. 1998, 1999, 2001, 2002), but not all (Delfino et al. 2000, Gertig et al. 1999), epidemiological studies do report positive associations between breast cancer and intake of well-done red meat both in general and among women with certain genetic variants. The two studies reporting null results for well-done red meat consumption also found null or negative associations between breast cancer and grilled, barbecued, or charred red meat intake over the course of one year (Delfino et al. 2000, Gertig et al. 1999). Few women reported eating red meat in the study by Delfino and colleagues (2000). Another investigation found null results for total (red and white) well-done or charred meat consumption (Holmes et al. 2003). A recent study from the Long Island Breast Cancer Study Project evaluating lifetime intake of grilled and smoked meat found positive associations with postmenopausal breast cancer, which were strongest among women with low fruit and vegetable intake (Steck et al. 2007). Elevated effect estimates were reported for intake of red, but not white, grilled and smoked meat (Steck et al. 2007).
PAH-DNA Adducts
Biomarkers of PAH Exposure
22
the body (e.g. in tissues, blood, or urine) (Godschalk et al. 2003). PAH biomarkers include blood-protein adducts (most commonly assessed in albumin or hemoglobin), urinary PAH metabolites (primarily 1-hydroxypyrene), and DNA adducts in blood or tissues (Bostrom et al. 2002, Castaño-Vinyals et al. 2004).
A 2003 review by Godschalk and colleagues concluded that, for PAHs, "the most promising biomarker seems to be the measurement of DNA adducts, since it takes into account individual differences in exposure, absorption and distribution of the chemical, its metabolism into DNA reactive forms, detoxification [of] reactive intermediates, as well as cell turnover and repair of DNA damage" (Godschalk et al. 2003). Since PAH-DNA adducts reflect DNA damage levels, they may be considered an indicator of effective biological PAH dose, rather than purely of exposure (Beyea et al. 2006, Binkova et al. 1995, Nesnow et al. 1993). PAH-DNA adducts have been found in human breast tissue and human breast milk (Bostrom et al. 2002, Gammon and Santella 2008, Moore et al. 1987, Ramesh et al. 2004, Rundle et al. 2000a, Santella 1999, Straif et al. 2005, Terry and Rohan 2002).
Due to high cell turnover rates (usually a few months to a few years), PAH-DNA adducts generally represent recent exposures in both target and surrogate (e.g. blood) cells (Gammon et al. 2002c, Shields et al. 1992). PAHs are lipophilic and can thus also "accumulate in adipose tissue to be released over time” (Rundle et al. 2000a). Hence, PAH adducts may potentially reflect exposures from the more distant past (Obana et al. 1981, Rundle et al. 2000a). Nevertheless, no known biomarkers represent long-term, historical PAH exposure or dose (Gammon et al. 2002c).
PAH Sources as Predictors of Adduct Levels
23
environmental PAHs, smoking, clinical or occupational PAH exposures, and intake of
charbroiled food (Beyea et al. 2006, Binkova et al. 1995, Castaño-Vinyals et al. 2004, Dor et al. 1999, Eder 1999, Hemminki et al. 1988, 1990, Kang et al. 1995, Lodovici et al. 1998, Mumford et al. 1993, Paleologo et al. 1992, Pavanello et al. 1999, Perera et al. 1988, 1992, Rojas et al. 1995, Rothman et al. 1990, 1993, Santella 1999, Santella et al. 1992, 1993, Tuominen et al. 2002, van Maanen et al. 1994).
Ambient environmental PAHs can affect PAH-DNA adduct levels more strongly than dietary sources, active smoking, or occupational exposures (Beyea et al. 2006, Eder 1999), despite the fact that the average person’s exposure to PAHs from air pollution is lower than from these other sources (Castaño-Vinyals et al. 2004). It is unclear why this is the case. However, this fact does illustrate that exposure level is not the only consideration with respect to biological relevance. Other factors including exposure route, actual internal dose, differences in
metabolism or DNA repair, and other components of the PAH mixture may be of vital
importance with respect to disease causation and other biologic effects (Bostrom et al. 2002). Not all studies have found associations between PAH sources and adduct levels
(Gammon et al. 2004a, Georgiadis et al. 2001, Perera et al. 1995, Scherer et al. 2000,
Shantakumar et al. 2005). This may be due to differing biological relevance of various PAH exposure sources, differences in PAH exposure levels between investigations, methodological limitations, small sample sizes, differing study population characteristics relevant to PAH
24
between PAH-related exposures and PAH-DNA adducts in many studies, individuals' adduct levels are known to vary significantly at similar exposure levels. This “suggests that individuals respond differently as a result of genetic susceptibility related to activation or detoxification of carcinogens, DNA repair capacity, and other lifestyle or dietary factors” (Santella 1999).
A 2004 review that pooled results from twelve studies found a statistically significant correlation between ambient environmental benzo[a]pyrene levels and mean PAH-DNA adduct levels in blood cells (Castaño-Vinyals et al. 2004). This review concluded that "PAH-DNA adducts can be usefully applied to assess environmental exposure to PAHs at a group level" (Castaño-Vinyals et al. 2004), and that biomarker measurement can discriminate between small differences (as low as 5 ng/m3) of monitored personal exposure to ambient benzo[a]pyrene (Castaño-Vinyals et al. 2004). In this pooled analysis, the correlation coefficient varied with respect to adduct measurement strategy. Specifically, the correlation between ambient
environmental benzo[a]pyrene and PAH-DNA adducts was stronger when using enzyme-linked immunosorbent assay (ELISA) (r = 0.99; P = 0.02) than when using 32P-postlabeling (r = 0.406; P = 0.21, overall combined correlation: r = 0.60; P = 0.04) (Castaño-Vinyals et al. 2004). It should be noted that ambient benzo[a]pyrene levels happened to be higher in studies using ELISA than in studies using 32P-postlabeling (Castaño-Vinyals et al. 2004).
Laboratory Assessment of PAH-DNA Adducts
25
(Perera and Rundle 2003). Researchers report correlations between PAH-DNA adduct levels in the blood and at least one group of target tissues - the lung and larynx (Bostrom et al. 2002, Szyfter et al. 1994, Wiencke et al. 1995). Other studies of correlations between blood and tissue adducts in the lung and skin have shown null or mixed results (Godschalk et al. 1998a,b, Poirier et al. 2000, Santella et al. 1999, Spivack et al. 1997, van Schooten et al. 1997). This association has not been evaluated for breast tissue.
A number of laboratory methods are available to assess PAH-DNA adduct levels, including 32P postlabeling of modified nucleotides, mass spectrometry, fluorescence
spectroscopy, immunohistochemistry, and competitive ELISA (Bostrom et al. 2002, Gammon et al. 2000c, Poirier et al. 2000). Several other methods of adduct detection exist, but are used rarely (never for breast cancer research) (Santella et al. 1999). These methods are not discussed further in this document.
ELISA measures specific PAH-DNA adducts by using targeted antibodies (Bostrom et al. 2002) including against "benzo[a]pyrene and structurally related PAH diol epoxide-DNA
adducts" (Gammon et al. 2002c). Like ELISA, fluorescence spectroscopy and mass
spectrometry also identify and quantify structurally specific DNA adducts (Bostrom et al. 2002, Casale et al. 2001, Rojas et al. 1994, 1998). In contrast, 32P-postlabeling measures general bulky aromatic or hydrophobic DNA adducts (Castaño-Vinyals et al. 2004, Phillips and Arlt 2007). Thus, this method is not specific to PAH-DNA adducts. For example, it also measures adducts from heterocyclic amines (Castaño-Vinyals et al. 2004, Poirier and Weston 1996). However, postlabeling is a more sensitive method than ELISA, fluorescence spectroscopy, or mass spectrometry (Bostrom et al. 2002, IARC 2010).
26
tissue, such as breast tissue. Immunohistochemical assays are inexpensive and have good sensitivity and specificity for PAH-DNA adducts (IARC 2010, Romano et al. 1999, Rundle et al. 2000a, Santella 1999). Both ELISA and immunohistochemistry require “the production of antibodies, prior knowledge of the adduct being measured and relatively large amounts of DNA for sensitivity” (IARC 2010) (Santella et al. 1999). ELISA is generally more sensitive than immunohistochemistry (Santella et al. 1999). Of all available methods, ELISA may be “most suited to large-scale epidemiology studies or clinical evaluations because it is a rapid and low-cost procedure not requiring radiolabeled compounds” (Casale et al. 2001).
PAH-DNA adduct assays do not measure all forms of PAH-induced DNA damage (Casale et al. 2001). For example, the Long Island Breast Cancer Study Project measured PAH-DNA adducts using an antibody against PAH diol epoxide adducts forming at the N2 position of guanine (Gammon et al. 2002c, Mordukhovich et al. 2009). This assay does not recognize PAH quinone-DNA adducts, abasic sites left by depurinating adducts, oxidative lesions, or diol epoxide adducts at other positions. Assays which detect all bulky adducts will still fail to detect abasic sites and oxidative lesions.
Population-based studies of PAH-DNA adducts and breast cancer assessed adducts in circulating mononuclear cells using ELISA (Gammon et al. 2002c, 2004a) or in leukocytes using
32
27
types of benign breast disease (Rundle et al. 2000a). These hospital-based studies detected adducts using 32P-postlabeling (Li et al. 1996, 2002, Perera et al. 1995) or an
immunohistochemical assay (Rundle et al. 2000a). Associations with Breast Cancer
PAH-related DNA adducts are consistently related to breast cancer both in small hospital-based case-control investigations (Li et al. 1996, 2002, Perera et al. 1995, Rundle et al. 2000a) and in larger population-based case-control studies (Gammon et al. 2002c, 2004a). For example, Rundle and colleagues (2000) found that breast tumor tissue was more than twice as likely to contain elevated PAH-DNA adduct levels as breast tissue from women with benign breast disease (odds ratio [OR] = 2.56; 95% confidence interval [CI]: 1.05-6.24). Results were of borderline significance for adducts in adjacent, non-tumor tissue (OR = 1.97, 95% CI: 0.94 - 4.17) (Rundle et al. 2000a). Similar or greater effects were observed in the other hospital-based studies (Li et al. 1996, 2002, Perera et al. 1995).
PAH-28
DNA adducts on breast cancer risk, (2) greater importance of individual susceptibility to PAHs than of PAH exposure level, or (3) a potentially non-linear dose-response relationship between adducts and breast cancer (Dr. Jan Beyea, personal communication 2009, Gammon et al. 2004a). A recent Italian nested case-control study (292 cases, 292 controls) failed to find an association between bulky adducts in leukocytes and breast cancer risk (Saieva et al. 2011).
TRAFFIC AND AIR POLLUTION
Sources of Exposure to Ambient Environmental PAH
Ambient PAHs, both indoor and outdoor, are emitted from anthropogenic sources including vehicular traffic, industrial processes, power generation, heating, incinerators, wood and coal stoves, cooking, candles, incense, tobacco smoke, space heaters, and leaf and garbage burning (Besaratinia et al. 2002, Boffetta 1997, Bostrom et al. 2002, Friedman and Calabrese 1977, IARC 2010, Lioy and Greenberg 1990, Mumtaz et al. 1996, Narvaez et al. 2008, Ramesh et al. 2004, Wallace 2000). In addition to trucks and cars, mobile sources of PAH emissions include "aircraft, shipping, railways...off-road vehicles, and machinery" (Ravindra et al. 2008). Natural PAH sources such as forest fires and volcanoes make a small contribution to ambient PAH levels at ground level, which is heavily outweighed by anthropogenic emissions (Bostrom et al. 2002). Because of the importance of anthropogenic PAH emissions relative to PAHs from natural sources, PAH levels in water sediments are strongly correlated with the historical onset of fossil fuel use (Bostrom et al. 2002).
29
Dunbar et al. 2001, IARC 1989), though wood smoke is the largest source of ambient PAHs in the US overall (Bostrom et al. 2002). PAHs emitted from wood burning show relatively little carcinogenic activity, however, in contrast to PAHs in vehicular traffic emissions (Boffetta et al. 1997, Lewtas 1993, Lewtas et al. 1992, Lewtas and Gallagher 1990). Wood burning is also more likely to occur away from areas of high population density (Shen et al. 2011). PAHs, primarily bound to course particles (> 10 μm in diameter) (Bostrom et al. 2002), are also found in road dust originating from brake linings, tires, and asphalt (Bostrom et al. 2002, Ravindra et al. 2008).
Outdoor air pollution infiltrates indoors effectively (Sioutas et al. 2005). Studies report that outdoor air pollution is the major source of indoor residential PAHs (Beyea et al. 2006, Dubowsky et al. 1999, Long et al. 2001, Naumova et al. 2002, Ohura et al. 2004).
Ambient PAH Levels and Properties
Ambient PAH levels vary significantly across regions (IARC 2010). Concentrations tend to be high in large cities (IARC 2010). Measured ambient benzo[a]pyrene levels range from 0.01 to 100 ng/m3, and measured overall ambient PAH levels range from less than 5 ng/m3 to hundreds of ng/m3 (Castaño-Vinyals et al. 2004, Georgiadis and Kyrtopoulos 1999; IARC 2010, Vyskocil et al. 1997). A 2010 review reports typical levels of a few ng/m3 for ambient
benzo[a]pyrene and a typical range of 1 to 30 ng/m3 for total ambient PAHs, excluding
naphthalene (IARC 2010). PAH air concentrations are substantially higher in urban than in more rural areas (Gigliotti et al. 2005, Morris and Seifter 1992).
30
clearance from the atmosphere, less atmospheric mixing in the winter, and seasonal differences in heating emissions (Beyea et al. 2008, Bostrom et al. 2002, Castaño-Vinyals et al. 2004, Greenberg et al. 1985, Han and Naeher 2006, Moller et al. 1996, Srogi 2007, Topinka et al. 2000).
Ambient PAH levels have decreased significantly over the past several decades due to the widespread introduction of catalytic converters in gasoline vehicles (Bostrom et al. 2002). The lowered PAH emissions per vehicle were in part counteracted by increased vehicle use during the same time period (Beyea et al. 2008). For example, a 2008 report described an approximately "15-fold decline in benzo[a]pyrene and other PAH cruise emission factors for the US vehicle fleet following introduction of automotive pollution controls," whereas "overall vehicle miles traveled in the US increased by about a factor of 2.7 between 1970 and 2005" (Beyea et al. 2008) (Davis and Diegel 2007). Despite the historical decline in US traffic PAH emissions, it is
important to evaluate associations between traffic PAHs and breast cancer for the following reasons: (1) many US women are still exposed to high levels of traffic PAHs, such as women living near highways, bus depots, and busy intersections, and (2) overall vehicular PAH emission levels remain high in other countries.
PAHs can be found in both gaseous and particulate phases, and are therefore considered semivolatile organic compounds (Zielinska et al. 2004). Larger PAH molecules, such as benzo[a]pyrene, are usually particle-associated rather than in the gas phase and are generally much more carcinogenic than lighter-weight PAHs (Beyea et al. 2006, Bostrom et al. 2002, IARC 2010, Zielinska et al. 2004). Airborne PAHs from gasoline vehicle emissions are
31
humidity and temperature), the properties of specific PAHs in ambient mixtures, and the chemical composition of aerosols (Bostrom et al. 2002, Goss and Schwarzenbach 1998). Ambient gas-phase PAHs “generally have durations of less than a day, whereas
particle-associated PAHs may persist for weeks and undergo long-range atmospheric transport” (IARC 2010) (Arey and Atkinson 2003).
It is reported that 90-95% of particle-associated PAHs are bound to particles less than 3.3 μm in diameter (Bonner et al. 2005, Ravindra et al. 2001). A 1998 study reported that almost all PAHs from gasoline vehicle emissions are bound to ultrafine particles (< 0.12 μm in diameter) (Bostrom et al. 2002, Miguel et al. 1998). Relative to larger particles, small particles are able to penetrate more deeply into the respiratory tract, are absorbed into the circulation more quickly, and induce systemic oxidative stress and inflammation more efficiently (Li et al. 2003, Miller 1973).
Atmospheric Fate of Ambient PAH
32
Ambient PAH Measurement, Monitoring and Exposure Assessment
Measurement of ambient benzo[a]pyrene and other PAHs in both environmental and occupational settings involves collection on specialized filters, extraction with organic solvents, and analysis through either gas chromotography/mass spectrometry or high performance liquid chromatography (Castaño-Vinyals et al. 2004, IARC 2010, Lewtas et al. 1997, Mumford et al. 1993, Peluso et al. 1998, Poirier et al. 1998). Since the 1970s, occupational studies have generally used personal rather than stationary PAH monitors (IARC 2010).
Environmental monitoring and measurement methods are not well developed for PAHs (Bostrom et al. 2002). Monitoring of specific PAHs “often requires extensive separation
schemes because of their lack of distinct functional groups, the existence of numerous structural isomers and the need to analyze PAHs in diverse environmental matrices” (IARC 2010). Unlike US EPA criteria pollutants such as carbon monoxide or ozone, environmental ambient PAHs are monitored relatively infrequently and ambient PAH levels are thus not well quantified (Bostrom et al. 2002).
In epidemiologic research, ambient PAH exposure assessment methods include the use of personal monitors, measurement of PAH biomarkers of exposure or dose, and ascertainment of PAH-related exposures, such as traffic exposure variables for research in the general population, or coal-tar pitch volatiles in occupational studies, which may be used as surrogates of ambient PAH exposure level (Gunier et al. 2006, IARC 2010). However, personal monitors are
33
More than 100 PAHs have been isolated from air. Studies that measure ambient PAHs directly usually report concentrations for a small number of PAHs, thereby potentially excluding PAHs relevant to health effects of interest (Bostrom et al. 2002, Castaño-Vinyals et al. 2004, IARC 2010). Furthermore, the collection of measured PAHs differs across investigations (Bostrom et al. 2002, Castaño-Vinyals et al. 2004). This is in large part due to the difficulty of finding an index PAH, since PAH profile varies with respect to both the specific exposure source and the temperature of combustion (Bostrom et al. 2002, Castaño-Vinyals et al. 2004, IARC 2010).
Most often, only benzo[a]pyrene is measured as a surrogate for all ambient PAHs (Bostrom et al. 2002, Castaño-Vinyals et al. 2004). On the one hand, "the presence in the environment of other PAHs, some of which are carcinogenic, does not allow an accurate estimation of the risk linked to a PAH mixture on the basis of [benzo[a]pyrene] concentration alone" (Castaño-Vinyals et al. 2004). Similarly, in a real-life setting, “most if not all
exposures...to PAHs involve complex organic mixtures” and “metabolism and bioactivation of individual PAH compounds are influenced by the presence of other PAHs” (Ramesh et al. 2004) (Goldstein 2001, Warshawsky 1999). Traffic emissions include significant concentrations of benzo[g,h,i]perylene, pyrene, fluoranthene, phenanthrene and other PAHs (Bostrom et al. 2002). Monitoring only benzo[a]pyrene inevitably leads to some exposure misclassification (Bostrom et al. 2002, Castaño-Vinyals et al. 2004).
34
2002). Furthermore, the Long Island Breast Cancer Study Project reports that soil
benzo[a]pyrene levels are strongly correlated with other high molecular weight soil PAHs, which are generally more carcinogenic than lower weight PAH molecules (Beyea et al. 2006, Bostrom et al. 2002). For example, Pearson correlation coefficients were greater than 0.9 for
benzo[b]fluoranthene, benzo[ghi]perylene, benzo[k]flouranthene, dibenz[a,h]anthracene and indeno[1,2,3-cd]pyrene, and were greater than 0.8 for acenaphthylene, anthracene,
benz[a]anthracene, chrysene and fluorine (Beyea et al. 2006). With respect to historical
reconstruction of traffic emissions exposure, benzo[a]pyrene is the only PAH for which historical data is consistently available (Beyea et al. 2008). A 2008 report indicated that the pattern of historical decline of ambient PAH levels was similar between benzo[a]pyrene and other traffic-related PAHs, including benzo[e]pyrene, benzo[ghi]perylene, chrysene, coronene, and perylene (Beyea et al. 2008).
Cancer Risk Assessment for Ambient PAH
Cancer risk assessment with respect to ambient PAH exposure is difficult given the fact that PAHs are rarely monitored, are almost always components of complex mixtures including varied carcinogenic PAHs and non-PAH carcinogens, and are mainly bound to particles, which can exert carcinogenic effects independent of PAH content (Bostrom et al. 2002, Valavanidis et al. 2008). Risk assessment for PAHs with respect to various disease endpoints is largely based on animal studies in which one surrogate PAH is examined individually on a short-term basis, and from studies of high levels of complex occupational exposures, such as coal-tar pitch volatiles (ATSDR 1995).
35
cancer risk in relation to a rise in ambient benzo[a]pyrene levels (Bostrom et al. 2002, CA EPA Air Resources Board [CARB 1994], WHO 2000). For example, the WHO estimates "the lung cancer risk from a lifetime exposure to PAHs in ambient air at 8.7 x 10⁻⁵ per ng/m3
benzo[a]pyrene" (Bostrom et al. 2002) (WHO 2000). Similar risk slopes have not been estimated for breast or other cancers.
Regulations for Ambient PAH and Related Pollutants
The US EPA does not regulate ambient environmental PAH levels, though it does set standards for several PAHs in drinking water (US EPA 2009). The US Occupational Health and Safety Administration (OSHA) limits occupational exposure to coal tar pitch volatiles, a PAH-heavy mixture (Han and Naeher 2006). Some other countries also limit occupational exposures to coal-tar pitch volatiles or particulate PAHs, but none limit ambient environmental PAH levels (IARC 2010).
The US EPA regulates levels of ambient particulate matter (PM; US EPA 2011b), which often contains adsorbed PAH molecules (conversely, ambient heavy mass PAHs are mostly physically associated with particles) (Bostrom et al. 2002). The EPA also regulates ambient levels of the traffic-associated pollutants carbon monoxide, ozone, nitrogen oxides and sulfur dioxide (US EPA 2011b), as well as tailpipe exhaust emissions of PM, carbon monoxide, nitrogen oxides, non-methane organic gases, and volatile organic compounds (VOCs)
36 Vehicular Traffic Composition and Concentrations
Traffic exhaust is a highly heterogeneous mixture of gases and particles (IARC 1989). In addition to carbon dioxide and water, vehicles emit many by-products including carbon
monoxide, nitrogen oxides, sulfur dioxide, PM, and volatile organic compounds, including non-methane hydrocarbons (Boothe and Shendell 2008, IARC 1989, Zielinska et al, 2001).
Components and derivatives of some of the latter pollutants include benzene, 1,3-butadiene, formaldehyde, ozone, acetaldehyde, polycyclic organic matter and benzo[a]pyrene (Boothe and Shendell 2008, Han and Naeher 2006, IARC 1989, Nielsen et al. 1983, Sax et al. 2006, Wu et al. 2006). Particles in vehicular exhaust often contain elemental carbon, metals, and adsorbed organic materials including “polycyclic aromatic hydrocarbons, heterocyclic compounds, phenols, nitroarenes, and other oxygen- and nitrogen-containing derivatives” (IARC 1989) (Boothe and Shendell 2008, Oberdorster 2001). A 2008 study evaluating US road tunnel data found that vehicular emissions of PAHs, VOCs, carbon monoxide, and particulate organic carbon have declined markedly over the past several decades (Beyea et al. 2008).
Traffic exposure is widespread (Han and Naeher 2006) and is usually the main source of air pollution in urban areas (Maitre et al. 2002). Traffic emissions vary in persistence, "physical and chemical properties, composition, and toxicity of fuel mixtures" across geographic and demographic regions (Boothe and Shendell 2008) (Verma and des Tombe 2002). This is due to a number of factors including average vehicle age, type, and maintenance status, fuel composition, presence of emissions control technologies such as catalytic converters, traffic and driving patterns, governmental regulations, and roadway conditions, "designs, grades, and distributions" (Boothe and Shendell 2008) (IARC 1989).
37
surface properties (IARC 1989). Organic compound emissions from gasoline or diesel sources differ mainly in quantity. For example, diesel engines emit greater levels of PM and nitroarenes relative to gasoline vehicles with catalytic converters, given comparable power output (2-40 times and 20-30 times higher, respectively) (IARC 1989). For PAHs in particular, emission levels are similar between diesel vehicles and gasoline vehicles without catalytic converters given similar power output, but are greatly reduced (by more than 10 times) in gasoline vehicles with catalytic converters (IARC 1989).
Measured ambient vehicular exhaust levels are highest near roads, with concentrations dropping to background levels within approximately 150-300 meters (Boothe and Shendell 2008) (Gilbert et al. 2005, Zhu et al. 2002, 2006). This decline is due to "evaporation of volatile constituents, atmospheric dispersion, and coagulation" (Boothe and Shendell 2008) (Zhu et al. 2002).
Influences on Traffic PAH Emissions
Traffic PAH emission levels differ based on driving conditions and traffic patterns
(Boothe and Shendell 2008, IARC 1989). Vehicular PAH emissions are related to driving speed, with greater emissions at low and high speeds (Begeman and Colucci 1970, Kotin et al. 1954, Westerholm et al. 1992), and are higher during transient rather than steady-state driving cycles (Kado et al. 2005) (Shen et al. 2011). Emissions are elevated at traffic intersections due to increased acceleration and deceleration at these sites (Beyea et al. 2006, 2008, Sculley 1989, Sheu et al. 1996a,b), and are also greater under cold-engine rather than warm-engine conditions, discussed in more detail below (Beyea et al. 2006, 2008, Bostrom et al. 2002, Ravindra et al. 2008, Shen et al. 2011).
38
emissions differ with respect to fuel type (diesel versus gasoline, as described below) (Bostrom et al. 2002, Shen et al. 2011). Also, both diesel and gasoline vehicle PAH emission levels are positively associated with increased concentrations of PAHs in the respective fuels (Bostrom et al. 2002, Shen et al. 2011, Ravindra et al. 2008). Vehicular PAH emission levels are decreased greatly by the presence of a catalytic converter (Beyea et al. 2006, 2008, Bostrom et al. 2002, Shen et al. 2011). Emissions are associated with engine condition and maintenance as well increased mileage (Ravindra et al. 2008). PAH emission levels also vary with respect to "vehicle age and load, lubricant oil (Ravindra et al. 2008)" (Shen et al. 2011) and outdoor ambient
temperatures (Bostrom et al. 2002, Shen et al. 2011). Information regarding variation in PAH emission levels is derived from tunnel studies, road-side measurements, and dynamometer test beds (Beyea et al. 2008, Ravindra et al. 2008, Shen et al. 2011).