THE EFFECT OF TUBERCULOSIS TREATMENT AT THE TIME OF COMBINATION ANTIRETROVIRAL THERAPY (CART) INITIATION ON
RESPONSE TO CART AMONG HIV-INFECTED INDIVIDUALS
Heidi Marie Soeters
A dissertation submitted to the faculty of the University of North Carolina at Chapel Hill in partial fulfillment of the requirements of the degree of Doctor of Philosophy in the Department
of Epidemiology.
Chapel Hill 2013
ABSTRACT
HEIDI MARIE SOETERS: The effect of tuberculosis treatment at the time of combination antiretroviral therapy (cART) initiation on response to cART among HIV-infected individuals
(Under the direction of Annelies Van Rie)
Given the World Health Organization’s 2010 recommendation that all HIV-infected persons with tuberculosis (TB) be initiated on combination antiretroviral therapy (cART), regardless of CD4 count, many individuals will be initiating cART while concurrently on TB treatment. Co-treated individuals may experience a differential response to cART due to drug-drug interactions, increased risk of drug-drug toxicity, immune reconstitution inflammatory syndrome, and potentially lower adherence due to the high pill burden. The effect of TB treatment on a patient’s response to cART is not yet clear and requires careful evaluation.
Systematic reviews and meta-analytic methods examined the effect of TB treatment at the time of cART initiation on mortality and virologic and CD4 count response to cART among adults. A secondary analysis of South African study data assessed the effect of TB treatment on virologic and immunologic response to cART among children.
treatment ranged from -10 to 60 cells/µL (median 27) by 6 months and -10 to 29 (median 6) by 11-12 months.
Among 199 children initiating cART (median age 2.1 years), TB treatment was not associated with time to virologic suppression (adjusted hazard ratio [aHR] 1.36 [0.94-1.96]) or virologic rebound (23% vs. 24%, aHR 1.53 [0.71-3.30]). Those receiving TB treatment had lower median CD4 cell percentage (CD4%) until 12 months, but similar median increases in CD4% as children not receiving TB treatment over 24 months of follow-up.
ACKNOWLEDGEMENTS
TABLE OF CONTENTS
LIST OF TABLES ... ix
LIST OF FIGURES ... xi
LIST OF ABBREVIATIONS ... xii
Chapter I. SPECIFIC AIMS ...1
Introduction ...1
Specific Aim 1...2
Specific Aim 2...2
Specific Aim 3...3
II. BACKGROUND AND SIGNIFICANCE ...4
HIV Infection and Combination Antiretroviral Therapy ...4
HIV Infection and cART in Children ...6
TB Disease ...8
Active TB Disease in Children ...11
HIV/TB Epidemiology ...12
HIV/TB Interactions...12
Challenges with HIV/TB Co-treatment ...13
Timing of HIV/TB Co-treatment ...15
HIV/TB Services Integration ...17
Effect of TB Treatment at cART Initiation on Subsequent Mortality in
Adults ...21
Effect of TB Treatment on Virologic Response to cART in Adults ...23
Effect of TB Treatment on Immunologic Response to cART in Adults...24
Effect of TB Treatment on Response to cART in Children ...25
Summary and Rationale ...27
III. RESEARCH METHODS ...31
Study Design and Manuscripts...31
Methods for Specific Aims 1 and 2...31
Methods for Specific Aim 3 ...34
IV. THE EFFECT OF TUBERCULOSIS TREATMENT AT COMBINATION ANTIRETROVIRAL THERAPY INITIATION ON SUBSEQUENT MORTALITY: A SYSTEMATIC REVIEW AND META-ANALYSIS ...41
Introduction ...41
Methods ...42
Results ...45
Discussion ...50
V. THE EFFECT OF TUBERCULOSIS TREATMENT ON VIROLOGIC AND CD4 COUNT RESPONSE TO COMBINATION ANTIRETROVIRAL THERAPY: A SYSTEMATIC REVIEW ...59
Introduction ...59
Methods ...60
Results ...63
Discussion ...68
Introduction ...80
Methods ...81
Results ...86
Discussion ...90
VII. DISCUSSION ...104
Summary of Findings ...104
Contributions of Findings ...106
Strengths and Limitations ...111
Recent Research ...117
Future Research Directions ...119
APPENDIX: SUPPLEMENTAL MATERIAL ...121
LIST OF TABLES
Table
1. Characteristics of 22 studies reporting the effect of TB treatment on
mortality after cART initiation among HIV-infected adults ...54
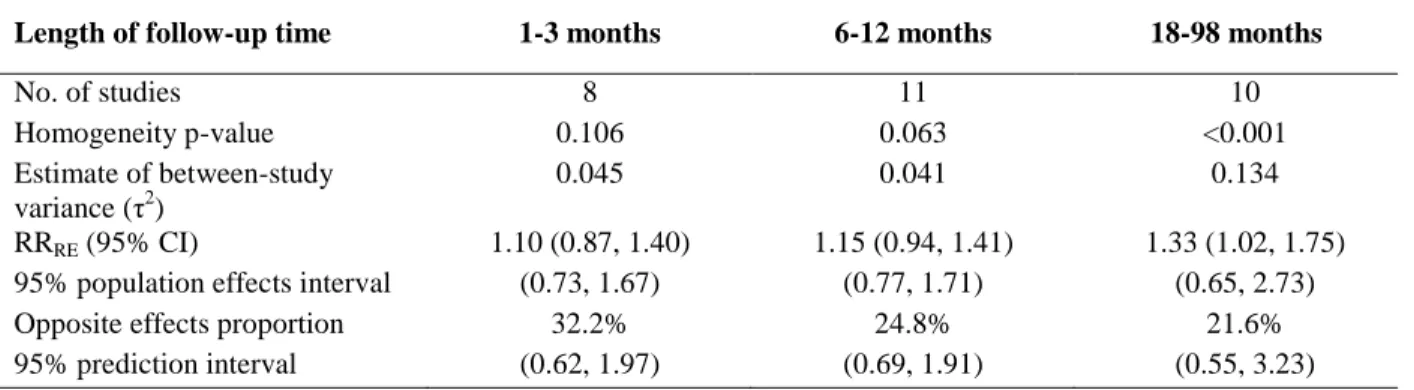
2. Meta-analysis results for the effect of TB treatment on mortality, by length of follow-up time ...56
3. Characteristics of 25 studies reporting the effect of TB treatment on virologic and/or CD4 count response to cART among HIV-infected adults ...71
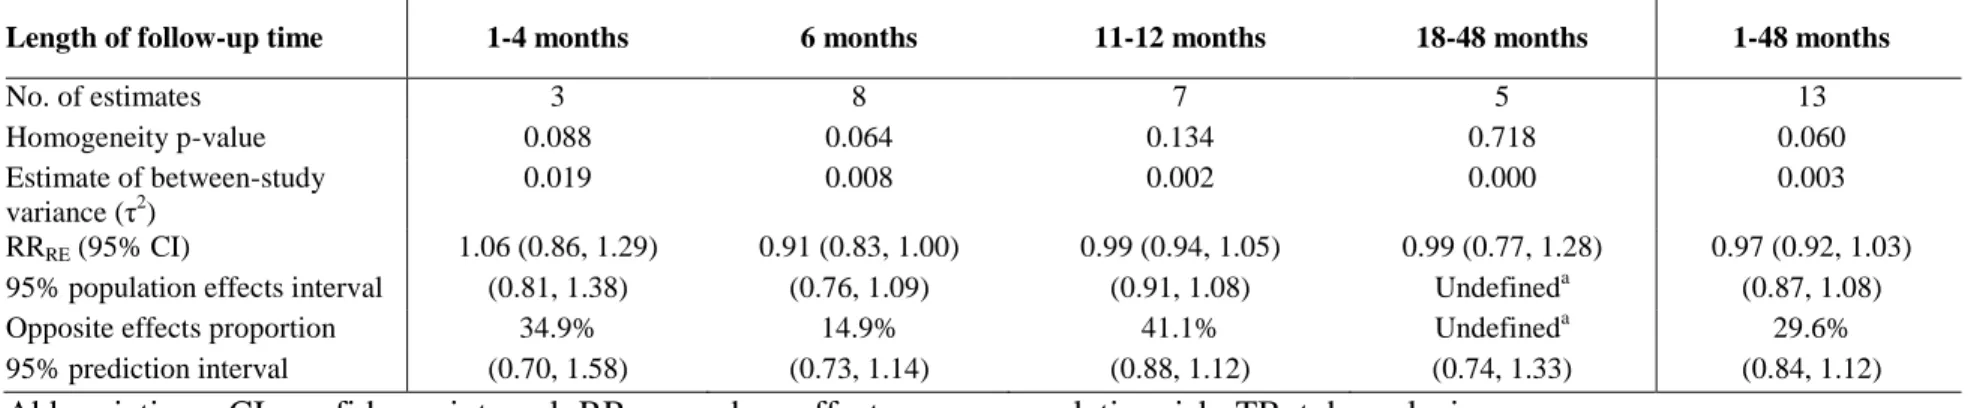
4. Meta-analysis results for the effect of TB treatment on virologic suppression after cART initiation, by length of follow-up time ...76
5. Types of outcome measures used by 21 studies to quantify CD4 count response to cART ...77
6. Baseline characteristics of 199 children who initiated cART and had at least one follow-up HIV and/or CD4 cell percentage, stratified by TB treatment status ...94
7. Virologic and immunologic response outcomes, stratified by TB treatment status ...96
8. The effect of TB treatment on virologic and immunologic response outcomes, stratified by cART regimen ...98
9. The effect of TB treatment on virologic and immunologic response outcomes, stratified by timing of cART initiation ...100
10. cART regimens utilized in each study ...121
11. Types of TB included, by study ...123
12. Timing of TB treatment in relation to cART initiation, by study ...124
13. Median (IQR) baseline CD4 cell count by TB treatment status, if available ...125
14. Meta-regression results for the effect of TB treatment on mortality ...126
15. Sensitivity analysis of asymmetrical confidence intervals ...130
18. Methods for handling loss-to-follow-up and mortality utilized by each
study ...134 19. Quantification of virologic response to cART, stratified by TB
treatment status, as reported by 17 studies ...136 20. Meta-regression results for the effect of TB treatment on virologic
suppression after cART initiation ...139 21. Quantification of CD4 count response to cART, stratified by TB
treatment status, as reported by 21 studies ...142 22. Baseline characteristics of all 246 children who initiated cART ...146 23. Baseline characteristics of children of initiated efavirenz- vs.
lopinavir/ritonavir-based cART ...148 24. Virologic response outcomes, stratified by TB treatment status, with a
virologic suppression cut point of HIV RNA <400 copies/mL ...150 25. The effect of TB treatment on virologic response outcomes, stratified
by cART regimen, with a virologic suppression cut point of HIV
RNA <400 copies/mL ...151 26. The effect of TB treatment on virologic response outcomes, stratified
by timing of cART initiation, with a virologic suppression cut point of
LIST OF FIGURES
Figure
1. Directed acyclic graph ...40
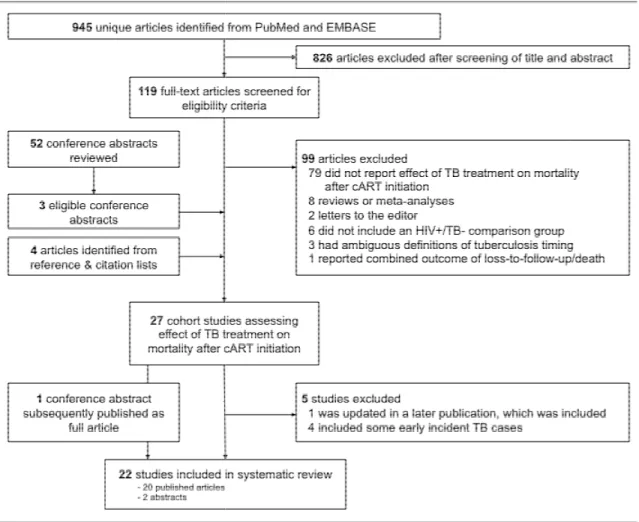
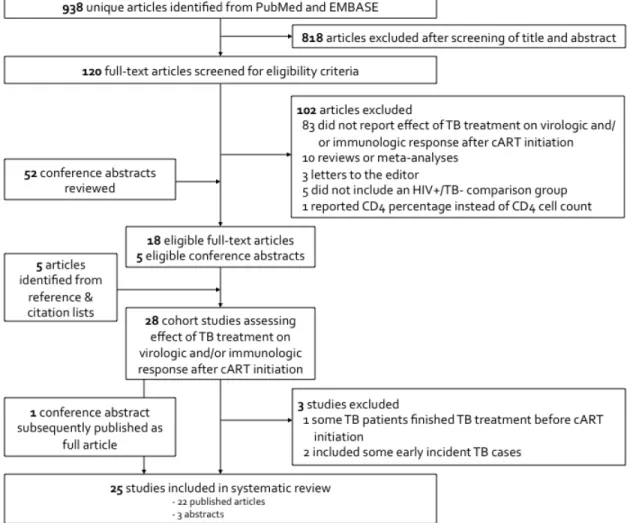
2. Identification and selection of eligible studies ...57
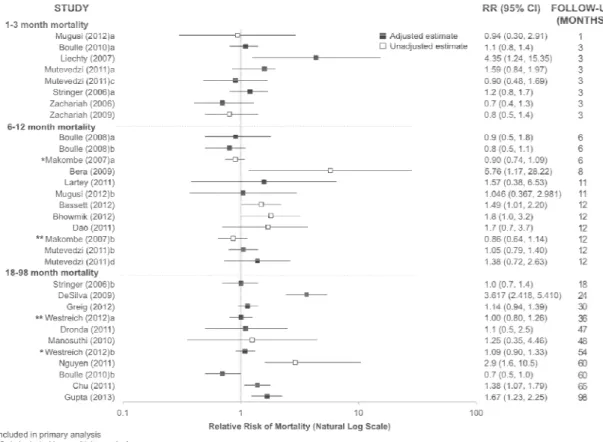
3. Forest plot of mortality relative risks reported by 22 studies ...58
4. Identification and selection of eligible studies ...78
5. Relative risk of virologic suppression in those receiving vs. not receiving TB treatment at cART initiation by length of follow-up time, as reported by 15 studies ...79
6. Kaplan-Meier graphs of virologic response, stratified by TB treatment status at cART initiation ...102
7. Graphs of immunologic response, stratified by TB treatment status at cART initiation ...103
8. Funnel plots of mortality relative risks and inverse-variance weights ...129
9. Forest plot of cART regimen-specific relative risks of virologic suppression ...140
10. Funnel plot of overall relative risk of virologic suppression ...141
LIST OF ABBREVIATIONS
3TC Lamivudine
aHR Adjusted Hazard Ratio
AIDS Acquired Immune Deficiency Syndrome aOR Adjusted Odds Ratio
ART Antiretroviral Therapy ARV Antiretroviral
BCG Bacille-Calmette-Guérin vaccine BMI Body Mass Index
CAMELIA Cambodian Early versus Late Introduction of Antiretrovirals study cART Combination Antiretroviral Therapy
CD4% CD4 Cell Percentage CI Confidence Interval
CROI Conference on Retroviruses and Opportunistic Infections
d4T Stavudine
DAG Directed Acyclic Graph DOT Directly Observed Therapy EFV Efavirenz
EFV/TB+ Receiving efavirenz-based cART and TB treatment EFV/TB- Receiving efavirenz-based cART and no TB treatment EMBASE Excerpta Medica Database
HIV Human Immunodeficiency Virus
IAS International AIDS Society IGRA Interferon-Gamma Release Assay IPT Isoniazid Preventive Therapy IQR Interquartile Range
IRIS Immune Reconstitution Inflammatory Syndrome IRR Incidence Rate Ratio
IUATLD International Union Against Tuberculosis and Lung Disease lnLO Natural Log of the Lower Limit
lnRR Natural Log of the Point Estimate lnUP Natural Log of the Upper Limit LPV/r Lopinavir/Ritonavir
LPV/TB+ Receiving lopinavir/ritonavir-based cART and TB treatment LPV/TB- Receiving lopinavir/ritonavir-based cART and no TB treatment LTBI Latent Tuberculosis Infection
LTFU Lost-to-follow-up MDR Multidrug Resistant
MTB Mycobacterium tuberculosis
NA Not Available
NNRTI Non-nucleside Reverse Transcriptase Inhibitor NRTI Nucleos(t)ide Reverse Transcriptase Inhibitors
NR Not Reported
NS Not Specific
OR Odds Ratio
P Prospective Study
PI Protease Inhibitor PLWH People living with HIV
PRISMA Preferred Reporting Items for Systematic Reviews and Meta-Analyses R Retrospective Study
REDCap Research Electronic Data Capture
RIF Rifampin
RNA Ribonucleic Acid
RR Relative Risk or Risk Ratio RRRE Random effects relative risk
SAPiT South African Starting Antiretroviral Therapy at Three Points in Tuberculosis study
STRIDE The AIDS Clinical Trials Group 5221 study TB Active tuberculosis
TB+ Receiving TB treatment at cART initiation TB- Not receiving TB treatment at cART initiation THINK TB HIV IRIS and Nutrition in Kids cohort study WHO World Health Organization
CHAPTER I
SPECIFIC AIMS
Introduction
Active tuberculosis (TB) threatens the health of people living with human
immunodeficiency virus (HIV). Globally in 2011, 13% of incident TB cases were co-infected with HIV and an estimated 0.4 million TB deaths occurred among people living with HIV (PLWH) [1]. Given the World Health Organization (WHO) 2010 recommendation that all PLWH with TB be initiated on combination antiretroviral therapy (cART), regardless of CD4 count [2], and the goal of 100% cART coverage of co-infected patients by 2015 [3], many individuals are initiating cART while concurrently on TB therapy. PLWH who are also being treated for TB may experience a differential response to cART due to drug-drug interactions [4, 5], an increased risk of drug toxicity [4, 5], immune reconstitution inflammatory syndrome (IRIS) [6], and the potential for lower adherence due to the high pill burden [5]. The effect of TB treatment and its associated potential challenges and complications regarding a patient’s
response to cART require careful evaluation.
Additionally, data from the TB HIV IRIS and Nutrition in Kids (THINK) cohort study was used to examine the impact of TB treatment on virologic and immunologic response to cART among 200 HIV-infected children aged 0 to 8 years in Soweto, South Africa. These investigations have a direct and important relevance to the care and management of HIV-infected individuals receiving TB treatment at cART initiation. The following aims were addressed:
Specific Aim 1
To conduct a systematic review and meta-analysis of the effect of receiving TB treatment at
cART initiation on short- and long-term mortality among HIV-infected adults.
Hypothesis: HIV-infected adults receiving TB treatment at cART initiation will have increased mortality in the first 3 months of therapy as compared to individuals not receiving TB treatment. However, they will experience similar long-term survival, once their TB treatment has
concluded.
Specific Aim 2
To conduct a systematic review and meta-analysis of the effect of receiving TB treatment at
cART initiation on virologic and CD4 count response to cART among HIV-infected adults.
Specific Aim 3
To evaluate the effect of TB treatment on virologic and immunologic response to cART
among antiretroviral therapy (ART)-naïve children ages 0 to 8 years.
CHAPTER II
BACKGROUND AND SIGNIFICANCE
HIV Infection and Combination Antiretroviral Therapy
In 2011, a total of 34 million people were living with human immunodeficiency virus (HIV) worldwide, of which 3.3 million were children under the age of 15 years. Included in this total were 2.5 million new HIV infections, 330,000 occurring in children [7].
Dramatic reductions in morbidity and mortality have been observed since the introduction of combination antiretroviral therapy (cART) in 1996. At the end of 2012, 9.7 million individuals in low- and middle-income countries were receiving cART, of which 630,000 were children [8]. Most antiretrovirals (ARVs) are grouped into 3 main classes according to their targeted phase of the retrovirus life cycle: nucleos(t)ide reverse transcriptase inhibitors (NRTIs), non-nucleoside reverse transcriptase inhibitors (NNRTIs), and protease inhibitors (PIs).
Additionally, a number of other ARVs with novel mechanisms of actions have been approved or are under development. Currently, most first-line cART regimens consist of either a NNRTI (efavirenz or nevirapine) or a PI, plus two NRTIs. There is much emphasis on fixed-dose combinations and once-daily dosing for antiretroviral regimens, which help to improve
start cART once their CD4 cell count drops below 500 cells/µL, with priority given to those with severe or advanced clinical disease (WHO stage 3 or 4) and those with a CD4 count ≤350
cells/µL [10].
An individual’s first six months on cART are critical. Most patients experience a rise in CD4 counts as their immune system recovers and HIV ribonucleic acid (RNA) viral load decreases as the ARVs inhibit viral replication. Though cART dramatically decreases overall mortality, death rates are highest in the first three months after cART initiation [11-13],
particularly among those with severe immunosuppression, wasting or malnutrition, or very low hemoglobin levels [12, 14-16].
Some individuals, particularly those with severe immunodeficiency at cART initiation, do not initially improve on cART or may actually exhibit clinical deterioration at first. One complication that can occur is immune reconstitution inflammatory syndrome (IRIS), which is the exacerbation of a previously subclinical coexisting infection (such as tuberculosis) that occurs as a patient with advanced disease recovers immune function. Similarly, a latent or subclinical infection may become unmasked after cART initiation as the immune system recovers. In either case, patients first get worse before they begin a positive response to cART after a few months. In South Africa, IRIS occurs in around one quarter of patients initiating cART and accounts for one quarter of deaths in the first six months of therapy [17]. Another potential complication during early cART is drug toxicity. Occasionally it may be difficult to distinguish between hypersensitivity reactions to drugs and manifestations of IRIS.
treatment failure has occurred, requiring a switch to a second-line regimen. Treatment failure can occur for a variety of reasons, including poor adherence, inadequate drug levels, or antiretroviral resistance.
HIV Infection and cART in Children
As the clinical manifestations of HIV infection in children resemble those for a variety of other childhood illnesses, definitive diagnosis of HIV in children in resource-limited settings can be a challenge. In children older than 18 months, rapid tests or antibody-based tests can be used for diagnosis. However, in younger infants, tests that directly detect HIV RNA are required, preferably in the first 4-6 weeks of life for HIV-exposed infants [9, 10].
In sub-Saharan Africa, without access to treatment, a third of HIV-infected children die by one year of age and 53% die by the age of 2 years [18]. In infants and young children,
immune system immaturity and high viral loads produce a high risk of rapid disease progression [19-21]. In children less than 6 years old, CD4 percentage (CD4%) is often preferred to absolute CD4 count because CD4% is more consistent and does not vary according to age [4, 9]. In young children, neither absolute CD4 count nor CD4% is a reliable predictor of mortality, as all young HIV-infected children are at a high risk of mortality [9]. Additionally, failure to thrive and growth retardation are important indicators both of HIV infection and of HIV disease
progression in children. Stunting often occurs during early stages of HIV infection, with wasting being associated with advanced disease [4].
the most severe immunodeficiency at cART initiation experience the slowest but greatest immunologic recovery [25].
In 2010, WHO guidelines recommended that all HIV-infected children under the age of two be immediately initiated on life-long cART [9]. In 2013, the WHO updated the guidelines to recommend that all children under the age of five initiate cART, regardless of WHO clinical stage of CD4 count [10]. Children ages ≥5 years of age should initiate cART if they have a CD4 count of ≤500 cells/µL or WHO clinical stage 3 or 4 disease [10]. Since a definitive HIV
diagnosis and virologic testing is not always available or affordable in some settings,
measurements of decreased CD4 counts or percentages are often used to decide if antiretroviral treatment should be initiated. Recommended first-line cART regimens for use in pediatric patients are lopinavir/ritonavir (LPV/r)-based cART for children <3 years and efavirenz-based cART for children ≥3 years [10].
There are significant challenges in meeting cART guidelines in developing countries, including limited HIV screening, difficulties in HIV diagnosis in young children, limited availability of pediatric formulations, infrastructure issues related to antiretroviral delivery, and deficits in capacity for laboratory monitoring to ensure successful results on therapy. Partially due to these factors, in 2011, only 28% of cART-eligible children aged 0-14 years had initiated therapy [7]. As with adults, cART treatment failure in children is often due to poor adherence. Administration of medications to children requires a responsible, knowledgeable and convincing caregiver, who can limit a child’s medication refusal and encourage ingestion of each dose.
≥2 years, the recommendations were similar, and all children with symptomatic HIV infection (stage III or IV) were eligible for cART. The South African guidelines also include additional specifications to ensure cART adherence: 1) At least one caregiver is able to supervise all
medication administrations for the child, and 2) disclosing HIV status to another adult household member is encouraged in order to assist cART administration. In South Africa, the recommended first-line cART regimen for children ≤3 years old or ≤10 kilograms is PI-based (abacavir + lamivudine + LPV/r), with efavirenz-based regimens recommended as first-line treatment among children over 3 years and >10 kilograms (abacavir + lamivudine + efavirenz). Once a child is initiated on cART, it is recommended that HIV RNA, CD4 count and CD4 percentage are performed at initiation, after six months, after one year, and then annually.
TB Disease
Due to much effort and dedication, the global community has managed to halt and begin to reverse the TB epidemic by decreasing TB incidence, TB prevalence and TB mortality. However, the worldwide burden of TB remains enormous. In 2011, an estimated 8.7 million incident cases of active TB occurred, and 1.4 million people died from TB. Approximately 24% of incident cases are from the African region, an area that has the highest rates of both TB cases and TB deaths per capita [1].
TB infection consists of two stages: latent tuberculosis infection (LTBI) and active TB disease. In total, approximately one third of the global population is infected with M.
can take two forms – pulmonary or extrapulmonary. Some symptoms of TB disease are: weakness or fatigue, weight loss, lack of appetite, chills, fever or night sweats. Cases of
pulmonary TB may experience a bad cough lasting at least three weeks, chest pain, and coughing up blood or sputum. Additional symptoms of extrapulmonary TB disease depend upon the body area affected, such as the kidney, spine or brain [27].
Currently, the only vaccine available to prevent TB is the Bacille-Calmette-Guérin (BCG) vaccine. It is almost 100 years old and mainly protects children against severe forms of TB, but its efficacy in adults is highly variable. BCG is not regularly used in the United States, but is given to infants and young children in countries that experience high TB incidence. Though efforts are underway to develop either an improved BCG vaccine or a new attenuated live M. tuberculosis vaccine, no effective options for adults are currently available [1].
uptake should accelerate. However, much work remains in improving TB diagnostics –in efficiency, available technology and laboratory infrastructure. In 2011, a third of estimated incident TB cases were not laboratory-confirmed at all, and a third of laboratory-diagnosed pulmonary TB cases were not culture-confirmed [1]. These deficits are in addition to the significant delay that many patients experience in receiving a TB diagnosis.
Without proper diagnosis and treatment, active TB disease can be fatal. Once diagnosed with active TB, either empirically or definitively, a patient with drug-susceptible TB receives a standard treatment regimen of the four first-line drugs: rifampicin, isoniazid, pyrazinamide and ethambutol for two months, followed by four months of rifampicin and isoniazid. Fortunately, treatment success rates have been quite high in recent years. In 2010, 85% of all
newly-diagnosed TB cases were successfully treated [1]. These high treatment cure rates make the large numbers of TB deaths further inexcusable. If all TB cases are promptly diagnosed and
adequately treated, the majority of TB deaths could be averted.
Active TB Disease in Children
Though it is difficult to estimate the burden of TB in children and this sub-population has traditionally been neglected in global TB efforts, it is thought that approximately 0.5 million TB cases and 64,000 TB deaths occurred in children under the age of 15 years in 2011 [1]. In high-prevalence countries, children exposed to adults with active TB have a 30-50% risk of becoming infected themselves [28]. Unlike in adults, where active TB disease is generally preceded by latent tuberculosis infection, TB disease in young children is often a primary infection [4]. Up to 40% of infants infected with TB develop active TB, and if untreated, they progress more rapidly than adults [28].
Definitively diagnosing TB in children can be challenging, for a variety of reasons. First of all, there is no easy-to-use and accurate diagnostic test for TB in children. Second, children with active TB disease can present with a broad range of pulmonary and non-pulmonary disease manifestations, which may be non-specific and resemble other pathogens and conditions. Third, most children have paucibacillary TB. The low quantity of bacilli makes sputum smear
It is recommended that children with active TB be treated using directly observed therapy (DOT), to ensure compliance and correct dosing. Children under the age of five years should be treated with only three drugs (isoniazid, rifampicin, and pyrazinamide) in the initial phase. Ethambutol is not recommended unless isoniazid resistance is likely or the child was diagnosed with adult-like TB (upper-lobe infiltration and cavitation associated with sputum production). Children should also have a 6 month course of TB therapy, as in adults [31].
HIV/TB Epidemiology
HIV and TB are the two leading infectious causes of death worldwide. Unfortunately, these pathogens have many synergistic interactions causing their co-epidemic to be even more devastating. With the advent of the HIV epidemic, TB reinforced its role as a serious threat to human health. In 2011, an estimated 1.1 million incident cases of TB occurred among persons with HIV infection, 23% of people with TB who were tested for HIV tested positive, and TB accounted for 26% of acquired immunodeficiency syndrome (AIDS)-related deaths worldwide [1, 7, 32, 33]. Almost 80% of TB cases among HIV-infected individuals reside in Africa [1], with sub-Saharan Africa experiencing the greatest density of HIV/TB co-infection.
HIV/TB Interactions
The dynamics between HIV and TB co-infection are complex and multi-faceted. The effect of HIV on the progression of TB has been fairly well documented. HIV infection increases a person’s susceptibility to infection with M. tuberculosis. Among people already infected with latent M. tuberculosis (i.e., LTBI), HIV infection is the strongest known risk factor for
risk of their latent infection progressing to active TB disease, while in HIV-infected individuals this becomes a 10% annual risk of active TB [27]. In co-infected individuals,
immunosuppression due to HIV infection and lower CD4 counts is associated with a more rapid progression of TB and a greater risk of disseminated tubercular disease and extrapulmonary infection [34]. Advanced HIV immunosuppression also makes a definitive diagnosis of TB more challenging [35], as individuals may present with an atypical immune response and
extrapulmonary TB is more difficult to diagnose than pulmonary TB.
In addition to the effect of HIV on TB disease development, without antiretrovirals, having TB disease is known to accelerate HIV disease progression. TB disease quickens the depletion of CD4 cells, increases the rate of opportunistic infections [36, 37], increases the risk of AIDS [37], decreases survival time [36, 37], and increases overall mortality [36, 37] in HIV-infected individuals. In vitro studies have found that TB increases HIV replication by activating CD4+ T-lymphocytes and macrophages harboring latent HIV [38].
Challenges with HIV/TB Co-treatment
Anti-tuberculosis medications and some antiretrovirals, particularly rifampicin and the NNRTI and PI classes of ARVs, have similar routes of metabolism, thereby causing drug-drug interactions and complicating co-administration. These drug-drug interactions may result in subtherapeutic plasma concentrations of both types of medications and possible undertreatment of HIV and/or TB disease. Specifically, co-administration of nevirapine with rifampicin has been show to decrease levels of nevirapine by 20-58% [4]. Rifampicin also decreases exposure to atazanavir [40], and to lopinavir among children [41]. However, some observational studies found that good virologic, immunologic and clinical outcomes may still be achieved when efavirenz [42, 43] and nevirapine [44, 45] are used in combination with rifampicin.
In addition, nevirapine, rifampicin, isoniazid and pyrazinamide all have potential hepatotoxicity. As these are first-line medications, their use is recommended, even when coadministered with other potentially hepatotoxic drugs or in patients with liver disease. Co-treated patients should be monitored frequently for hepatotoxicity. Another potential symptom of drug toxicity is peripheral neuropathy, which can occur with administration of isoniazid or a number of NRTIs, or may be a manifestation of HIV disease. In adults, rifabutin is potentially substituted for rifampicin in an effort to avoid compounded toxicity and drug-drug interactions. As new ARV options become available, there will be more flexibility in choosing appropriate regimens for HIV/TB co-infected patients.
As mentioned previously, patients beginning cART may experience IRIS during their first few months on therapy. This spectrum of clinical signs and symptoms is brought on as the immune system begins to recover and respond to a known, coexisting infection, and can cause a patient’s clinical condition to deteriorate before it begins to improve. The most common
TB-IRIS includes requirements that 1) the TB diagnosis is made prior to starting cART, 2) a good initial response to TB therapy is observed prior to cART start, and 3) onset of TB-IRIS is within three months of initiating cART [9]. It is also possible to experience similar symptoms in response to an unknown latent or subclinical tuberculosis infection, known as “unmasked TB”. Most cases of TB-IRIS resolve spontaneously or with the help of anti-inflammatory drugs [6], though some cases can be severe or even fatal. It is recommended that both TB treatment and cART continue throughout the IRIS episode [46].
Patients concurrently undergoing treatment for TB disease and HIV infection are often subject to a large daily burden of medications for a long period of time. Understanding the purpose and dosing schedule of each medication can be difficult, and co-treated patients may display lower adherence due to confusion or intolerance of so many pills. For these reasons, treatment support, possibly including DOT, is recommended for co-treated patients [46]. As cART regimens move toward single-pill once daily administration, this will alleviate some of the pill burden experienced by co-treated patients.
Timing of HIV/TB Co-treatment
The South African Starting Antiretroviral Therapy at Three Points in Tuberculosis (SAPiT) study included ambulatory HIV-infected patients with smear-positive TB and CD4 counts <500 cells/µL, who were randomized to receive cART either during the first 4 weeks of TB therapy, after the first 8 weeks of TB treatment, or after the completion of TB therapy
(sequential therapy). The sequential treatment arm was stopped mid-trial, as the mortality rate of integrated therapy was 56% lower than with sequential therapy [47]. In less immunosuppressed patients, there was no significant difference in the rate of AIDS or death between the two integrated therapy arms, though patients with baseline CD4 counts of <50 cells/µL experienced less AIDS or death with earlier initiation of cART (8.5 vs. 26.3 cases per 100 person-years) [48].
The Cambodian Early versus Late Introduction of Antiretrovirals (CAMELIA) study randomized patients with CD4 counts of <200 cells/µL to initiate cART at either 2 or 8 weeks after TB treatment initiation. After a median of 25 months of follow-up, patients who initiated cART at 2 weeks experienced 38% less mortality than those starting cART at 8 weeks. This significant overall reduction in mortality was experienced by all patients, regardless of baseline CD4 count [49].
Finally, the STRIDE study (ACTG 5221) was a multinational study conducted at 28 sites. ART-naïve patients with confirmed or probable TB and CD4 counts <250 cells/µL were
randomized to either earlier (<2 weeks) or later (8-12 weeks) cART. Though overall rates of death and AIDS did not differ by treatment arm, patients with CD4 counts <50 cells/µL who received earlier cART did benefit from a significant reduction in AIDS or death [50].
initiating cART earlier, IRIS was infrequently associated with mortality. Therefore, the benefits of earlier cART initiation appear to outweigh the risks in co-infected patients. The only
exception to this recommendation is TB meningitis, which often has severe complications and high mortality. One randomized controlled trial indicated that early cART was associated with a higher rate of severe adverse events in patients with TB meningitis [51], and further research is needed in this area.
HIV/TB Services Integration
To combat these substantially overlapping epidemics, there has been much emphasis on integrating TB and HIV activities in recent years. For example, while only 3% of African TB patients were tested for HIV in 2004, 69% were tested in 2011. Integration is part of the current World Health Organization Stop TB strategy and has saved an estimated 1.3 million lives between 2005 and 2011 [1, 7].
Integration of HIV/TB care comprises a number of elements, including screening HIV patients for TB, testing TB patients for HIV, co-locating HIV and TB treatment facilities, preventing TB among persons with HIV, and combining HIV and TB surveillance systems. As an intervention to prevent HIV-infected individuals from becoming infected with latent TB or developing active TB, preventive therapy with isoniazid is combined with cART in certain circumstances. Isoniazid preventive therapy (IPT), along with intensified TB case finding among those with HIV and increased infection control, make up the “Three Is” strategy for preventing TB among HIV-infected individuals [1].
initiated cART [7]. A recent study in South Africa looked at the concordance of variables captured in separate HIV and TB surveillance systems for co-infected patients [52]. They found varying levels of completeness and concordance, and recommended a standardized minimum dataset for national reporting. Despite the fact that HIV and TB services are integrating more slowly then is ideal, research continues to suggest that complete integration is feasible and is beneficial to patients. Another recent South African study found that HIV/TB service integration led to a 60% increase in the number of TB patients starting cART and reduced the time to cART initiation by 72 days [53].
HIV and TB in Children
The HIV/TB co-epidemic is even more challenging in children, due to the diagnostic and treatment challenges and high mortality rates. In resource-limited countries, the prevalence of HIV among children with active TB ranges from 10% to 62% [4, 29]. In infants and young children, immune system immaturity results in a high risk of rapid disease progression of HIV [19, 20] and TB [54].
In practice, all HIV-infected infants and children should undergo TB screening and be evaluated for contact with a TB case at each health visit. Common manifestations of tuberculosis in HIV-infected children are persistent cough, fever, and failure to thrive, though these signs and symptoms often are non-specific and mimic those of other common illnesses. TB disease in HIV-infected children does tend to be more severe and rapidly progressing than in adults, and often involves extrapulmonary or disseminated TB.
during later stages of HIV infection, tuberculin skin testing is often negative, particularly if a child is malnourished [55]. TB is often more common among HIV-infected children than is initially apparent. With systematic TB screening prior to cART initiation in Uganda, a 70% relative risk reduction in unmasked TB was observed [56]. An autopsy study found that 70% of TB disease found in deceased HIV-infected children was undiagnosed prior to autopsy [57].
Research indicates that starting cART during TB treatment significantly improves survival [58-60], and perhaps virologic response [60]. However, the optimal treatment strategy for children with both TB and HIV is still being explored. As of 2010, WHO guidelines
recommend to start TB treatment immediately, and then initiate cART as soon as tolerated in the first 8 weeks of TB therapy, regardless of clinical stage and level of immunosuppression [9]. When to start cART within those 8 weeks is determined by a number of factors, including age, level of immune suppression, pill burden, potential drug interactions, overlapping toxicities, and risk of IRIS. Efavirenz-based cART is not recommended for children under the age of 3, as information on appropriate dosing is lacking. Therefore, the preferred first-line antiretroviral regimen for children <3 years old and on TB treatment is nevirapine + 2 NRTIs or a triple NRTI regimen. Children with TB aged ≥3 years are recommended to take efavirenz + 2 NRTIs or a triple NRTI regimen as first-line cART [10]. A triple NRTI regimen is recommended only for the duration of TB treatment.
1:1 lopinavir:ritonavir ratio, and older children on LPV/r should receive a double dose of LPV/r [26].
The choice of cART regimen in children is often limited by the options available in pediatric drug formulations and a lack of dosing information. Older children can often be treated with adult formulations, but their use in younger children creates the risk of suboptimal treatment or overdosing. Though rifabutin can be considered as a substitution for rifampicin in adults, it cannot be used in children due to insufficient data and no pediatric formulation [9]. Much more research is needed to determine optimal co-treatment for HIV-infected children with TB.
Though not as common as in adults, children can also experience TB-IRIS or unmasked TB after cART initiation. There is limited data on TB-IRIS in infants and children and the direct mechanism and causes are not clearly understood. Children initiating cART may experience a 10% to 20% cumulative incidence of IRIS [61, 62], and IRIS is seen most often in younger children, children who initiate cART with CD4 percentages of <15%, and those with low-weight-for-age [9, 62]. In areas with routine TB vaccination of infants with the BCG vaccine, BCG-associated IRIS may also be observed.
The Effect of TB Treatment on Response to cART
Given WHO’s 2010 recommendation that all HIV-positive patients with TB be initiated on cART, regardless of CD4 count [2], and the goal of 100% cART coverage of co-infected patients by 2015 [3], many individuals will be initiating cART while concurrently on TB therapy. However, the effect of receiving TB treatment at cART initiation on response to cART is not yet well determined. In particular, knowing the effect of TB treatment on mortality, virologic response and immunologic response to cART will help describe the prognosis of TB patients on cART, quantify what impairment to cART response, if any, is experienced by co-infected patients, and afford more confidence in clinical decision-making for those caring HIV/TB co-treated patients. As TB treatment lasts at least 6 months, it is important to differentiate between short- and long-term effects of TB treatment on cART response.
Effect of TB Treatment at cART Initiation on Subsequent Mortality in Adults
Worldwide, a substantial proportion of patients initiating cART die during the first year, and the majority of deaths occur within the first 3 months. The prevalence of undiagnosed TB among patients initiating cART and the risk of incident TB while on cART are high, which contributes to the marked mortality. Still, the extent to which receiving TB treatment at cART initiation contributes to mortality is not entirely understood.
initiation). They did report an estimate of the effect of tuberculosis on mortality in studies where at least 50% of persons were exposed to cART (HR 1.1, 95% CI 0.9, 1.3). Separately, they calculated a pooled hazard ratio for three studies that reported the effect of prevalent TB on mortality (HR 1.5, 95% CI 0.9, 2.2), though one of these studies was not limited to patients on cART [67]. Because of the paucity of data, the authors also concluded that the effect of
tuberculosis on mortality in persons exposed to cART needs to be further evaluated once the results of more cohort studies become available.
Effect of TB Treatment on Virologic Response to cART in Adults
Though it appears that individual viral load values do not directly correlate with disease progression or mortality risk, monitoring virologic response to cART is useful for quantifying the effect of antiretroviral drugs on viral replication and for identifying treatment failure.
Virologic response can be measured in a variety of ways, including: virologic
suppression, virologic failure, virologic rebound, or a simple description of changes in HIV RNA levels over time since cART initiation. Additionally, a variety of effect measures can be used to estimate these outcomes, including comparing proportions, odds ratios, risk ratios, hazard ratios, or a comparison of median viral loads at a specific time point. All of these methods have been used by studies attempting to estimate the impact of TB treatment on virologic response to cART. As with mortality, studies also used a variety of follow-up times when describing virologic response and the potential effect of TB treatment, ranging from 4 weeks [71] to 48 months [72, 73], and found a range of positive, neutral, and negative effects of TB treatment on virologic response.
As for longer-term estimates, Manosuthi et al. (2010) found no effect of TB treatment on virologic suppression <50 copies/mL among patients on nevirapine-based regimens at 4 years, with an odds ratio (OR) of 1.1 (95% CI 0.6, 2.2) [72]. Similarly, Bastard et al. (2012) found those receiving vs. not receiving TB treatment experienced similar virologic response at 4 years, with ORs of 1.1 (95% CI 0.7, 1.6) for virologic suppression <400 copies/mL and 0.9 (95% CI 0.6, 2.0) for virologic failure >5000 copies/mL [73].
As illustrated, there is much variation among studies quantifying the effect of TB treatment on virologic response to cART, and it is difficult to ascertain the true effect without a systematic review and possible meta-analysis of the published effect estimates.
Effect of TB Treatment on Immunologic Response to cART in Adults
Immunologic response to cART can be assessed in a number of ways. First of all, one can focus on either immune reconstitution or immunologic failure. Within these categories, the outcome can be defined using measures such as CD4 count threshold values, absolute changes in CD4 count from baseline, or percent change in CD4 count from baseline. As with virologic response, a wide range of study designs and estimates seeking to quantify the effect of TB treatment on immunologic response to cART have been published, with follow-up times ranging from 4 weeks [71] to 53 months [75] following cART initiation.
A handful of studies reported the mean or median increase in CD4 count from baseline in patients receiving vs. not receiving TB treatment at cART initiation. Most found a similar
immune response in the two groups, regardless of length of follow-up time [71, 76-80].
Six studies measured median absolute CD4 count in the two groups at various time points, and found a range of results. Three studies found a similar median absolute CD4 count [44, 76, 84], two found those receiving TB treatment to have slightly higher CD4 counts [85, 86], and two found those on TB treatment to have lower CD4 counts during follow-up [72, 78].
As examples of some other types of immunologic response measures, Dronda et al. (2011) found that, in patients receiving vs. not receiving TB treatment, 60% vs. 69% experienced an increase of ≥50 CD4 cells/µL by 6 months and 56% vs. 62% had an increase of ≥100 CD4 cells/µL by 12 months [79]. Julg et al. (2012) found that 64% vs. 61% achieved an absolute CD4 count >200 by 12 months and 20% vs. 15% had a CD4 count >500 by 30 months following cART initiation [87].
Again, with the variation in outcome measures and follow-up times, a systematic review is needed to summarize the diverse literature regarding the effect of TB treatment on
immunologic response to cART.
Effect of TB Treatment on Response to cART in Children
To date, only a handful of studies have investigated the role of TB treatment in pediatric response to cART and there is a need for more data [88]. In terms of mortality on cART, limited research indicates that TB treatment does not significantly increase mortality in children [89-91]. Bong et al. (2007) found that children ≤14 years on nevirapine-based cART and TB treatment had 6-month and 12-month survival probabilities of 0.86 and 0.86, as compared to 0.89 and 0.88 in TB-free children [89]. Van Dijk et al. (2013) found no difference in mortality between
included in the latter group [90]. Frohoff et al. (2011) also found no significant effect of TB treatment on mortality among children ≤2 on LPV/r-based cART (9% vs. 7%) [91].
In total, six pediatric studies with follow-up CD4% and/or HIV RNA measurements have been published, all from South Africa except for one from Zambia [90]. Three of these studies examine the effect of TB treatment at cART initiation on virologic response [91-93], four report CD4% reconstitution [90, 91, 93, 94], and one looks at the probability of severe
immunodeficiency following cART initiation [95].
In terms of virologic suppression, Zanoni et al. (2011) found that TB treatment had a negative effect on virologic suppression overall in children ≤18 years at 6 months post cART initiation, but that effect disappears by 12 months [92]. However, when stratifying on cART regimen type, it appears that TB treatment only had a negative effect among those on PI-based cART. Frohoff et al. (2011) also observed that TB treatment decreased suppression among young children (aged 6-24 months) on double-dose LPV/r and ritonavir-based cART [91]. Reitz et al. (2010) found decreased suppression by 39 weeks among children <2 years on ritonavir or unboosted LPV/r-based cART being co-treated for TB [93]. Reitz et al. also found a lower incidence of virologic rebound among those on TB treatment (2.8% vs. 12%) [93].
severe immunodeficiency at 6-24 months following cART initiation was Fatti et al. (2011), who found no effect with an adjusted odds ratio (aOR) of 1.1 (95% CI 0.7, 1.6) [95].
These studies possess some limitations. Nearly all reported effect measures were crude, without accounting for important factors such as baseline CD4% or HIV RNA, age, or cART regimen. All studies except Reitz et al. were retrospectively conducted using medical records, which is not optimal for data quality and completeness. All studies except Van Dijk et al. and Fatti et al. had a year or less of follow-up time. This limits the ability to distinguish short- and long-term effects of TB treatment and measure longer-term outcomes such as virologic rebound. In Reitz et al. and Zanoni et al. (2011), those with incident TB were excluded from the
denominator. Additionally, even though a couple of the studies adjusted for cART regimen, it is most helpful to stratify by cART regimen, in an effort to determine which regimens are better suited for use with concurrent TB treatment.
Summary and Rationale
There is a general knowledge gap regarding the effect of TB treatment at cART initiation on response to cART, both in adults and children. Although numerous studies on this subject have been published in adults, the heterogeneity in terms of study population, outcome
CHAPTER III
RESEARCH METHODS
Study Design and Manuscripts
The study’s aims were pursued via systematic reviews and meta-analytic methods, and a secondary analysis of data from the THINK cohort study of pediatric patients in South Africa. This study produced three manuscripts. The first, entitled “The Effect of Tuberculosis Treatment at Combination Antiretroviral Therapy Initiation on Subsequent Mortality: A Systematic Review and Meta-Analysis” addresses Specific Aim 1. The second, entitled “The Effect of Tuberculosis Treatment on Virologic and CD4 Count Response to Combination Antiretroviral Therapy: A Systematic Review” addresses Specific Aim 2. The third, entitled “The Effect of Tuberculosis Treatment on Virologic and Immunologic Response to Combination Antiretroviral Therapy among South African Children” addresses Specific Aim 3.
Methods for Specific Aims 1 and 2
Literature Review Protocol
To investigate the effect of TB treatment at cART initiation on mortality, virologic response, and immunologic response to cART, we carried out a systematic and sensitive search using an a priori protocol developed according to PRISMA guidelines [96]. We searched PubMed and EMBASE, as well as abstract databases from the 2009 to 2012 Conferences on Retroviruses and Opportunistic Infections (CROI), International Union Against Tuberculosis and Lung Disease (IUATLD) World Conferences on Lung Health, and International AIDS Society (IAS) Conferences. The search terms “HIV AND Tuberculosis AND (Viral Load OR CD4 lymphocyte count OR mortality) AND Antiretroviral therapy” were used to identify relevant articles in PubMed and EMBASE. The terms “TB” or “tuberculosis” were used to search
conference abstracts from CROI and IAS. The terms “HIV” or “antiretroviral therapy” were used to search conference abstracts from IUATLD. Searches were performed on March 1, 2013 (Specific Aim 1) and January 29, 2013 (Specific Aim 2) and included original studies on human subjects research published between 1997 (the start of the cART era) and the search dates. Additional articles were identified from reference lists, reviews and Web of Science citation searches.
Study selection
Two authors (Heidi Soeters, Annelies Van Rie) independently reviewed all titles and abstracts of original studies retrieved by the search. One author (Heidi Soeters) reviewed full-text and references of all selected articles. Two reviewers (Heidi Soeters and Monita Patel)
Studies were included in the analysis if they included both antiretroviral-naïve HIV-infected individuals receiving and not receiving TB treatment at cART initiation, and reported mortality (Specific Aim 1) or virologic and/or CD4 count response (Specific Aim 2) after cART initiation, stratified by TB treatment status at cART initiation. Though we sought reports of cART-naïve patients, studies with ≤10% antiretroviral-experienced patients or patients only previously exposed to a single intrapartum dose of nevirapine were also included. Studies of children <14 years of age were excluded. No additional exclusion criteria or language restrictions were imposed.
Data extraction
Meta-analysis Methods for Specific Aim 1
Any reported mortality effect estimates (HR, RR, OR) for any time frame were abstracted. If only survival proportions among those receiving or not receiving TB treatment were reported, Episheet was used to convert the counts into a RR with a 95% CI, as the RR approximates the HR for an uncommon outcome. If an effect-measure estimate was reported for those not receiving vs. receiving TB treatment (as opposed to receiving vs. not receiving TB treatment), the inverse of the reported effect-measure estimate and CI were included. If only a p-value from a univariate logistic regression model was presented, the 2x2 table was reconstructed and Episheet was used to calculate a RR. Standard error estimates were inferred from reported CIs by [ln(upper limit) – ln(lower limit)]/3.92 [97].
As tuberculosis is successfully treated in most patients after six months of treatment, and the hazard of mortality following cART initiation is not constant, we grouped the available cumulative effect estimates according to the length of follow-up: 1-3 months, 6-12 months, and 18-98 months. None of the eligible studies reported estimates at 4-5 months or 13-17 months following cART initiation. If a study reported multiple estimates within a time category, the time frame closest to the category midpoint was included in the primary analysis and other time estimates were examined in sensitivity analyses.
opposite effects proportions [100] (proportion of populations estimated to experience a relative risk on the opposite side of the estimated mean, in this case below unity), and 95% prediction intervals [100] (95% of these intervals will cover the true value estimated by a future study). Stratified and random-effects meta-regression analyses were used to calculate stratum-specific summary measures and 95% CIs, along with ratios of the average RRs as described by
Thompson and Sharp [101]. Study characteristics with at least two studies per stratum were eligible for inclusion in the meta-regression.
Funnel plots of the log relative risk of mortality vs. the inverse-variance weight of studies for each time category were visually examined for asymmetry and statistically assessed using methods proposed by Begg [102] and Egger [103]. The trim and fill method was used to assess publication bias [104]. STATA (version 12, Stata corporation, College Station, TX, USA) was used for these analyses.
Meta-analysis Methods for Specific Aim 2
Reported effect estimates over any length of time were abstracted. If only count data of those who experienced an outcome, stratified by TB treatment status, were reported, a RR and 95% CI were calculated. If a study reported an outcome only graphically, outcome values were visually estimated [98]. Standard error estimates were inferred from reported CIs by [ln(upper limit) – ln(lower limit)]/3.92 [97]. As we aimed to quantify virologic suppression, if a study reported on patients who failed to suppress, this information was converted to obtain data on suppression. For CD4 counts, if 2 of 3 of the following measures were reported, we calculated the third measure: mean baseline CD4 count, mean change in CD4 count from baseline, mean absolute CD4 count. We were unable to calculate the missing measures if only median CD4 counts were reported.
analyses were used to calculate stratum-specific summary measures and 95% CIs, along with ratios of the stratum-specific RRs as described by Bassler [107].
Funnel plots of ln(virologic suppression relative risk) vs. the inverse-variance weight of studies were visually examined for asymmetry and statistically assessed using methods proposed by Begg [102] and Egger [103] and the trim-and-fill method [104]. STATA (version 12, Stata corporation, College Station, TX) was used for these analyses.
Methods for Specific Aim 3
Study Population
We performed a secondary analysis of data from the TB HIV IRIS and Nutrition in Kids (THINK) study. This South Africa-based study prospectively followed 1) children diagnosed and treated for TB who become eligible for cART, and 2) children who are TB-free at the time of cART initiation. The primary objectives were to determine the incidence, timing, and clinical manifestations of TB- and BCG- IRIS among children initiating cART, along with the
association between malnutrition and the risk of developing TB- and BCG-IRIS.
TB and HIV Diagnosis
Children were diagnosed with TB [108] and HIV [26, 109] according to South African guidelines. TB diagnosis was made based on a combination of clinical signs, contact with an adult with active TB, positive tuberculin skin test, suggestive chest X-ray, or positive sputum smear microscopy or culture [108]. The National Health Laboratory Service processed all sputum samples. Starting in July 2011, a sputum sample was also evaluated by the Xpert MTB/RIF assay. HIV diagnosis was confirmed according to national guidelines.
Clinical Care
Children were treated according to national guidelines for TB and HIV [26, 108, 110]. All children diagnosed with active TB were treated and generally received isoniazid, rifampicin, pyrazinamide, and ethambutol for two months followed by isoniazid and rifampicin for four months.
Prior to April 2010 in South Africa, children were eligible for cART if they had recurrent or prolonged HIV-related hospitalizations, WHO stage II/III disease [111], CD4% <20% (if ≤18 months), or CD4% <15% (if >18 months) [109]. Children ≤3 years or ≤10 kilograms initiated LPV/r-based cART (stavudine + lamivudine + LPV/r), children >3 years and >10 kilograms initiated efavirenz-based cART (stavudine + lamivudine + efavirenz). Initiation of cART was delayed for at least two months in children receiving TB treatment and they received ritonavir at a 1:1 dosage with lopinavir (super-boosted LVP/r).
CD4% ≤25% or CD4 count <750 cells/µL. Children >5 years were eligible if WHO stage III/IV or CD4 count <350 cells/µL. Children ≥3 years and ≥10 kilograms initiate efavirenz-based cART (abacavir + lamivudine + efavirenz), and LPV/r-based cART (abacavir + lamivudine + LPV/r) is used for children <3 years old or <10 kilograms. Initiation of cART was recommended to be delayed for 2-4 weeks after starting TB treatment, and children concurrently on TB treatment and LPV/r-based cART received added ritonavir: super-boosted LVP/r for younger children, and a double LPV/r dose for older children [26].
The updated guidelines also recommended decentralization of pediatric cART initiation and follow-up care to primary care clinics. For this reason, many patients chose to receive their ART care closer to home and no longer returned to the hospital regularly, essentially making them lost-to-follow-up. However, every effort was made to encourage the children to return to the study for the final 24-month visit, even if they transferred to an ART service closer to home.
Patient Follow-up
Study variables
CD4% (LSRII flow cytometer, BD Biosciences) and HIV RNA (Ultrasensitive Amplicor HIV Monitor assay, Roche Diagnostic Systems, Basel, Switzerland, lower limit of detection 50 copies/mL) were measured at or before cART initiation and at every three months during follow-up. Baseline values were those measured at cART initiation or the closest value within four months prior to initiation. Level of immunodeficiency and anemia were defined according to WHO age-specific classifications [111, 112]. Severe immunodeficiency was defined as: CD4% <25% in children <11 months, CD4% <20% in children 12-35 months, CD4% <15% in children 36-59 months, and CD4 cell count <200 cells/µ L or CD4% <15% in children >5 years [111]. Weight-for-age z-scores were calculated using the WHO Anthro (version 3.2.2) SAS macro [113] for children <5 years old and the WHO AnthroPlus SAS macro [114] for children 5-8 years old.
Virologic suppression was defined as the first documented HIV RNA <50 copies/mL following cART initiation. Virologic rebound was defined as HIV RNA >1000 copies/mL following a prior measurement <50 copies/mL. The primary measure of immunologic response was median increase in CD4% from baseline at 3, 6, 12 and 24 months following cART
initiation.
following a prior measurement of <50 copies/mL. Less children were included in this sensitivity analysis, as they were missing repeated HIV RNA measurements or virologic rebound occurred at the end of follow-up.
Statistical Analysis
Wilcoxon rank-sum tests were used to compare continuous demographic and clinical variables between groups, Pearson’s X2 test was used for categorical variables, and exact P values were calculated when appropriate.
To examine virologic suppression, the median time to suppression was calculated, stratified by TB treatment status. The distributions of event times in each exposure group were examined by plotting the Kaplan-Meier estimate of the survivor function; the log-rank test was used to compare the two curves. Crude and multivariable Cox proportional hazards regression were used to calculate HRs and associated 95% CIs. Time origin was the date of cART initiation and patients were censored at the earliest occurrence of death, loss to follow-up (censored on last visit date), or 24-month study visit. Covariates considered as effect measure modifiers and/or confounders included cART guidelines used (pre-2010 vs. 2010 guidelines), age (<2.1 vs. ≥2.1 years), sex, weight-for-age z-score (<-3 vs. ≥-3), baseline HIV RNA (<5.5 vs. ≥5.5 log10
clinically meaningful. A p-value > 0.10 indicated heterogeneity in the stratum-specific measures of association. Similar methods were used to assess virologic rebound, limiting the analysis to patients who ever experienced virologic suppression.
Median increases in CD4% were calculated, both overall and stratified by TB treatment status. Median CD4% and median CD4% gains were compared using Wilcoxon rank sum tests. Side-by-side box plots of CD4% at each visit in children receiving vs. not receiving TB
treatment were created. The proportion of children with severe age-specific immunodeficiency [111] at each visit was also examined.
In addition to the overall analysis, we performed exploratory sensitivity analyses
stratified by (1) cART regimen and (2) timing of cART initiation relative to the 2010 change in guidelines. As new guidelines were implemented over several months, children who initiated cART from April to October 2010 were classified as initiating care according to the pre-2010 guidelines if their initial regimen included stavudine or as initiating according to the 2010 guidelines if their initial regimen contained abacavir.
Study data were collected and managed using Research Electronic Data Capture (REDCap) [115] hosted at The University of North Carolina-Chapel Hill. All analyses were performed using SAS (version 9.3, SAS Institute, Cary, North Carolina, USA).
Ethics Approval
CHAPTER IV
THE EFFECT OF TUBERCULOSIS TREATMENT AT COMBINATION ANTIRETROVIRAL THERAPY INITIATION ON SUBSEQUENT MORTALITY: A
SYSTEMATIC REVIEW AND META-ANALYSIS
Introduction
Tuberculosis (TB) continues to threaten the health of people living with HIV (PLWH). Globally in 2011, 13% of incident TB cases were co-infected with HIV and an estimated 0.4 million TB deaths occurred among PLWH [1]. Access to combination antiretroviral therapy (cART) has dramatically increased survival, but a substantial number of PLWH die during the first year of cART. The majority of deaths occur within the first three months [11-13, 116]. Autopsy studies have consistently shown TB to be an important cause of death in PLWH, both in the pre-cART [117-119] and cART eras [120].
In 2010, a meta-analysis of the effect of TB on mortality found PLWH also suffering from TB had a greater risk of mortality than TB-free individuals (hazard ratio [HR]: 1.8, 95% confidence interval [CI]: 1.4-2.3) [66]. Due to the paucity of studies reporting on patients on cART, the authors concluded that the effect of TB on mortality in PLWH exposed to cART must be further evaluated once more cohort study results become available.
treatment for confirmed or clinically suspected active TB. PLWH who are also being treated for TB may experience a differential response to cART due to drug-drug interactions [4, 5], an increased risk of drug toxicity [4, 5], immune reconstitution inflammatory syndrome [6], and the potential for lower adherence due to the high pill burden [5]. The effect of TB treatment and its associated potential challenges and complications on a patient’s response to cART is not yet clear [121].
We aim to describe the impact of receiving TB treatment at the time of cART initiation on subsequent mortality among HIV-infected adults. We performed separate analyses to identify the effect at 1-3 months, 6-12 months, and 18-98 months.
Methods
Search strategy and selection criteria
To investigate the effect of TB treatment at the time of cART initiation on mortality, we carried out a systematic and sensitive search using an a priori protocol developed according to PRISMA guidelines [96]. We searched PubMed and EMBASE, as well as abstract databases from the 2009 to 2012 Conferences on Retroviruses and Opportunistic Infections, International Union Against Tuberculosis and Lung Disease World Conferences on Lung Health, and
era). Additional articles were identified from reference lists, reviews, and Web of Science citation lists.
H.M.S. and A.V.R. independently reviewed titles and abstracts of original studies
retrieved by the search. H.M.S. reviewed full-text and references of selected articles. H.M.S. and M.R.P. independently abstracted study data from full reports; discrepancies were resolved by consensus or consultation with A.V.R. and C.P.
Studies were included if they included both antiretroviral-naïve HIV-infected individuals receiving and not receiving TB treatment at cART initiation, and reported mortality after cART initiation stratified by TB treatment status at cART initiation. cART was defined as a treatment regimen containing three or more antiretrovirals. Though we sought reports of cART-naïve patients, studies with ≤10% antiretroviral-experienced patients or patients only previously exposed to a single intrapartum dose of nevirapine were also included. Studies of children <14 years of age were excluded. No additional exclusion criteria or language restrictions were imposed.
Data extraction
HIV-RNA; measure of effect or event counts; covariate adjustment; proportion lost-to-follow-up; and if mortality was confirmed using a national death registry.
Statistical analysis
Reported mortality effect-measure estimates over any length of time were abstracted. If only survival proportions among those receiving or not receiving TB treatment were reported, a risk ratio (RR) and 95% CI were calculated, as the RR approximates the HR for an uncommon outcome. If an effect-measure estimate was reported for those not receiving vs. receiving TB treatment, the inverse of the reported effect-measure estimate and CI were included. If only a p-value from a univariate logistic regression model was presented, the 2x2 table was reconstructed and a RR was calculated. Standard error estimates were inferred from reported CIs by [ln(upper limit) – ln(lower limit)]/3.92 [97].
As tuberculosis is successfully treated in most patients after six months of treatment, and the hazard of mortality following cART initiation is not constant, we grouped available
cumulative effect estimates according to length of follow-up: 1-3 months, 6-12 months, and 18-98 months. None of the eligible studies reported estimates at 4-5 months or 13-17 months
following cART initiation. If a study reported multiple estimates within a time category, the time frame closest to the category midpoint was included in the primary analysis and other time estimates were examined in sensitivity analyses.
effects intervals [99] (where 95% of populations are estimated to have their relative risks), opposite effects proportions [100] (proportion of populations estimated to experience a relative risk on the opposite side of the estimated mean, in this case below unity), and 95% prediction intervals [100] (95% of these intervals will cover the true value estimated by a future study). Stratified and random-effects meta-regression analyses were used to calculate stratum-specific summary measures and 95% CIs, along with ratios of the average RRs as described by
Thompson and Sharp [101]. Study characteristics with at least two studies per stratum were eligible for inclusion in the meta-regression.
Funnel plots of ln(mortality relative risk) vs. the inverse-variance weight of studies for each time category were visually examined for asymmetry and statistically assessed using methods proposed by Begg [102] and Egger [103] and the trim-and-fill method of Duval and Tweedie [104]. STATA (version 12, Stata corporation, College Station, TX) was used for these analyses.
Results
Selected studies
was included. Five eligible studies were excluded: one [131] because a 2012 paper [106] provided an updated estimate; four because they included some early incident TB cases in their TB treatment-exposed group [123, 127, 128, 130].
Study and population characteristics
The 22 final studies provided data on 98,350 PLWH, of which 14,779 (15%) were receiving TB treatment at cART initiation. Selected study and population characteristics are displayed in Table 1. All were cohort studies. Most publications assessed mortality after cART initiation, regardless of regimen type, though some reported estimates specific to nevirapine-[72, 81, 105, 136] or efavirenz-based [69, 81, 82] therapy. See Table 10 (Appendix) for cART
regimens used by each study. All studies used cART initiation as the time origin, except one which began at the commencement of cART education and adherence sessions, with most patients starting cART a month or two later [83]. Four studies included women previously exposed to a single intrapartum dose of nevirapine [14, 68, 81, 124], and two studies included 3% [106] and 6% [126] antiretroviral-experienced patients.
Ten studies examined TB treatment at cART initiation as the main exposure of interest [69, 70, 72, 79, 81-83, 105, 106, 135]. The other twelve studies examined TB treatment as a secondary exposure; five examined any predictors of mortality [122, 124, 125, 132, 136], three aimed to describe general cART outcomes [11, 14, 68], and one each examined the primary exposures of integrated vs. vertical HIV programs [126], positive serum cryptococcal antigen [129], age [137], and hepatitis B and C co-infections [133]. The type of TB being treated varied across studies (Table 11, Appendix). Only two studies had a substantial subset of
probable TB cases. Most articles included any TB being treated at the time of cART initiation, whereas others used a specific time period such as new TB diagnosis at study entry [69, 127] or diagnosis ≥1 month prior to enrollment [72]. Nine studies reported detail on the duration of TB treatment at the time of cART initiation (Table 12, Appendix). One study focused solely on pulmonary TB [106], and one censored patients in the reference group that developed incident TB [81].
Mortality was mainly assessed using medical records and/or confirmation from family or health workers, however two studies additionally used national death registries [14, 106]. In an effort to quantify late mortality, two studies excluded deaths occurring in the first three months [14, 137]. Overall loss-to-follow-up was reported by 19 studies and ranged from 0% to 21% (median 9%).
Two studies were limited to women only [68, 124]. Mean patient age ranged from 28 to 40 years (median 35 years), with the youngest included age being 14 years [81]. One study stratified mortality estimates according to age [137]. Median baseline HIV-RNA ranged from 4.4 to 5.7 log10 copies/mL (median 5.1), and baseline CD4 count ranged from 31 to 196 cells/µL
(median 111). See Table 13 (Appendix) for baseline CD4 count stratified by TB treatment status from each study, if available.
Relative risk of mortality