INTERDEPENDENCE OF FINANCING PARAMETERS AND PROCESSING IMPROVEMENTS IN THE DESIGN OF ECONOMICALLY COMPETITIVE ALGAL
BIOFUEL PRODUCTION PATHWAYS
Adam McCutchan Hise
A thesis submitted to the faculty at the University of North Carolina at Chapel Hill in partial fulfillment of the requirements for the degree of Master of Science in the Department of
Environmental Sciences and Engineering.
Chapel Hill 2015
Approved by:
© 2015
ABSTRACT
Adam McCutchan Hise: Interdependence of Financing Parameters and Processing Improvements in the Design of Economically Competitive Algal Biofuel Production Pathways
(Under the direction of Gregory W. Characklis)
Financing parameters have often been considered exogenous variables in
techno-economic analyses of algal biofuels production systems; these parameters reflect investment risk, a function of the processing techniques used and uncertain regulatory support, and are therefore linked to biorefinery design and current policy. Variations in financing parameters, representing regulatory policies (e.g. tax credits, loan guarantees, accelerated depreciation methods) and a range of investment risk are modeled to evaluate the impact of each on the economic
TABLE OF CONTENTS
LIST OF FIGURES ... vi
LIST OF ABBREVIATIONS ... viii
CHAPTER 1. INTRODUCTION ...1
CHAPTER 2. MATERIALS AND METHODS ...6
2.1. Life Cycle and Techno-Economic Framework ...6
2.2. Integrated :LCA/TEA Methodology ...7
2.2.1. Goal and Scope of Analysis ...7
2.2.2. Inventory ...9
2.2.3. Impact Assessment...10
2.3. Biorefinery Processes and Sub-Process Alternatives ...11
2.3.1. Algae Cultivation ...12
2.3.1.1. Growth Scenarios ...13
2.3.1.2. Bicarbonate-Induced Lipid Productivity Boost ...14
2.3.2. Dewatering and Drying ...15
2.3.2.1. Hydrogel Dewatering ...15
2.3.3. Extraction and Conversion ...17
2.3.3.1. Thermochemical Conversion ...17
2.3.4. Nutrient and Energy Recycling ...19
2.4. Baseline Pathway Development ...19
2.5. Economic Analysis ...22
2.5.1. Financial Factor Uncertainty...22
2.5.2. Economic Assumptions ...25
2.6. Interpretation ...26
2.6.1. Distribution of Impacts ...26
2.7. Analysis Overview ...28
CHAPTER 3. RESULTS ...30
3.1. Processing Improvements ...30
3.1.1. Economic and Energetic Performance ...30
3.1.2. Environmental Performance ...36
3.2. Financing Improvements ...38
3.3. Relative Impact of Technical Optimization and Financing Improvements ...40
3.4. Combining Processing and Financing Improvements ...41
3.5. Sensitivity Analysis ...43
CHAPTER 4. DISCUSSION ...47
4.1. Considering Sub-Process Decisions within Financing Environment ...47
4.1.1. Risk Mitigation Perspective ...48
4.2. Improving CER by Reducing Embodied Energy of Inputs ...49
4.3. HTL Upgrading Energy ...51
4.4. Future Work ...51
CHAPTER 5. CONCLUSIONS ...53
APPENDIX A: MODEL INPUTS AND REFERENCES ...55
APPENDIX B: BICARBONATE-INDUCED LIPID PRODUCTIVITY BOOST ...59
APPENDIX C: LIFE CYCLE GWP AND EMBODIED ENERGY OF INPUTS ...61
APPENDIX D: ACCELERATED DEPRECIATION TAX BENEFITS ...62
LIST OF FIGURES
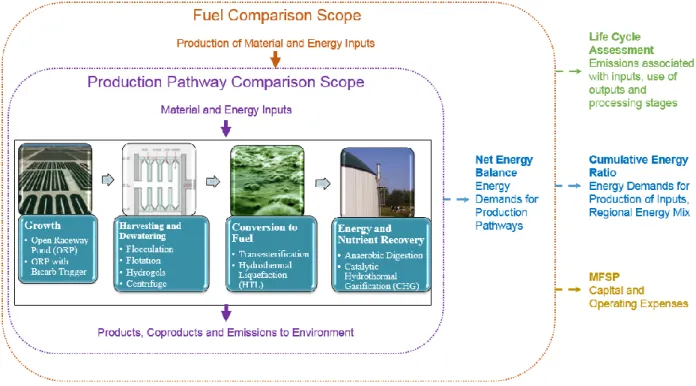
Figure 1. Integrated LCA/TEA Methodology ...7
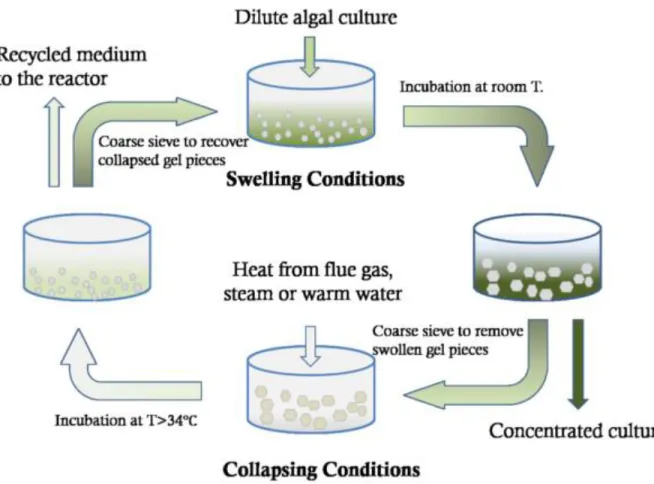
Figure 2. Hydrogel Dewatering (Zhao, 2015) ...15
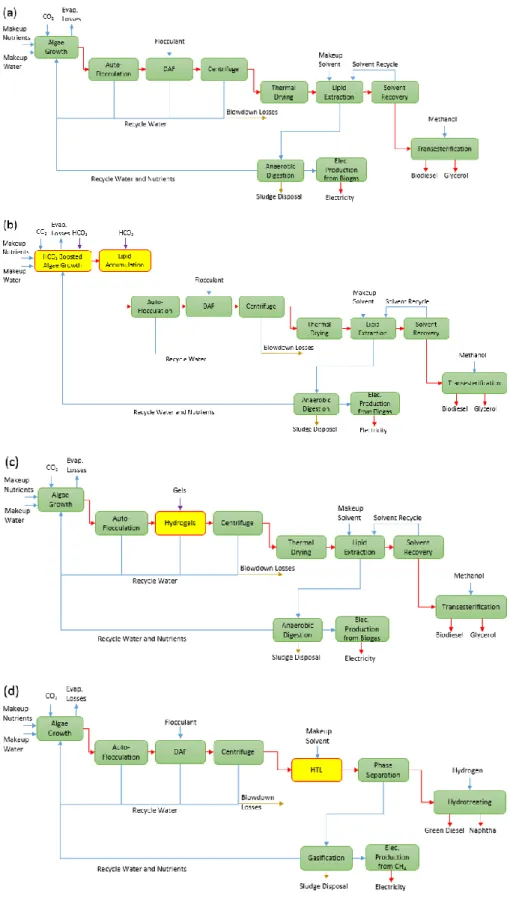
Figure 3. Processing Schematics for (a) Baseline Transesterification Pathway, (b) Transesterification with Bicarbonate-Induced Lipid Productivity Boost, (c) Transesterification with Hydrogels and (d) HTL Pathways ...20
Figure 4. Mechanism of Tax Savings from Accelerated Depreciation ...22
Figure 5. MFSP and CER for Transesterification and HTL Pathways ...29
Figure 6. Cumulative Energy Ratio Breakdown for Transesterification Pathways ...31
Figure 7. Embodied Energy Contributions for Transesterification Pathways ...32
Figure 8. Cumulative Energy Ratio Breakdown for HTL Pathways ...33
Figure 9. Embodied Energy Contributions for HTL Pathways ...34
Figure 10. Global Warming Potential for Transesterification and HTL Process Pathways ...35
Figure 11. MFSP Reductions from Stand-Alone Financing Improvements ...37
Figure 12. MFSP Impacts from Stand-Alone Processing and Financing Improvements to Baseline Pathway ...39
Figure 13. Combining Benefits of Technical and Financing Improvements ...40
Figure 14. MFSP Sensitivity of Transesterification Pathways ...41
Figure 15. Sensitivity of Transesterification and HTL Pathways to Electricity Generation Mix ...43
LIST OF ABBREVIATIONS AD Anaerobic Digestion
CER Cumulative Energy Ratio
CHG Catalytic Hydrothermal Gasification
CoC Cost of Capital
DAF Dissolved Air Flotation DAP Diammonium Phosphate
g CO2-eq Equivalent warming potential as grams of CO2 gge Gallon Gasoline Equivalent
GHG Greenhouse Gas
GREET Greenhouse Gases, Regulated Emissions, and Energy use in Transportation
HTL Hydrothermal Liquefaction
LCA Life Cycle Analysis LEA Lipid Extracted Algae LHV Lower Heating Value
MACRS Modified Accelerated Cost Recovery System MFSP Minimum Fuel Selling Price
ORP Open Raceway Pond PBR Photobioreactor
PTC Production Tax Credit RFS2 Renewable Fuel Standard
CHAPTER 1: INTRODUCTION
Greater urgency surrounding the environmental degradation associated with fossil fuel energy sources has prompted substantial research and investment in renewable energy platforms (National Research Council, 2012). While the electricity sector has seen marked increases in clean energy production (e.g. wind, solar), the transportation sector, which accounts for 28% of US demand, remains 95% reliant on petroleum (U.S. Energy Information Administration, 2014). Considering automotive fleet turnover cycles of 10 to 15 years (Samaras & Meisterling, 2008), as well as the infrastructural hurdles facing large scale adoption of electric or fuel cell vehicles, increased use of advanced biofuels provides the most feasible means of short-term transportation emissions reductions (Richard, 2010). Diverted food crops (e.g. corn, sugar cane, soybeans; “1st generation") and cellulosic non-food crops (e.g. switchgrass, miscanthus; “2nd generation”) have been of primary interest as biofuels feedstocks to date (Ho et al., 2014), though both have faced significant challenges related to such issues as competition for arable land and resources (e.g. food/forest vs. fuel) (Fargione, 2008) and unclear advantages in terms of environmental benefits over the product life cycle (Decicco, 2014). Producing biofuels from microalgae offers the potential to mitigate many of the challenges faced by crop-based biofuel production, thanks to several advantages conferred by efficient microbial processes and an increasingly closed-loop production system.
greater than switchgrass, currently the fastest growing terrestrial biofuel crop (Li et al., 2014). Oleaginous algae store energy in the form of lipids, which can comprise over 70% of cell biomass in certain strains and are readily converted into methyl esters (i.e. “biodiesel”) using established chemical processes (Chisti, 2007). These traits allow microalgae to produce 30 to 100 times more energy per hectare than terrestrial biofuel feedstocks (Kirrolia et al., 2013); cultivation can also occur on land ill-suited for agriculture, greatly reducing the competition for arable land posed by conventional biofuel crops (Clarens et al., 2010).
Furthermore, meeting the Energy Independence and Security Act (EISA, 2007) mandate of 1 billion gallons of biodiesel with algae would consume freshwater, nitrogen, and phosphate constituting 86%, 17%, and 104% of current national consumption (respectively), demands likely to be disruptive to other economic sectors (Yang et al., 2011). However, engineered systems for algal cultivation and biofuel production, while requiring significant capital investments, do allow for efficient recycling of resources, a key aspect in the design of commercially-feasible algal "biorefineries" (Rawat et al., 2013). Biomass not converted into liquid fuels (i.e. "residual biomass") retains significant portions of initial intracellular nutrients; further processing allows for biogas production (Frank et al., 2013; Nagarajan et al., 2013) and up to 65% of nitrogen and phosphorus to be recycled (Chowdhury et al., 2012) to increase economic competitiveness, improve the energetic balance, and limit resource demands.
towards sustaining algae production in many regions with optimal temperature (warm) and insolation (sunny), features that correlate with constrained water availability (Venteris et al., 2013).
While the recycling enabled by biorefineries is necessary for sustainable algal biofuel production, financing these capital intensive commercial-scale facilities (i.e. relative to agriculturally-derived biofuel feedstocks) has been impeded by the novelty of processing techniques and the commensurate uncertainty in cost estimates (Kirrolia et al., 2013). Systems analysis methods, especially techno-economic analysis (TEA) and life cycle analysis (LCA), provide a more accurate assessment of future economic and environmental potential (Quinn & Davis, 2014), better describing the operational risk faced by investors and thereby reducing barriers to investment. LCA uses energy and resource demands to quantify the life cycle
environmental impacts associated with each stage in a product’s life, from material extraction to disposal (Klöpffer, 1997). TEA utilizes energy and material inputs, facility costs, and financing assumptions to determine the economic potential of a considered pathway, measured in terms of a $ gal-1 selling price (Zhu et al., 2013).
These methods have been widely utilized to evaluate the performance improvements achievable through development of novel techniques for algal cultivation, harvesting/dewatering, extraction/conversion, and recycling processes (Collet et al., 2013; Quinn & Davis, 2014). Alternative sub-processes exhibit tradeoffs related to product yields, capital and operating expenses, and environmental impacts; using TEA/LCA models, sub-processes can be integrated into economically competitive, energetically beneficial, and environmentally sustainable
addressed uncertainty in financial factors embedded in economic models. Rather than being exogenous to production pathway design, these factors reflect perceived risk of reliance on processes untested at commercial scale and uncertain regulatory support (Resurreccion et al., 2012), and are therefore linked to biorefinery design and plant performance.
This work seeks to address several gaps in the literature by integrating technical process improvements and variable financing parameters into the performance evaluation of novel production sub-processes. A TEA/LCA model has been developed to evaluate commercially available unit operations, quantify the environmental impacts and production costs, and identify the best performing baseline pathway from which to determine relative process improvements. This baseline pathway is then used to determine the benefits of two novel operations: a
bicarbonate-induced lipid productivity boost developed by collaborators at Montana State University, and a dewatering process utilizing temperature sensitive “hydrogels” developed by collaborators at the University of Toledo. These operations are evaluated across a range of starting lipid contents and achievable growth rates, and in pathways using both transesterification and hydrothermal liquefaction (HTL) conversion techniques, in order to determine how up-and downstream factors influence relative benefits.
Financing parameters embedded in the economic model are varied to represent
accelerated depreciation methods, tax credits, guaranteed loans, and risk management strategies. The impact of these financing variations on economic competitiveness is compared with the improvements achievable through processing advances alone; financing and processing
CHAPTER 2: MATERIALS AND METHODS
Simultaneous evaluation of environmental, economic, and energetic metricsfor algal biofuel production pathways composed of alternative sub-processes allows systems designers to
select pathways that increase aggregate life cycle benefits (Delrue et al., 2012). Rigorous analysis of existing and emerging processing techniques identifies promising technologies for use in commercial scale facilities, thereby helping reduce, at a minimum, the operational risk of the significant capital investment required to scale up techniques (DOE, 2010). The
methodology for performing life cycle analysis (LCA) is well established (ISO 14040, 1997) and provides a useful framework for an integrated techno-economic and environmental analysis.
2.1 Life Cycle and Techno-Economic Framework
Inventories are developed for LCA which catalog the resource demands and
environmental emissions associated with process inputs and use of products (Klöpffer, 1997). Similarly, TEA inventories compile process yields, material and energy demands, and capital and operating expenses for the unit operations composing the production pathway (Quinn & Davis, 2014). The LCA inventory is translated into environmental impacts using an
environmental impact assessment methodology, which assigns an impact factor to each flow emitted to the environment from the system (ISO 14040, 1997). Inventory items for TEA are used to calculate energetic balances (e.g. input energy divided by fuel output energy) as well as the production costs for a production pathway (Zhu et al., 2013). Finally, interpretation
identifies uncertainty in the data utilized and assumptions embedded in the analysis which affect modeled results.
2.2 Integrated LCA/TEA Methodology
2.2.1 Goal and Scope of Analysis
A systems process model has been developed to examine the performance of an algal biorefinery producing a “functional unit” of 10 million gallons of biofuel (either biodiesel or renewable diesel) annually. This unit is chosen to enhance comparability with a recent, comprehensive TEA performed by Davis et al. (2011). The modular TEA/LCA model
Figure 1. Integrated LCA/TEA Methodology
level tradeoffs resulting from production process-level decisions (Decicco, 2014).
Environmental impact analysis has, similar to some previous analyses (Batan et al., 2010; Bennion et al., 2015; Liu et al., 2013), focused on the characterization of biorefinery global warming potential (GWP) and energetic balance. As per previous analyses, the energy and emissions associated with system construction are excluded as these are assumed to be similar for all the considered pathways and relatively small when evaluated over the facility lifetime (Batan et al., 2010; Frank et al., 2011). The benefits of an increasingly closed-loop production system (e.g. efficient recycling of input materials and energy, reduced emissions to the
2.2.2. Inventory
The net energy balance (NEB) is commonly used to compare the energy demands of similar processing pathways, calculated as the sum of energy demands for each unit operation divided by the energy embodied in the produced fuel (Slade & Bauen, 2013). The cumulative energy ratio (CER) includes in the numerator of the energy balance the indirect energy demands, including those required to produce the energy and material inputs to the process; this metric allows for comparability with other fuel production systems by accounting for upstream impacts of process inputs and energy (Huijbregts et al., 2010).
Using the methodology of Hill et al. (2006), biofuels produced are assumed to displace fossil fuels based on their net energy balance, resulting in a credit for avoided emissions that is subtracted from emissions from biofuel production. Pathway NEB is multiplied by lifecycle (i.e. production and combustion) emissions from diesel fuel and added to the pathway emissions; summed offset and pathway emissions are then divided by diesel emissions to calculate total pathway emissions as a percent of those from diesel fuel (Equation 1). Since the CO2 released from algal biofuels is sourced from industrial flue gas (at significant energy expense), biofuel combustion is “carbon neutral” as CO2 emitted was recovered from an atmospheric waste stream (Liu et al., 2013).
𝐺𝐻𝐺 [% 𝑜𝑓 𝐷𝑖𝑒𝑠𝑒𝑙] =𝐷𝑖𝑒𝑠𝑒𝑙 𝐸𝑚𝑖𝑠𝑠𝑖𝑜𝑛𝑠[ 𝑔 𝐶𝑂2𝑒𝑞
𝑀𝐽 ] × (1−
𝐸𝑛𝑒𝑟𝑔𝑦 𝑂𝑢𝑡𝑝𝑢𝑡𝑠
2.2.3. Impact Assessment
Global Warming Potential (GWP) is calculated by multiplying emissions (CO2, N2O, and CH4) from energy and material production by impact factors from the International Panel on Climate Change (2007), as utilized by the Greenhouse Gases, Regulated Emissions, and Energy Use in Transportation (GREET) model (GREET, 2011) to transform emissions into grams of CO2 equivalents (g CO2-eq). The emissions and energy associated with process inputs are obtained from GREET, other analyses, and industrial sources (see Appendix C for details). Unlike the biogenic CO2 recovered from flue gas, sodium bicarbonate represents a source of sequestered carbon, and thus combustion of biofuel from algae grown with this inorganic carbon addition incurs a GHG penalty equaling the g CO2-eq of sodium bicarbonate uptake.
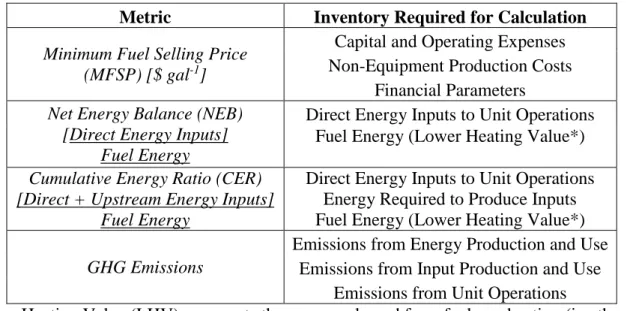
Table 1. Overview of Performance Metrics and Inventory Items
Metric Inventory Required for Calculation
Minimum Fuel Selling Price (MFSP) [$ gal-1]
Capital and Operating Expenses Non-Equipment Production Costs
Financial Parameters Net Energy Balance (NEB)
[Direct Energy Inputs] Fuel Energy
Direct Energy Inputs to Unit Operations Fuel Energy (Lower Heating Value*) Cumulative Energy Ratio (CER)
[Direct + Upstream Energy Inputs] Fuel Energy
Direct Energy Inputs to Unit Operations Energy Required to Produce Inputs Fuel Energy (Lower Heating Value*) GHG Emissions
Emissions from Energy Production and Use Emissions from Input Production and Use
Emissions from Unit Operations
*Lower Heating Value (LHV) represents the energy released from fuel combustion (i.e. the Higher Heating Value (HHV)) minus the energy of vaporized water; fuels combusted in vehicle or turbine engines are not able to condense and thus capture energy in vaporized water, making the LHV appropriate (Collet et al., 2013)
2.3 Biorefinery Processes and Sub-Process Alternatives
2.3.1 Algae Cultivation
Life cycle environmental and economic comparisons of algal cultivation alternatives, particularly open raceway ponds (ORPs) and enclosed photobioreactors (PBRs), have been a significant topic of research. Ponds have been used at commercial scale algal biofuel facilities due to their low capital and operating expenses (Rawat et al., 2013), though they suffer from high evaporative losses (Brennan & Owende, 2010), are at high risk for contamination from other microbes (Benemann & Oswald, 1996), and have low harvest densities as a result of suboptimal solar exposure due to poor culture mixing (Chisti, 2007). Enclosed PBRs have significantly greater capital expense, but allow for reduced contamination, increased
photosynthetic growth rates due to increased solar exposure, and temperature and pH control for maintenance of ideal growth conditions, which can reduce lifetime operating expenses (Molina Grima et al., 2003; Resurreccion et al., 2012). As capital expenses for PBRs have been often found prohibitively high for the production of low-value biofuels (Davis et al., 2011; Jorquera et al., 2010; Kirrolia et al., 2013), and high-value chemical production is outside the scope of this investigation, ORPs are the sole cultivation infrastructure considered in this analysis.
Nutrients are supplied to ORPs based on the algal stoichiometric coefficients from Williams & Laurens (2010), as described by the GREET model. Previous analyses have assumed a variety of nutrient sources, ranging from various chemical fertilizers (Collet et al., 2013) to utilization of waste streams (Chen et al., 2015; Orfield et al., 2014; Pittman et al., 2011). This analysis considers the use of diammonium phosphate (DAP) to meet all phosphorus demand (and some nitrogen demand) and ammonia added to meet residual nitrogen demand, with
Laurens, 2010) based on an 82% efficiency of uptake (Frank et al., 2011), and is assumed harvested from the flue-gas of a nearby power plant as per Davis et al. (2011).
2.3.1.1 Growth Scenarios
Achievable algal growth rates and lipid contents are widely disparate in the literature, and known to critically impact economic analyses (Collet et al., 2013; Quinn & Davis, 2014). Algal strain characteristics and growth rates have been shown to affect the relative performance of sub-process alternatives, impacting the choice of optimal growth reactor (Richardson et al., 2014) and conversion method (Clarens et al., 2011). The relative performance of bicarbonate-induced lipid productivity increases and hydrogel dewatering in all production pathways is therefore evaluated under two growth scenarios. The Department of Energy's Biomass Program developed a baseline growth framework by harmonizing results from national resource assessment
(Wigmosta et al., 2011), techno-economic (Davis et al., 2011) and life cycle (Frank et al., 2011) models of algal biofuels production pathways (Davis et al., 2012). The national average areal productivity for open pond systems was calculated as 13.2 grams algae m-2 day-1, and an extractable lipid content of 25% of dry algae by weight (henceforth referred to as wt%) was established; these characteristics are used to define the “Harmonized Growth” scenario for this analysis.
developed with an areal productivity of 32 g m-2 d-1 and a lipid content of 45%. To reflect the increased insolation and reduced temperature variability, the average ambient temperature in this scenario is increased from 23°C (assumed for the “Harmonized Growth” scenario) to 28°C (reflective of regions of the US Gulf Coast, Central America, the Middle East, and Southeast Asia).
2.3.1.2 Bicarbonate-Induced Lipid Productivity Boost
Efforts to boost oil production from algae have largely focused on nutrient stressing, as nitrogen depletion halts cell growth and induces the cell to store energy in the form of
accumulated lipids (Brennan & Owende, 2010; Lardon et al., 2009; Sheehan et al., 1998). However, boosting lipid content at the expense of growth rate can actually decrease the total lipid productivity (grams lipid produced m-2 d-1) and thereby the biofuel production potential, making this tradeoff between biomass productivity and lipid content undesirable (Brennan & Owende, 2010; Quinn & Davis, 2014).
Alternatively, recent work has shown that gains in total lipid productivity can be achieved through the addition of sodium bicarbonate (Gardner et al., 2013). The methodology (Appendix B) which is considered in this analysis begins with addition of low-grade sodium bicarbonate at low concentrations during growth, increasing the alkalinity of the growth medium and the driving force for gaseous CO2 dissolution into the aqueous phase, resulting in greater dissolved inorganic carbon uptake rates by biomass (Markou et al., 2014). This initial addition has been shown to increase the specific growth rate by 69%, leading to an overall increase of 27% in biomass productivity (Lohman et al., 2015). A second, higher concentration addition of sodium bicarbonate occurs as nitrogen is depleted, halting cell growth and inducing further lipid
8%; together with the increased biomass productivity, an increase of lipid productivity of over 37% is achievable. This two phase sub-process has been included in selected pathways in the cultivation process, with the first addition occurring during open pond cultivation, followed by nitrogen depletion and the second bicarbonate addition in a separate lipid accumulation tank.
2.3.2 Dewatering and Drying
Conventional dewatering methods examined include settling via autoflocculation (to 1 wt% solids content), dissolved air flotation (DAF, to 6 wt%), filter pressing (to 20 wt%), and centrifugation (to 25 wt%); such mechanical methods are most efficiently utilized in series to dewater the harvested algal slurry prior to extraction and conversion (Xu et al., 2011). These processes have been incorporated into this model based on the unit operations defined in the Algae Process Description developed for the GREET model (Frank et al., 2011) and from industrial sources (see Appendix A). If downstream sub-processes require more algal slurries with less than 75% water content for efficient biofuel conversion, natural gas drum drying is used. Water removed from mechanical dewatering operations in the modeled system is returned to cultivation to reduce external water demands.
2.3.2.1 Hydrogel Dewatering
10°C temperature increase causes the gels to shrink (Figure 2). Given that this temperature shift can occur between 32°C and 35°C, it is anticipated that waste heat might be employed to reduce de-swelling energy demands (Zhao, 2015). Testing has shown minimal degradation of hydrogel performance over 100 swelling/de-swelling cycles, and commercial scale costs and efficiencies have been extrapolated using this material lifetime (Vadlamani, 2014). As with the mechanical dewatering processes, water recovered from the hydrogels after de-swelling is collected and recycled to cultivation ponds to reduce net water demands.
2.3.3 Extraction and Conversion
Transesterification has been considered the most viable pathway to produce environmentally beneficial biofuels from vegetable oils (Kirrolia et al., 2013), and is used commercially for conversion of soy, canola, palm and waste oils into biodiesel. In conventional transesterification processes, lipids are extracted from algal cells and reacted with an alcohol (e.g. methanol) to form fatty acid methyl esters, or “biodiesel” (Rawat et al., 2013). The small size of algal cells makes mechanical extraction (used to remove oils from vegetable feedstocks) of accumulated oils challenging; most analyses have assumed the use of an organic solvent to remove oils for conversion (Collet et al., 2013). Efficient extraction of cellular lipids requires biomass inputs with less than 15 wt% water, or 850 grams dry biomass L-1 (Xu et al., 2011). Thermal drying is required to evaporate intracellular water and reach concentrations greater than 400 grams biomass L-1, a step that can account for 75% of the direct energy input to the production process (Vasudevan et al., 2012). Numerous studies have examined oil-extraction methods that limit the thermal drying requirement, including “wet” solvent extractions (e.g. capable of using slurries with less than 40 wt% solids content) (Brennan & Owende, 2010; Delrue et al., 2012; Kirrolia et al., 2013; Lardon et al., 2009; Quinn et al., 2014; Ríos et al., 2013; Torres et al., 2013; Vasudevan et al., 2012; Zaimes & Khanna, 2013) as well as one step direct transesterification of “wet” algal slurries into biodiesel (Delrue et al., 2013; Nagarajan et al., 2013; Patil et al., 2011; Ríos et al., 2013; Torres et al., 2013).
2.3.3.1Thermochemical Conversion
hydrothermal conversion methods can utilize a slurry with roughly 20 wt% solids content, greatly reducing or eliminating the thermal drying requirement (Frank et al., 2013). Of these, hydrothermal liquefaction (HTL) has shown the most promise for liquid biofuel production (López Barreiro et al., 2013a). Pilot scale HTL tests show conversions of over 60% of cell biomass into useable fuels (Liu et al., 2013), with fuel yields consistently greater than cellular lipid content (Duan et al., 2015) suggesting that maximizing biomass productivity (rather than lipid productivity) in the cultivation stage might be more appropriate when utilizing HTL (Elliott et al., 2013). Broader acknowledgement of the impact of conversion method on the choice of optimal cultivation techniques (Liu et al., 2013; López Barreiro et al., 2013b; Torres et al., 2013) and implications for dewatering techniques (Ríos et al., 2013), make it worthwhile to model the incorporation of novel growth and dewatering techniques into pathways using different
conversion methods.
An HTL pathway has been included in this analysis, with modeling based upon published data scaled to the functional unit of this analysis (Appendix A) (Bennion et al., 2015; Frank et al., 2011; Jones et al., 2014). This technique is then used in an examination of the benefits of incorporating the bicarbonate-induced lipid productivity boost and hydrogel dewatering into pathways based around this conversion method. HTL-based pathways have been shown to increase capital expenses while decreasing annual operating expenses relative to
2.3.4 Nutrient and Energy Recycling
Anaerobic digestion (AD) has been proven effective for nutrient and energy recovery from lipid-extracted algae (LEA) (Davis et al., 2011), and thus has been modeled as a means of producing biogas from the residual biomass in transesterification pathways. The aqueous phase from AD reactors has high levels of nitrogen and phosphorus which have been shown to support algal growth when returned to ORPs (Bohutskyi et al., 2015). Aqueous phase recycle from AD is examined to determine cost savings from net fertilizer and water demand reductions.
The hydrothermal degradation of intracellular protein results in carbon to nitrogen ratios in HTL aqueous phase which render it unsuitable for anaerobic digestion (Frank et al., 2013). Researchers have examined alternative methods for recycling of nutrients and carbon within the production system; among these, catalytic hydrothermal gasification (CHG) has proven an efficient method for recycling of HTL inputs (Elliott et al., 2013), and recovery via this technique is considered in this analysis. Frank et al. (2013) note that comparison of HTL and transesterification processes must consider the quality of the produced biofuel, as the higher nitrogen and oxygen content in HTL bio-oil renders it unsuitable for direct use in engines. The engineering system model used for this TEA therefore includes a hydrotreating process to reduce nitrogen and oxygen content in the produced bio-oil, such that the end product is a renewable diesel chemically identical to petroleum diesel (Jones et al., 2014).
2.4 Baseline Pathway Development
which novel operations would be incorporated, and from which relative performance benefits would be determined. The major processing pathways are:
- Baseline Pathway: auto-flocculation, dissolved air flotation (DAF) and Evodos™ centrifuges for dewatering, transesterification and anaerobic digestion of lipid-extracted algae to recover nutrients and energy (Figure 3a)
- Bicarbonate-Induced Lipid Productivity Boost: Two-phase addition of sodium bicarbonate, in the growth reactor to boost biomass productivity and in a lipid accumulation tank following harvesting (Figure 3b)
- Hydrogel Dewatering: hydrogels are considered to replace DAF, and are capable of concentrating the slurry to 10 wt% (100 g L-1) instead of the 6 wt% capable via DAF (Figure 3c)
- Hydrothermal Liquefaction (HTL): high pressure HTL reactors replace the
transesterification reactor, followed by phase separation to isolate the oil phase for upgrading in a hydrotreating reaction. The aqueous phase is sent to a catalytic hydrothermal gasification process, where ammonia, biogas and water are collected and recycled onsite (Figure 3d).
The Baseline and HTL pathways are each evaluated with the bicarbonate-induced lipid
Figure 3. Processing Schematics for (a) Baseline Transesterification Pathway, (b) Transesterification with Bicarbonate-Induced Lipid Productivity Boost, (c) Transesterification
2.5 Economic Analysis
2.5.1 Financial Factor Uncertainty
Financial assumptions embedded in economic analyses represent a significant source of uncertainty for feasibility analyses (Quinn & Davis, 2014), as these factors are subject to change due to federal or state policies as well as managerial decisions. The cost of capital (CoC), or interest rate on debt, is the rate charged on capital used to finance the biorefinery. This rate increases with the perceived risk of the project; managerial strategies to mitigate exposure to market, technology, and operational risks can decrease the CoC and therefore decrease the cost of manufacturing (Michelez et al., 2011). Additionally, federal programs such as the DOE's Loan Guarantee sponsorship allow advanced biofuel producers to borrow capital at rates below what might otherwise be possible given the perceived operational risk (Yacobucci, 2011). Managerial steps taken to mitigate upstream (e.g. variable input costs), operational, and downstream risks (e.g. uncertain value and volume demanded of outputs) can also reduce the project cost of capital (Lamers et al., 2015). Assuming the facility is financed 100% with debt (as opposed to a mix of debt and equity), biorefinery MFSP has been calculated under three CoC scenarios:
1. CoC of 8%, representing a typical financing scenario (the baseline financing assumption);
2. CoC of 6%, representing a scenario wherein steps have been taken to mitigate operational or market risk exposure; and
The depreciation method used for the MFSP calculations is also impacted by regulatory policies designed to support renewable fuels. Used to account for the loss in the value of capital assets over time, the depreciation charge is a percent of total capital expenses that is deducted from the taxable income of a company (IRS, 2015). Straight line depreciation, used for the baseline financial analysis, is calculated by dividing the total depreciable capital expenses by the asset lifetime, such that an equal charge is applied annually until the end of its useful life, at which point it is considered valueless. Accelerated depreciation methods are allowed as a means of incentivizing the purchase of certain types of assets (US PREF, 2014). A simple illustration of the depreciation of a hypothetical $300M asset via an accelerated method is presented in Figure 4. As opposed to straight line depreciation (green columns), accelerated depreciation methods instead allow larger depreciation charges (blue columns) early in the asset life, leading
Figure 4. Mechanism of Tax Savings from Accelerated Depreciation
and straight line depreciation allowances is positive for the span of the accelerated period, then becomes negative as straight line charges remain constant and accelerated charges drop to zero.
In undiscounted terms, lifetime depreciation charges are equal under both depreciation methods; however, accounting for the time value of money with a discount rate, near term tax savings become worth more than long-term tax liabilities, and the net discounted value of these savings (red area) increases project value (US PREF, 2014). 7-yr Modified Accelerated Cost Recovery System (MACRS) depreciation and Bonus depreciation (Appendix D) methods have been substituted for the straight line method to evaluate the impact on MFSP calculations for all production pathways and growth scenarios.
The updated (EISA, 2007) Renewable Fuel Standard (RFS2) sets minimum volumes of biofuels which must be blended by refineries, supporting both the volume demanded and market value of biofuels (Yacobucci, 2011) and thereby helping producers mitigate offtake risk and secure financing (Miller et al., 2013). Additionally, this policy established a $1.01 gal-1 production tax credit (PTC) for biomass-based diesel fuel with life cycle GHG emissions less than 50% those of petroleum diesel (enacted in 2007 and sporadically extended since (RFS2, 42 U.S. Code 7545(o)). The impact of this tax credit on the calculated MFSP of production pathways that meet the required emissions reductions has been evaluated; the relative benefits of these biorefinery financing improvements (e.g. risk management strategies, accelerated
2.5.2 Economic Assumptions
Equipment costs have been calculated using the CapCost™ software (Turton et al., 2008) or scaled from published analyses; Appendix A contains sources of technical operation details, capital and operating expenses for production pathway equipment. Recent design reports have developed economically competitive HTL production pathways to produce renewable drop-in fuels from either whole-cell (Jones et al., 2014) or lipid extracted algae (Davis et al., 2014); these reports have been used to calculate scaled capital costs for the HTL pathway. The methodology of Delrue et al. (2012) was utilized to calculate initial and non-equipment operating expenses; these factors, as well as the baseline parameters used for the MFSP calculation are outlined in Table 2.
Table 2. Overview of Economic and Base Financial Analysis Factors (Delrue et al., 2012) Initial Expenses
Maintenance Costs 35% of Capital Expenses Engineering Costs 15% of Capital Expenses Spare Parts 15% of Capital Expenses
License Fees $650,000
Initial Expenses 2% of Capital Expenses Start Up Costs 25% of Operating Expenses Depreciable Capital Initial Expenses + Capital Expenses
Non-Operating Annual Expenses
Labor Cost 10000000*(Capital Expenses/(10000000*500)0.2 Other Costs 0.9% of Capital Expenses
Maintenance Costs 4% of Capital Expenses Business Expenses 1% of Capital Expenses
Base Financial Parameters
Discount Rate 8%
Lifetime 20 Years
Tax Rate 35% of Operating Income
Depreciation Method Straight Line
Cost of Capital (CoC) 8%
2.6 Interpretation
2.6.1 Distribution of Impacts
Significant uncertainty exists in the literature regarding the proper method for distributing impacts of production systems between multiple outputs (Quinn & Davis, 2014). Allocation spreads the burdens between all of the outputs, based on the mass, economic, or energetic value of each (Collet et al., 2013). The international LCA standard (ISO 14040, 1997) suggests avoiding the uncertainty involved in burden distribution, advocating instead that the system boundary be expanded to include the life cycle of other systems affected. The system, including the production of all outputs, substitutes for traditional coproduct production systems; this "substitution" method then assigns a credit to the system representative of the energy, costs, or emissions (depending on the scope) associated with the avoided traditional coproduct production process (Finnveden et al., 2009).
The transesterification pathways produce biodiesel, lipid extracted algae (LEA), and glycerol in proportions based on the cellular composition of the algae. LEA is utilized onsite for energy and nutrient recovery through anaerobic digestion (AD), thereby reducing net energy and fertilizer demands for the pathway. Catalytic hydrothermal gasification (CHG) of the nutrient-rich aqueous phase from HTL reactions reduces nitrogen to ammonia while producing biogas for energy recovery (Liu et al., 2013). Recovered ammonia and biogas from the CHG reactor are recycled within the biorefinery to reduce external energy and fertilizer demands. Reduced resource demands make these pathways favorable (e.g. economically, energetically, and
Onsite recycling has been proposed for glycerol, for enhanced biofuel production via fermentation (Akiyama et al., 2003), boosting algal productivity via mixotrophic growth
(Cabanelas et al., 2013), or as a co-firing material to generate bioelectricity on-site (Batan et al. , 2013). Rather than considering the uncertainties surrounding such on-site uses, glycerol has been regarded as a substitute for biomass co-fired for bioelectricity offsite, generating a credit based on its LHV (Koutinas et al., 2014; Ponnusamy et al., 2014).
2.6.2 Limitations
The nascent stage of the cultivation and conversion technology often necessitates the use of data extrapolated from the bench scale to commercial scale feasibility assessments, reducing certainty in modeled performance estimates (Collet et al., 2013). The National Algal Biofuels Technology Roadmap (DOE, 2010) notes that extrapolated data should be treated with caution, but points out that qualitative trends emerging from modeling efforts can be highly useful for guiding technical, economic and policy decisions. HTL modeling has been developed using processing parameters from Frank et al. (Frank et al., 2011), with hydrotreating parameters as well as capital and operating expenses scaled from Jones et al. (2014) to match the functional unit of this analysis. Inclusion of this conversion method is intended not to develop high resolution results for MFSP, CER, or GHG emissions, but rather to examine the potential differences in the impact of incorporating novel sub-processes into pathways based around different conversion methods.
Relative to agriculturally-based 1st and 2nd generation biofuels production systems,
artificially low impact (Clarens et al., 2010). The limited scope of environmental impact assessment, while appropriate for the goals of this analysis, may skew comparisons with other fuel cycles. To observe environmental benefits relative to terrestrial biofuel production systems, which have considerable land use change, water demands, and eutrophication impacts (Clarens et al., 2011), a full life cycle analysis including these factors would be required, which is beyond the scope of this project.
2.7 Analysis Overview
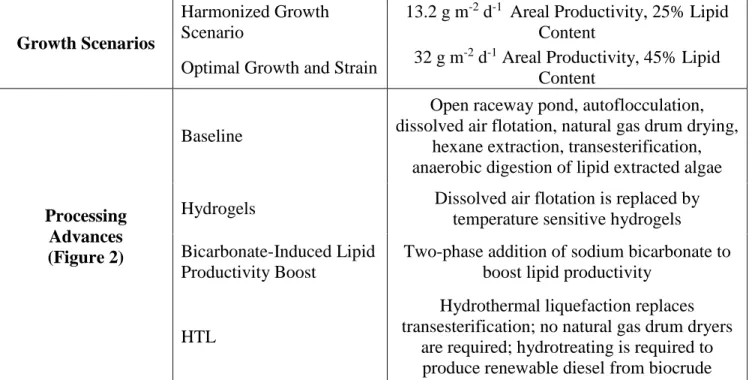
An overview of the growth scenarios, processing advances, and the variable financing parameters that are modeled in the described methodology is provided in Table 3. Processing pathways evaluated each novel technique alone as well as in series with other novel techniques, under both growth scenarios, and with stand-alone as well as cumulative changes to the
financing parameters.
Table 3. Production Pathway Growth Scenarios, Processing Advances, and Financing Parameters
Growth Scenarios
Harmonized Growth Scenario
13.2 g m-2 d-1 Areal Productivity, 25% Lipid Content
Optimal Growth and Strain 32 g m
-2 d-1 Areal Productivity, 45% Lipid Content
Processing Advances (Figure 2)
Baseline
Open raceway pond, autoflocculation, dissolved air flotation, natural gas drum drying,
hexane extraction, transesterification, anaerobic digestion of lipid extracted algae Hydrogels Dissolved air flotation is replaced by
temperature sensitive hydrogels Bicarbonate-Induced Lipid
Productivity Boost
Two-phase addition of sodium bicarbonate to boost lipid productivity
HTL
Hydrothermal liquefaction replaces transesterification; no natural gas drum dryers
Variable Financing Parameters
MACRS Depreciation
7-year MACRS depreciation schedule replaces straight line depreciation for calculation of
income tax; deferred tax assets increase economic potential of project
Bonus Depreciation
50% of depreciable capital is deductible in the first year of operations, followed by 7-year MACRS for remainder of depreciable capital
Production Tax Credit (PTC)
Pathways with life cycle GHG emissions < 50% of conventional diesel receive a $1.01 gal
-1 tax credit, which directly reduces the tax liability; deferred tax assets accrue if credits
are greater than current liabilities 6% / 4% Cost of Capital
(CoC)
Cost of capital reduction to 6% from 8%, represents actions taken to mitigate project risks; reduction to 4% represents guarantee of
CHAPTER 3: RESULTS 3.1 Processing Improvements
3.1.1 Economic and Energetic Performance
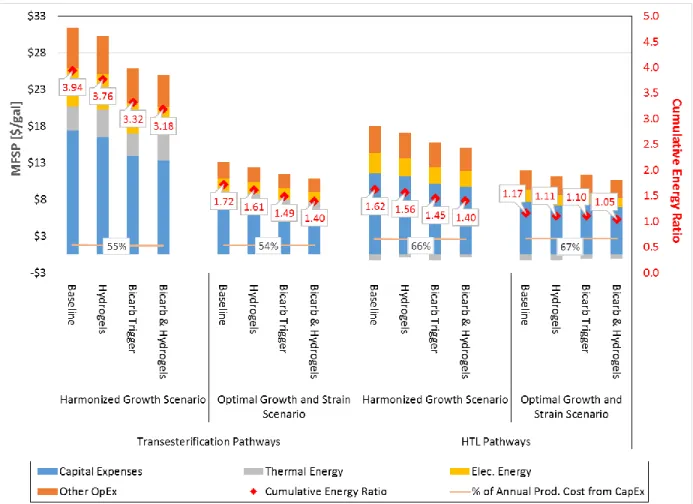
The calculated minimum fuel selling price (MFSP) and cumulative energy ratio (CER) for the four processing pathways for both conversion methods (e.g. transesterification and HTL) under the “Harmonized Growth” and “Optimal Growth and Strain” scenarios are displayed in Figure 5. Incorporation of hydrogel dewatering results in minor relative reductions (from the given growth scenario and conversion method) from the baseline MFSP for both
transesterification scenarios (3.7% and 5.4% for Harmonized and Optimal, respectively) and both HTL scenarios (2.8% and 3.8%). CER reductions from hydrogel use are in the same range, at 4.4%, 6.3%, 3.4%, and 5.3% for the Harmonized transesterification, Optimal
Transesterification, Harmonized HTL, and Optimal HTL, respectively. Dewatering energy constitutes a larger fraction of overall energy demand in transesterification pathways and in higher lipid productivity growth scenarios, contributing 14% and 19% of total energy input in Harmonized and Optimal Growth transesterification pathways (respectively) versus less than 9% in all HTL pathways. Reducing dewatering energy demands with hydrogel incorporation
Figure 5. MFSP and CER for Transesterification and HTL Pathways
Bicarbonate-induced lipid productivity boosts have greater relative energy and monetary savings for the transesterification based pathways, with CER reductions of 15.6% and 13.5% and MFSP reductions of 18.5% and 12.9% for Harmonized and Optimal Growth scenarios,
for conventional dewatering results in further economic and energetic improvements, though none of the production pathways are able to reach energy parity (e.g. energy inputs + embodied energy = energy in outputs; CER = 1) (Figure 5).
The catalytic hydrothermal gasification (CHG) of HTL aqueous phase produces more biogas than is required to produce thermal energy for the pathway; substitution offsite for this net thermal energy production generates energetic (CER offset equaling 17% of renewable diesel energy content) and monetary credits (MFSP offset of 4% shown by the negative MFSP contribution in Figure 5) for these systems. Conversion via HTL reduces the overall energy inputs and cost of production, while the percent of the production cost coming from capital expenses (i.e. “debt service”) slightly increases, as shown by the orange lines in Figure 5.
Biorefineries using transesterification to produce biofuels generate glycerol, as a
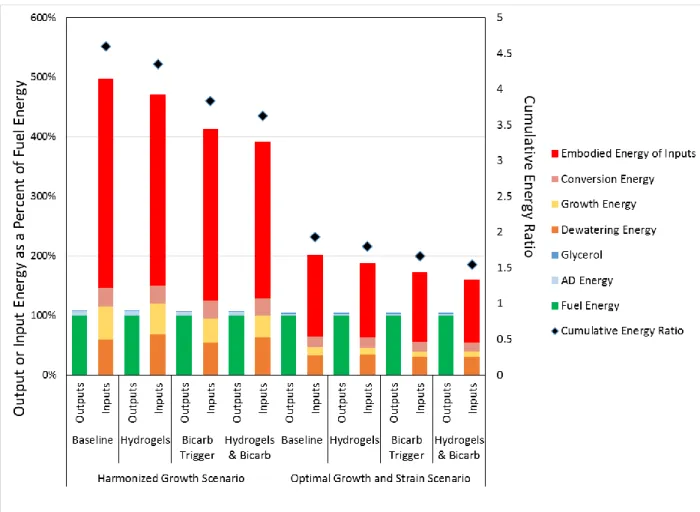
Figure 8. Cumulative Energy Ratio Breakdown for HTL Pathways
As with the transesterification pathways, the energy required to produce electricity represents the greatest contribution to the embodied energy for all HTL pathways in both growth scenarios, followed by the embodied energy of capturing and transporting industrial-effluent CO2 (Figure 9). However, hydrogen production (from natural gas reforming) has a significant
Figure 9. Embodied Energy Contributions for HTL Pathways
3.1.2 Environmental Performance
Global warming potential (GWP) relative to the life cycle GWP of conventional diesel has been calculated based on the net energetic gains, material and energy inputs for each production pathway and growth scenario (see Appendix C). Based on the US national average electricity generation mix (GREET, 2011), emissions from the electricity usage represent the largest contribution to global warming potential (Figure 10). The thermal energy demands for transesterification-based pathways (66% and 73% from dewatering for the Baseline and
Figure 10. Global Warming Potential for Transesterification and HTL Process Pathways
pathways using this conversion method, with nitrogen fertilizer the second largest addition under both growth scenarios. While the Baseline pathway has GWP 6x greater than that of petroleum diesel, improvements from incorporation of novel operations are visible.
The increased thermal energy demand resulting from replacing DAF with hydrogels is muted by the increased cell retention efficiency of hydrogels (relative to DAF) which reduces the total biomass throughput (and therefore material and energy inputs) required for production of 10 million gallons of biodiesel; hydrogel incorporation results in an 8% decrease in GWP compared to the Baseline. Use of the bicarbonate-induced lipid productivity boost results in a 20%
thermal energy for the transesterification pathways in this scenario, result in GWP reductions ranging from 64% to 73% of the Baseline pathway. These reductions are greater than those achieved by using HTL under the Harmonized Growth scenario (44% reduction from Baseline).
As HTL pathways are more energetically beneficial (i.e. smaller CER) than
transesterification pathways, they displace higher levels of fossil fuels; this greater displacement explains how the Harmonized Growth HTL pathways, which have greater pathway GHG
emissions than the Optimal Growth and Strain transesterification pathways, actually realize greater GWP reductions. These findings corroborate the findings of the embodied energy
calculations (Figure 9) in emphasizing the negative impacts of virgin hydrogen gas and ammonia use in HTL pathways, though warming potential is dominated by electricity use. The Optimal Growth and Strain HTL pathway with bicarbonate addition and hydrogels for dewatering is the most environmentally beneficial, reducing GWP by 32% relative to petroleum diesel, though this still fails to meet the 50% reduction required to qualify for the $1.01 gal-1 production tax credit under the Renewable Fuel Standard (Yacobucci, 2011)
3.2Financing Improvements
The economic potential of each production pathway, under both growth scenarios, was reevaluated (from the base analysis using straight line depreciation and an 8% cost of capital) with financing scenarios reflecting both:
1. Policy incentives impacting production costs, including: - MACRS and Bonus Depreciation methods
- Federally-backed loan guarantees ensuring a 4% cost of capital (CoC); and 2. Risk mitigation techniques allowing a CoC reduction to 6%
As the pathways considered failed to meet the 50% GHG emissions reduction required to qualify for the PTC, this policy has no impact on the economic competiveness of any pathway (Figure 10). MACRS and Bonus depreciation methods generate MFSP reductions in
transesterification pathways of 11% and 13% (respectively) versus MFSP reductions of 15% and 18% (respectively) for HTL-based pathways (Figure 11). Reducing the CoC to 6% (from the assumed 8%) allows the MFSP to be reduced 8% for transesterification pathways and 10% for HTL pathways. Further cost of capital reduction to 4% results in MFSP reductions of 14% for transesterification pathways and 20% for HTL pathways.
Calculated MFSP reductions from accelerated depreciation methods and reduced cost of capital exhibit high correlations (r2 > .91) with the percent of the annual production cost that comes from capital expenses (i.e. payments made on the capital borrowed to construct the facility (“debt service”)). Deferred tax assets (see Appendix D), which increase the lifetime value of facilities using accelerated depreciation methods, are calculated on the basis of the asset’s depreciable capital; savings increase linearly with this capital expense. Likewise, the cost of capital is used to calculate the annual payment required on borrowed capital, therefore the savings from lowering this rate increase with greater amounts of borrowed capital. Therefore, when sub-process alternatives offer a tradeoff between capital and operating expenses, it follows that pathways with a higher annual capital expense to operating expense ratio receive greater benefits from accelerated depreciation methods and reduced cost of capital.
3.3Relative Impact of Technical Optimization and Financing Improvements
Figure 12. MFSP Impacts from Stand-Alone Processing and Financing Improvements to Baseline Pathway
operating the Baseline pathway where the Optimal Growth characteristics are achievable with a high lipid-producing algal strain (MFSP reduction of 60%).
3.4 Combining Processing and Financing Improvements
Figure 13. Combining Benefits of Technical and Financing Improvements
hydrogels in the Optimal Growth and Strain scenario result in MFSP, CER, and GWP reductions of 36%, 27%, and 57%, respectively. Reducing the CoC to 4% and using Bonus depreciation results in a MFSP reduction of 66% from the Harmonized Growth HTL pathway with baseline financial assumptions. These cumulative processing and financing improvements to processing pathways highlight that production pathways utilizing transesterification can be competitive with HTL-based pathways under certain circumstances.
3.5 Sensitivity Analysis
evaluation of novel processing techniques. As mentioned in Section 2.7.2, there is potential for uncertainty in the inputs embedded in the model, especially the capital and operating expenses as well as resource demands of processes untested at commercial scale, to impact modeled
performance. The impact of single parameters embedded in the TEA/LCA model was analyzed by varying factors above and below the assumed value and examining the impact on
performance metrics. Seven factors were identified as having significant impacts on process economics (Figure 14); these impacts were found to be similar between pathways of differing composition.
While uncertainty in these factors may slightly skew model results, the MFSP shows less than 5% sensitivity to any single change in input value. The model was most sensitive to annual
Figure 14. MFSP Sensitivity of Transesterification Pathways
equipment (i.e. open raceway ponds, autoflocculation tank, and conversion reactor) and the cost of CO2 (the largest contributor to material operating expenses) resulted in only slight impacts on pathway MFSP.
Noting that the electricity demand represented the largest contribution to the life cycle GWP and embodied energy inputs for the modeled pathways, the relationship of these impacts on the regional electricity generation mix was evaluated. California and Montana were chosen to illustrate generation mixes varying from the national average (Table 4); while Montana’s energy mix slightly increases the GWP of both transesterification and HTL pathways, the embodied energy is similar to that of the national average mixture, and shows no discernable impact on pathway CER. However, sourcing electricity from California decreases the transesterification global warming potential over 100% compared to the national average electricity mix, and reduces the CER by 4%.
Table 4. Sources of Electricity Generation
* Includes hydroelectric, geothermal, wind, solar, biogas 1 EIA, 2013
2 GREET, 2011
Oil NG Coal Nuclear Others*
Embodied Energy [kWh input/ kWh
output]
GHG Emissions [g CO2-eq/kWh]
Montana1 6% 2% 54% 0% 38% 3.1 1063.4
U.S. Ave.2 1% 23% 46% 20% 10% 2.3 608.3
Figure 15. Sensitivity of Transesterification and HTL Pathways to Electricity Generation Mix
CHAPTER 4: DISCUSSION
4.1 Considering Sub-Process Decisions within Financing Environment
The simultaneous gains achievable through cumulative improvements to production pathway efficiency and financing show the potential for algal biofuels to approach economic competitiveness with fossil alternatives, achieve substantial (even net negative) reductions in GHG emissions, and minimize fossil energy inputs required to generate renewable transportation fuels. Given the demonstrated interconnectedness of the physical environment and strain
characteristics (i.e. site-specific temperature and insolation impacting achievable lipid
productivity), downstream operations and financing parameters on the relative performance of processing advances, potential advances in sub-processing efficiency should be evaluated within a much larger context than has traditionally been performed. This framework should include the geographic constraints of the proposed site (e.g. average temperature, annual insolation),
prevailing financing parameters (e.g. use of accelerated depreciation methods, availability of tax credits and loan guarantees, risk perception of private investors), and efficacy with alternative up-and-downstream unit operations (e.g. different cultivation techniques, conversion methods). Additionally, sensitivity of system performance to the electricity generation mix dictates that this parameter be of special consideration when evaluating potential biorefinery sites.
and uncertainty of policies impacting biorefinery financing suggest that there will be no “cookie-cutter” designs which optimize economic, energetic and environmental performance in all circumstances, but instead strategic designs tailored to the proposed biorefinery.
4.1.1 Risk Mitigation Perspective
A significant hindrance to investment in algal biorefineries is the operational risk associated with processes unproven at commercial scale (UNEP, 2004). Biodiesel production via transesterification is a well-established process; a biorefinery using this conversion technique may well be able to reduce the cost of capital below that available for financing a commercially-untested thermochemical process (e.g. HTL). From a biorefinery developer’s perspective, results of this analysis indicate that HTL pathways outperform transesterification pathways in all
performance metrics under the Harmonized Growth scenario (Figure 13). If two sites were under consideration for biorefinery development, transesterification-based systems with bicarbonate addition and hydrogels operating where the Optimal Growth and Strain scenario is achievable exhibit comparable energetics, 22% lower GWP, and a MFSP 35% less than that of the Harmonized Growth HTL pathways. Moreover, in evaluating pathways for a site where the Optimal Growth and Strain scenario is achievable, if the cost of capital reflects the lowered perceived operational risk and is therefore lower for a transesterification-based facility than one utilizing HTL, transesterification-based biorefineries can achieve MFSPs competitive with HTL-based operations.
can both identify potential life cycle challenges as well as provide estimates of scaled
performance to reduce perceived operational risk. Thus, while financing parameters have been widely regarded as exogenous variables in previous techno-economic analyses, these factors critically impact the calculated economic viability in such studies. It is also important to note that failing to link financing parameters to the risks associated with biorefinery operations and available incentives is likely to generate erroneous results.
Algal biorefineries face a unique set of risks relative to those posed by conventional refineries; while petroleum refineries face market risk with volatile input prices (i.e. crude) and output (e.g. gasoline, diesel) prices, biorefineries are likely to face less exposure to volatile input prices, and therefore reduced susceptibility to market risk (Michelez et al., 2011). Policies such as the RFS2 and state-level mandates requiring refineries to blend biofuels into gasoline and diesel ensure a market for biorefinery products, effectively mitigating output market risk
providing both offtake certainty (i.e. obligating refiners to purchase biofuels ensures customers) and price support (producers are able to sell biofuel above the price that customers would normally be willing to pay) (Miller et al., 2013). Mitigation of output market risk via such policies, along with the reduced susceptibility to input price risk, could allow biorefineries to secure long-term margins with input contracts (setting the price of inputs) and offtake
agreements (setting the volume and selling price of products) that are viewed as critical to securing low cost financing (Einowski et al., 2006).
4.2 Improving CER by Reducing Embodied Energy of Inputs
energy from production and use of chemical fertilizers, hydrogen, and energy inputs substantially reduce the performance of process pathways. Electricity production, based on the US national average generation mix (GREET, 2011) represented the largest single contribution to pathway embodied energy and global warming potential for all pathways. Reducing these impacts could be achieved, as was illustrated by pathway evaluation using the CA generation mix, through switching to more efficient, cleaner sources (e.g. replace coal generation with natural gas
combined cycle) or through the use of renewable energy. Renewable sources tend to have higher embodied energy (GREET, 2011) than conventional energy sources, negatively impacting the cumulative energy ratio; the fossil energy ratio (i.e. fossil fuel input energy/biofuel output energy) has proven useful for evaluating fuel cycles using renewably-sourced energy (Davis et al., 2013).
4.3 HTL Upgrading Energy
The hydrothermal liquefaction model used for this analysis recognized no energetic impact due to changing feedstock lipid content, and only modest impacts on process economics due to nutrient recycling efficiency impacts. While this coincides with previous findings
emphasizing the focus on increased biomass productivities over lipid content for thermochemical conversion methods (Elliott et al., 2013), the impact of cellular composition on HTL oil quality has recently been the topic of increased research (López Barreiro, Zamalloa, et al., 2013). Incorporation of cellular nitrogen into HTL oil causes the oil phase to require upgrading prior to use as a transportation fuel (Frank et al., 2013). Algae with low lipid content have higher protein and carbohydrate contents; strains with especially high protein content have been shown to produce higher levels of nitrogen in the HTL aqueous products (Li et al., 2014), and therefore may require greater energy and cost to upgrade. Further investigation of the life cycle impacts of low-lipid containing algae is required to determine how cellular composition is linked to energy required to produce a useable fuel.
4.4 Future Work
contamination of culture), such that PBRs are more financially viable than ORPs (Richardson et al., 2014). The decreased financial risk from higher reliability biomass yields and increased performance relative to ORPs in periods of sub-optimal growth conditions are therefore likely to make PBRs economically competitive in certain physical and financial environments.
Additionally, the significant impact that the electricity generation mix has on the GWP and embodied energy suggest that incorporation of this parameter into biorefinery planning and development will have energetic, environmental, and (when a PTC or other mechanism
CHAPTER 5: CONCLUSIONS
This research develops an integrated techno-economic and life-cycle analysis model to examine the economic, energetic and environmental performance of algal biofuel production pathways. Novel sub-process alternatives for algae cultivation (bicarbonate-induced lipid accumulation) and dewatering (temperature-sensitive hydrogels) were integrated into production pathways under different growth scenarios, with different biomass-to-fuel conversion methods, and with a variety of improvements to biorefinery financing available to highlight relative pathway performance improvements in each case. While often considered extrinsic variables in economic analyses of algal biofuels, the financing parameters reflect perceived operational risk and uncertain regulatory support for renewable energy production systems. Thus, it is important that they be fully integrated, as the impact of accelerated depreciation methods and reduced financing costs (representing risk management strategies as well as guaranteed loans) on the cost of produced fuel is observed to be dependent on the sub-process operations which make up a proposed production pathway.
Biorefinery design to maximize lifetime economic potential must then consider the relevant financing environment, including perceived risk of operations and regulatory policies, when evaluating sub-process alternatives. Modeling of proposed alternatives in production pathways composed of various operations (e.g. for growth, dewatering, extraction and conversion, energy and nutrient recovery) and sited in diverse geophysical environments
APPENDIX A: MODEL INPUTS AND REFERENCES
Parameter Value Units Reference
Algae Cultivation
Land Cost 3000 $/acre Davis et al., 2011
Pumping water to pond 1.20E-04 kWh/L GREET
Pumping culture to
pond 2.50E-05 kWh/L GREET
Paddlewheel
Circulation 48 kWh/ha*d GREET
CO2 Demand 1.83 g / g dry algae GREET
CO2 Loss 18% GREET
Productivity 13.20 g/m2/d Davis et al., 2012
Operational Days 330.00 Days/year Davis et al., 2012
Lipid Content 25% Davis et al., 2012
Pond Outlet Conc 0.5 g DW /L GREET
Pond CapEx
50600 $/ha Nagarajan et al., 2012
8 - 50 $/m3
Lundquist et al. (2010) ; Stephens et al. (2009); Davis
et al. (2011); Benemann and Oswald (1996); Campbell et al. (2011); Weissmann and Goebel (1987); Putt (2007)
Water Cost 0.05 $/1000 gal Davis et al., 2011
Nitrogen Demand 0.077 g N/g algae GREET
Ammonia Cost 407 $/ ton NH3 Davis et al., 2011
Phosphorus Demand 0.0081 g P/g algae GREET
DAP Cost 442 $/ ton DAP Davis et al., 2011
CO2 Cost 40 $/kg Davis et al., 2011
Bicarb Trigger
HCO3 Demand 55 mM Gardner et al., 2013
HCO3 Cost 0.55 $/kg Industrial Quote
Dewatering
AF Tank Cost 71.15 $/m3 Delrue et al., 2012
AF Outlet Conc. 10 g DW/L GREET
DAF Elec Demand 2.48 kWh/g algae GREET
Chitosan Demand 0.004 g/g algae GREET
DAF CapEx 5.14e6 $ CapCost
DAF Outlet Conc 60 g DW/L GREET
Hydrogels
Temp Change 10 Deg C Vadlamani, 2014
Retention Efficiency 98% Vadlamani, 2014
CapEx (.1 g/L Input) 2.06E+07 $ CapCost
OpEx (.1 g/L Input) 5.67E+04 $ CapCost
Capex (1 g/L Input) 2.30E+06 $ CapCost
OpEx (1 g/L Input) 4.61E+03 $ CapCost
Evodos Centrifuge
Energy Demand 1.2 kWh/m3 Evodos
Retention 95% Evodos
Yield 240 g BM/L Evodos
Thermal Drying
CapEx 45-129 $/ton water
evaporated Chauvel et al., 2001 Dry Hexane Extraction
Elec Demand
5.40E-04 kWh/g oil GREET
.00024-.00045 kWh/kg DW
biomass Delrue et al., 2012 Thermal Demand
1.38E-03 kWh/g oil GREET
.87 - 1.74 kWh/kg DW
biomass Delrue et al., 2012
Hexane Demand 5.00E-03 g/g oil GREET
Hexane Cost 4.70E-01 $/kg http://www.icis.com
Retention Efficiency 95% GREET
CapEx 51 - 155 $/ton DW
biomass Chauvel et al., 2001 Transesterification
Methanol 1.00E-01 g/g biodiesel
produced Orfield 2013
Methanol Cost 4.90E-01 $/kg methanol http://www.icis.com
Retention Efficiency 80% Orfield 2013
Electricity Demand
.00019-.00057 kWh/kg CL Delrue et al., 2012
0.36 MJ/kg oil Xu et al., 2013
Thermal Demand
.34 - 1.01 kWh/kg CL Delrue et al., 2012
1.75 MJ/kg oil Xu et al., 2013
CapEx 219.9 - 659.7 $/ton CL/yr Chauvel et al., 2001 Glycerol yield 0.111 kg glycerol/kg
HTL
Catalyst -NaCO3 0.0039 kg/kg BM Bennion et al., 2015
Reactor 6.51 MJ/kg Algae Bennion et al., 2015
Cooling 0.0018 MJ/kg Algae Bennion et al., 2016
Centrifuge 0.001 MJ/kg Algae Bennion et al., 2017
Energy Recovery -
Burning Gaseous 0.28 MJ/kg Algae Bennion et al., 2018 Energy Recovery - heat
exchanger 0.33 MJ/kg Algae Bennion et al., 2019
Heat Transfer
Efficiency 85 % Bennion et al., 2020
Bio-oil yield 0.37 kg/kg Algae Bennion et al., 2021 Solids Yield 0.16 kg/kg Algae Bennion et al., 2022 Aqueous phase yield 0.17 kg/kg Algae Bennion et al., 2023 Gaseous yield 0.30 kg/kg Algae Bennion et al., 2024
Bio-oil HHV 34 MJ/kg Bennion et al., 2025
Gaseous HHV 1.11 MJ/kg Bennion et al., 2026
Hydrotreating H2
Demand 0.043
kg H2/kg oil
treated Jones et al., 2014 Hydrocracking H2
Demand 0.02
kg H2/kg oil
treated Jones et al., 2014 Anaerobic Digestion
Elec Demand .05-.2 kWh/kg residue Couturier et al., 2001
2.20E-04 kWh/g residue GREET
Thermal Demand .1-.3 kWh/kg residue Couturier et al., 2001
8.50E-05 kWh/g residue GREET
Gas Production
0.28 L CH4/g solids Chowdhury et al., 2012 .262-.8 m3 CH4/kg dry
matter Collet et al., 2013 .33 L methane/g
solids Quinn et al., 2013
.2-.4 m3 CH4/kg
solids Delrue et al., 2012 Elec Yield 5.40E-01 kWh/g digested Quinn et al., 2013 Thermal Yield
1.40E-01 kWh/g digested Quinn et al., 2013 2.1-4.2 kwh/kg
digested Delrue et al., 2012 CapEx 84 - 245.7 $/ton residue/yr Davis et al. (2011) ; Couturier
APPENDIX B: BICARBONATE-INDUCED LIPID PRODUCTIVITY BOOST
Figure B1. Schematic for Baseline + Bicarb Trigger Pathway
Figure B2a. Phase 1 Bicarb Trigger1 Figure B2b. Phase 2 Bicarb Trigger1 1(Lohman et al., 2015)