Copyright © 2018 The Author(s). Published by RTU Press
This is an Open Access article distributed under the terms of the Creative Commons Attribution License (http://creativecommons.org/licenses/by/4.0/), which permits unre-stricted use, distribution, and reproduction in any medium, provided the original author and source are credited.
*Corresponding author. E-mail: [email protected]
2018 Volume 13 Issue 2: 139–145 https://doi.org/10.7250/bjrbe.2018-13.408
Introduction
Walkability analysis has grown in popularity in recent years: several studies have analysed the public health, eco-nomic, environmental, transportation and other benefits of promoting walkability. Regarding the built environment and travel, the increase of walkability offers an alternative basis for sustainability policy. In fact, it cut the choice of the private transport mode, also fostering the accessibil-ity to the transit service. Concerning the transit service, “since all transit trips involve some degree of walking, it follows that transit-friendly environments must also be pedestrian-friendly” (Bernick & Cervero, 1997). There-fore, the central question of urban planners and designers is which settings benefit pedestrians and how to improve walkable cities.
The scientific literature on the topic demonstrates that the street networks are the leading characteristics of pedes-trian-friendly cities (Cervero, Sarmiento, Jacoby, Gomez, & Neiman, 2009). Many studies on street configuration have found that various street attributes generate higher walking volume (Ewing & Cervero, 2001; Lee & Moudon, 2006; Cervero & Kockelman, 1997; Song & Knapp, 2004)
and three main categories of walkability measures based on the road network structure have been defined:
– measures of connectivity; – measures of quality;
– measures of proximity (Schlossberg, 2006).
Measures of connectivity are the ones mostly adopted in walking accessibility analysis (Frank, Schmid, Sallis, Chapman, & Saelens, 2005; Jacobs, 1993) since they let to define how wide the range of alternatives is for the pe-destrian. Measures of connectivity include number and density of intersections, but also some links, their den-sity, and their total length, the number, and size of the blocks. Additional measures to quantify the connectivity are based on graph theory (Dill, 2004; Zhang & Kukadia, 2005) exploiting the concept of “circuit” (a finite, closed path starting and ending at a single node).
The road network quality is evaluated using a classi-fication of the links, reflecting the hierarchy of the infra-structures and identifying possible paths for pedestrians. In particular, it is possible to define streets adverse to a pedestrian as, such as those characterized by two or more lanes in each direction (multilane roadways) and by high traffic volumes or high average speed. Otherwise, the links
UNDERSTANDING THE WALKABILITY PROPENSITY
Marialisa NIGRO1, Marco PETRELLI2*, Rasa UŠPALYTĖ-VITKŪNIENĖ3, Daiva ŽILIONIENĖ4
1, 2Dept of Engineering, Roma Tre University, Rome, Italy
3, 4Dept of Roads, Vilnius Gediminas Technical University, Vilnius, Lithuania
Received 09 June 2017; accepted 21 September 2017
Abstract. Walkability analysis has grown in popularity in recent years: several studies have analysed the public health, economic, environmental, transportation and other benefits of promoting walkability. Different authors in the literature focus on the analysis of walking indicators related to the structure of the road network to explain the walkability of an area. However, extra efforts have to be made to study many other conditions that affect the propensity to walk: not just the shape of the network and the urban topology, but also the security and the attractiveness of the landscape, or specific char-acteristics of the infrastructure such as the size of the sidewalks, the automobile accommodation values (automobile and motorcycle parking) and the pedestrian route difficulty (slope and over length of the paths, dead-end streets). This paper aims to understand the walkability propensity, investigating explanatory variables related to the concept of the pedestrian path quality at the microscopic level. Several data have been collected in different zones of the Rome City (Italy), utterly dissimilar from the pedestrian point of view. These data have been compared with the real path for pedestrian choices and with other standard walkability measures from literature.
with one lane in each direction, with low traffic and low speeds do not usually represent a barrier for pedestrians and, for these reasons, they are considered easily acces-sible. Measures of quality are also some links of each dif-ferent type (adverse or not), their length and density, their percentage value compared to the total number in the net-work and so on.
Finally, the proximity represents an evaluation of how much the road network capture on pedestrian coverage on a specific destination. In fact, recent research has discov-ered that pedestrians tend to concentrate closer to their main destinations and adjacent streets with higher inte-gration and choice (Handy, Paterson, & Butler, 2003; Pep-onis & Wineman, 2002; Rodríguez, Khattak, & Evenson, 2006). The main adopted proximity measure is merely the ratio of the buffer area of the pedestrian network over a Euclidean buffer area within the most acceptable walking distance. This measure is known in the literature as the “Pedestrian Catchment Area” (PCA) or as the “ped-shed method” (Porta & Renne, 2005).
Gori, Nigro, and Petrelli (2014) applied all these meas-ures to several areas in Italy with the aim:
– to understand whether some measures are more suit-able than others to describe the walkability of an area; – to define the best single measure or the optimal com-bination of measures to describe the walkability of an area;
– to define some benchmark values for the analysed walkability measures;
– to get valuable guidelines to define a “pedestrian-oriented” road network.
However, more efforts have to be made to study many other conditions that affect the propensity to walk. The security and the attractiveness of the landscape, or the characteristics of the infrastructure such as the size of the sidewalks, the automobile accommodation values (auto-mobile and motorcycle parking) and the pedestrian route difficulty (slope and over length of the paths, dead-end streets) are only some examples of quality walkability measures, not just correlated to the shape of the network and the urban topology.
This paper moves a step forward in this direction, in-vestigating the impact of different measures related to the concept of the quality of the pedestrian paths at the micro-scopic level. Several data have been collected in different zones of the city of Rome (Italy), completely dissimilar from the pedestrian point of view. These data have been compared with the real path for choices of pedestrians towards the leading destination, underlining the most promising explanatory variables of the walkability propen-sity, as well as their connection with standard walkability measures in literature.
The outline of the rest is as follows: first, the method adopted in the study is described. Then, data collected are discussed, and connection with the walkability propensity is investigated. Finally, conclusions are summarized, and the future work is presented.
1. Methodology
The method adopted is based on the collection and analy-sis of quality measures not just correlated to the shape of the network and the urban topology. These measures are computed collecting data on pedestrian paths towards the main destination point.
Once identified different zones of an urban area, ut-terly dissimilar from the pedestrian point of view and characterized by a main attractor point (“special attrac-tor”) for the walking trips, the choices of real path for pe-destrian are collected. To this aim, a survey is required to derive the adopted paths from different starting points of the zones until the attractor point. Respect to these paths for pedestrians, more alternatives, considering links that are unused, must be selected and be able to investigate also unstated path choices.
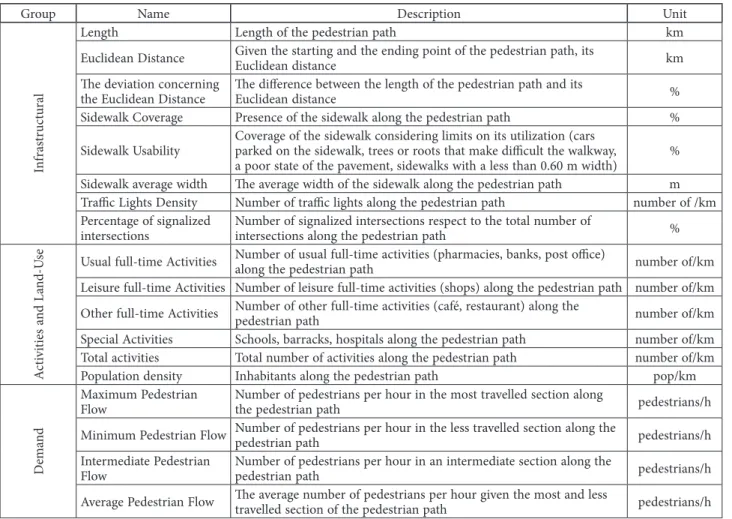
Data collected in the field for the different paths clas-sified into three main groups (Table 1):
– infrastructural path characteristics; – activities and land-use;
– pedestrian demand data.
Infrastructural data relates to the length of the path, its curvature (measured as the deviation of the path length respect to the Euclidean distance between the origin and the destination of the trip), the sidewalk characteristics as the coverage, width and usability (due to exist trees or cars on the sidewalk), the security of the path measured through the presence of pedestrian crossings controlled by traffic signals.
Activities data permits to define the land-use along the path. They have been classified into four types of activities:
– usual full-time activities as pharmacies, banks, post office, that are full-time opened and which usually is intermediate stops for pedestrian during the trip for reaching the particular attractor;
– leisure full-time activities, i.e., shops;
– other full-time activities, i.e., café, restaurant. Both leisure and other full-time activities attract the pe-destrians on the path;
– special activities, which are activities with a specific function, usually not correlated with the walking propensity and sometimes part-time opened.
It is the case of schools, police station, hospitals. Next to these activities data, also the population density is com-puted as the population density along the path (linear density): it permits to get indirect information on the level of urbanization that the pedestrians meet along the path.
Demand data finally relates to the envelope of the user choices and to the level of walking congestion that is found by the pedestrians along the path. Thus, they refer to measures of pedestrian flows in different sections of the path (upstream – i.e., near the starting point of the trip, downstream – i.e., near the particular attractor and in an intermediate section of the path), as well to their average value.
Thus, at first it has been searched for each zone if a link exists between the above measures and the pedestrian path choices. Then, since also data on the unstated paths have been collected, measures on the paths of the zone potentially describe specific walkability properties of the zone itself. To this aim, correlation analysis has been per-formed among the average values of the measures in the different zones, as well as between these measures and standard walkability measures from literature.
2. Results and discussion of the case study of Rome To get the real path choices, that are the first information required for the study, a survey campaign has been con-ducted during October 2016, where 670 pedestrians have been interviewed in 8 different zones of the Rome City.
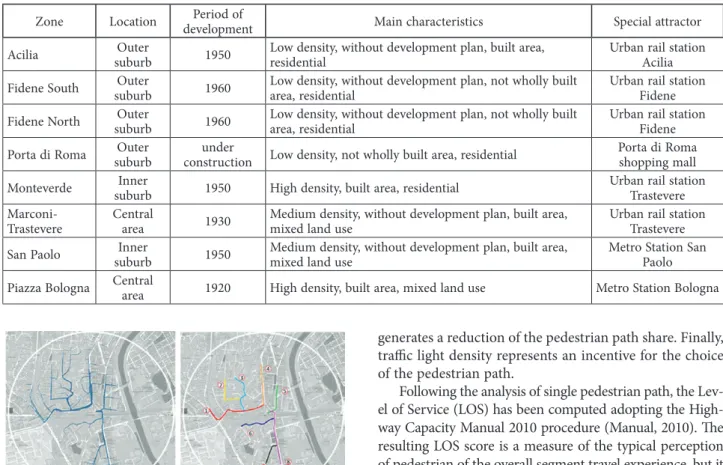
Regarding built environment and urban form, Rome is a city characterized by districts with the very different urban structure for the topology, the development, and the section of the road network and the continuity, the consist-ency, and the shape of the built areas. The existence of such different areas is due mainly to their development in differ-ent periods, not restricted only to the last cdiffer-entury, but also to a different construction process (planned by the admin-istration or as a result of single private actions not about a development plan). It is an essential aspect of the study
since it allows to analyse areas with very different charac-teristics. In fact, the selected areas (Table 2) move from the city centre (Marconi-Trastevere), characterized by compact and wholly built areas, to the modern suburbs of Fidene, or an area under construction (Porta di Roma) with large and often isolated buildings, wide roads, and discontinuity of built areas. Each selected zone has a particular attrac-tor point (Table 2). Respondents were asked to show the chosen pedestrian path to reach their respective particu-lar attractor. The choice to request the information of the path respect to one main destination was made to have no dispersion of walking trips linked to different motivations.
Paths with neighbouring starting points and car-rying on the same main corridor have been aggregated (Figure 1), thus obtaining some paths ranging from 7 to 11, depending on the zone. To these, alternative routes were added, if any exists, that provide for unstated paths. Finally, data on the quality of the paths, as described in Table 1, were collected.
Table 3 summarizes the values of data collected as the average of each measure on all the paths of every single zone, where the walking paths also catch distances more than 1 km. Standard deviation is also reported to show the variability of the measures among the collected paths.
As reported in the methodological section, at first it has been searched for each zone if a link exists between
Table 1. Data collected in the field describing pedestrian paths characteristics
Group Name Description Unit
Inf
ra
str
uc
tura
l
Length Length of the pedestrian path km
Euclidean Distance Given the starting and the ending point of the pedestrian path, its Euclidean distance km The deviation concerning
the Euclidean Distance The difference between the length of the pedestrian path and its Euclidean distance %
Sidewalk Coverage Presence of the sidewalk along the pedestrian path %
Sidewalk Usability Coverage of the sidewalk considering limits on its utilization (cars parked on the sidewalk, trees or roots that make difficult the walkway,
a poor state of the pavement, sidewalks with a less than 0.60 m width) %
Sidewalk average width The average width of the sidewalk along the pedestrian path m
Traffic Lights Density Number of traffic lights along the pedestrian path number of /km
Percentage of signalized
intersections Number of signalized intersections respect to the total number of intersections along the pedestrian path %
Ac
tiv
ities a
nd L
an
d-U
se Usual full-time Activities Number of usual full-time activities (pharmacies, banks, post office)
along the pedestrian path number of/km
Leisure full-time Activities Number of leisure full-time activities (shops) along the pedestrian path number of/km Other full-time Activities Number of other full-time activities (café, restaurant) along the pedestrian path number of/km
Special Activities Schools, barracks, hospitals along the pedestrian path number of/km
Total activities Total number of activities along the pedestrian path number of/km
Population density Inhabitants along the pedestrian path pop/km
D
em
an
d
Maximum Pedestrian
Flow Number of pedestrians per hour in the most travelled section along the pedestrian path pedestrians/h Minimum Pedestrian Flow Number of pedestrians per hour in the less travelled section along the pedestrian path pedestrians/h Intermediate Pedestrian
the measures of Table 1 and the pedestrian path choices. Thus, for each zone and for each path the pedestrian share has been computed as the pedestrian path flow divided for the total pedestrian demand attracted by the particular attractor. The pedestrian shares have been correlated with every single measure of Table 1 by using a linear regres-sive model. Results are summarized in Table 4, where the variables mainly related to the pedestrian path choice have been reported together with the determination coefficient (R2) of the linear model. As expected, paths with higher
pedestrian shares, thus where people pass more often, are associated with higher walking volume: the relation between the pedestrian path choice and the average pe-destrian flow is linear reaching R2 values of 0.7−0.8. The
higher impact of the population density is seen where the zones have a substantial variation of the measure along the paths: this is the case of Acilia where the measure is correlated to the path choices with the same correlation degree shown by the average pedestrian flow.
Sidewalk characteristics explain the propensity to use a path for walking: in the zone of Monteverde, where there is a definite subset of paths with a higher width of the sidewalk respect to the alternative paths, this is clear since the correlation reaches an R2 value of 0.930. In the same
zone, it is highlighted as also the over length of the paths
generates a reduction of the pedestrian path share. Finally, traffic light density represents an incentive for the choice of the pedestrian path.
Following the analysis of single pedestrian path, the Lev-el of Service (LOS) has been computed adopting the High-way Capacity Manual 2010 procedure (Manual, 2010). The resulting LOS score is a measure of the typical perception of pedestrian of the overall segment travel experience, but it does not take into account some aspects of the crossing dif-ficulty or the intersection service. Analysing the computed LOS, it is stated that conditions of limited speed and abil-ity to pass slower pedestrians (LOS D) for the investigated trips (mainly regular trips towards the primary destination) are not linked with the choice of the path and the demand over the path. However, zones in the outer suburb of the city (Acilia and Fidene) or zones of recent development (e.g., Porta di Roma) show a lower LOS respect to the other zones, index of less satisfactory walkability conditions.
After the analysis at the level of a single zone, correla-tion analysis has been performed among the average val-ues of the quality measures (Table 3), to verify when linear relations exist among the variables. It has been assumed a high correlation among data if the Pearson Correlation coefficient is more than |0.75|. Main founded relations are:
– higher is the average length of the paths for pedestri-ans; lower is the average pedestrian flow;
– zones containing twisty paths, thus paths far from their respective Euclidean distance, have a lower ac-tivity density. Moreover, the acac-tivity density is strictly correlated with the pedestrian flow;
– the different types of activities rise together, except the special activities;
– signalized intersections increase together with the total activity density, the population density, and the pedestrian flows;
– the sidewalk coverage and its width increase together. This last point underlines a design characteristic of the
Table 2. Selected zones for the analysis, their main characteristics, and particular attractor points
Zone Location developmentPeriod of Main characteristics Special attractor
Acilia suburbOuter 1950 Low density, without development plan, built area, residential Urban rail station Acilia
Fidene South suburbOuter 1960 Low density, without development plan, not wholly built area, residential Urban rail station Fidene
Fidene North suburbOuter 1960 Low density, without development plan, not wholly built area, residential Urban rail station Fidene
Porta di Roma suburbOuter construction Low density, not wholly built area, residentialunder Porta di Roma shopping mall
Monteverde suburbInner 1950 High density, built area, residential Urban rail station Trastevere
Marconi-Trastevere Central area 1930 Medium density, without development plan, built area, mixed land use Urban rail station Trastevere San Paolo suburbInner 1950 Medium density, without development plan, built area, mixed land use Metro Station San Paolo
Piazza Bologna Central area 1920 High density, built area, mixed land use Metro Station Bologna
urban zones of Rome: if the intention to plan a road system designed to accommodate pedestrians, high coverage and high width of the sidewalks is guaranteed. These results underline as the walkability propensity is strictly correlated with the land use development,
es-pecially on full-time activities, and to the distances to be travelled. It is possible to assume that planning pedestrian paths as most direct as possible toward the main desti-nations help to increase the walkability propensity of the zone. Moreover, it has been demonstrated as controlled
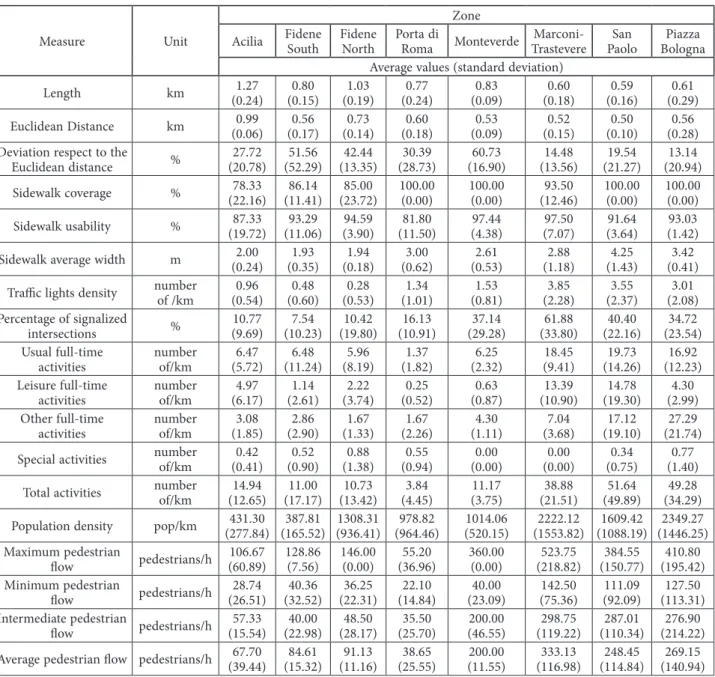
Table 3. Average values of quality measures collected in each zone
Measure Unit
Zone
Acilia Fidene South Fidene North Porta di Roma Monteverde Marconi-Trastevere PaoloSan BolognaPiazza Average values (standard deviation)
Length km (0.24)1.27 (0.15)0.80 (0.19)1.03 (0.24)0.77 (0.09)0.83 (0.18)0.60 (0.16)0.59 (0.29)0.61
Euclidean Distance km (0.06)0.99 (0.17)0.56 (0.14)0.73 (0.18)0.60 (0.09)0.53 (0.15)0.52 (0.10)0.50 (0.28)0.56 Deviation respect to the
Euclidean distance % (20.78)27.72 (52.29)51.56 (13.35)42.44 (28.73)30.39 (16.90)60.73 (13.56)14.48 (21.27)19.54 (20.94)13.14 Sidewalk coverage % (22.16)78.33 (11.41)86.14 (23.72)85.00 100.00(0.00) 100.00(0.00) (12.46)93.50 100.00(0.00) 100.00(0.00)
Sidewalk usability % (19.72)87.33 (11.06)93.29 (3.90)94.59 (11.50)81.80 (4.38)97.44 (7.07)97.50 (3.64)91.64 (1.42)93.03
Sidewalk average width m (0.24)2.00 (0.35)1.93 (0.18)1.94 (0.62)3.00 (0.53)2.61 (1.18)2.88 (1.43)4.25 (0.41)3.42
Traffic lights density number of /km (0.54)0.96 (0.60)0.48 (0.53)0.28 (1.01)1.34 (0.81)1.53 (2.28)3.85 (2.37)3.55 (2.08)3.01 Percentage of signalized
intersections % (9.69)10.77 (10.23)7.54 (19.80)10.42 (10.91)16.13 (29.28)37.14 (33.80)61.88 (22.16)40.40 (23.54)34.72 Usual full-time
activities number of/km (5.72)6.47 (11.24)6.48 (8.19)5.96 (1.82)1.37 (2.32)6.25 (9.41)18.45 (14.26)19.73 (12.23)16.92 Leisure full-time
activities number of/km (6.17)4.97 (2.61)1.14 (3.74)2.22 (0.52)0.25 (0.87)0.63 (10.90)13.39 (19.30)14.78 (2.99)4.30 Other full-time
activities number of/km (1.85)3.08 (2.90)2.86 (1.33)1.67 (2.26)1.67 (1.11)4.30 (3.68)7.04 (19.10)17.12 (21.74)27.29 Special activities number of/km (0.41)0.42 (0.90)0.52 (1.38)0.88 (0.94)0.55 (0.00)0.00 (0.00)0.00 (0.75)0.34 (1.40)0.77
Total activities number of/km (12.65)14.94 (17.17)11.00 (13.42)10.73 (4.45)3.84 (3.75)11.17 (21.51)38.88 (49.89)51.64 (34.29)49.28
Population density pop/km (277.84)431.30 (165.52)387.81 (936.41)1308.31 (964.46)978.82 (520.15)1014.06 (1553.82)2222.12 (1088.19)1609.42 (1446.25)2349.27 Maximum pedestrian
flow pedestrians/h 106.67(60.89) 128.86(7.56) 146.00(0.00) (36.96)55.20 360.00(0.00) (218.82)523.75 (150.77)384.55 (195.42)410.80 Minimum pedestrian
flow pedestrians/h (26.51)28.74 (32.52)40.36 (22.31)36.25 (14.84)22.10 (23.09)40.00 (75.36)142.50 (92.09)111.09 (113.31)127.50 Intermediate pedestrian
flow pedestrians/h (15.54)57.33 (22.98)40.00 (28.17)48.50 (25.70)35.50 (46.55)200.00 (119.22)298.75 (110.34)287.01 (214.22)276.90 Average pedestrian flow pedestrians/h (39.44)67.70 (15.32)84.61 (11.16)91.13 (25.55)38.65 (11.55)200.00 (116.98)333.13 (114.84)248.45 (140.94)269.15
Table 4. Walkability measures for several zones in Rome (Gori, Nigro, & Petrelli, 2014)
Zone Acilia Fidene South Fidene North Porta di Roma Monteverde TrastevereMarconi- San Paolo BolognaPiazza
Measures affecting
the pedestrian path choice
(R2)
Average Pedestrian
Flow (0.788) Population
density (0.779)
Average Pedestrian Flow (0.624) Population density (0.472)
Traffic Lights Density (0.605)
Average Pedestrian
Flow (0.742) Sidewalk Coverage (0.483)
Average Pedestrian
Flow (0.817) Sidewalk Usability
(0.530)
Average Pedestrian Flow (0.783) Sidewalk average
width (0.930) The deviation concerning the Euclidean Distance
(0.787)
Average Pedestrian
Flow (0.730) Population
density (0.440)
Average Pedestrian Flow (0.581) Sidewalk Usability
(0.655) Traffic Lights
Density (0.497)
Average Pedestrian
Flow (0.670) Sidewalk average width
(0.608) Traffic Lights
pedestrian crossings are usually required to assure the se-curity of the paths for the pedestrians.
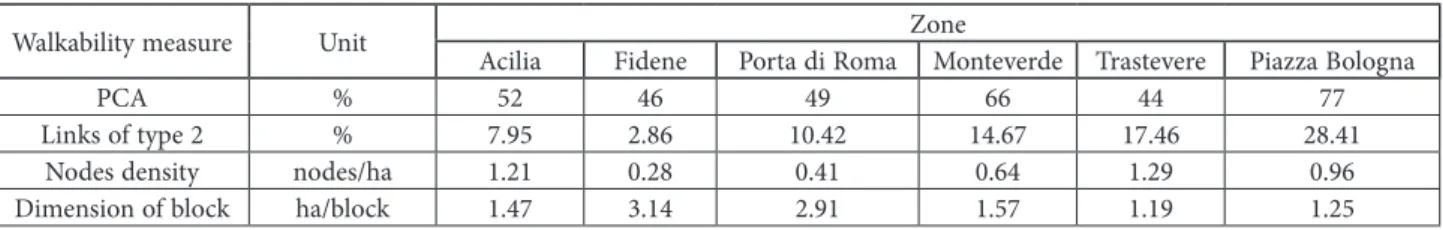
Finally, quality measures have been compared with walkability measures connected with the road network structure of the zones and available from the literature (Gori et al., 2014, Table 5).
Linking quality measures of Table 1 with a proximity measure as the PCA, no statistically significant correlation has been founded. It confirms as the PCA is not sufficient by itself to describe the walkability of an area, thus assur-ing a high PCA value does not involve a high walkability propensity. Moreover, the PCA is computed not taking into account the presence of streets usually considered adverse for pedestrian (called in Gori et al., 2014 as “links of type 2”). On the other hand, the increase of “links of type 2” in the urban zones of Rome involves an increase of the qual-ity measures before defined as the traffic lights densqual-ity, the total activity density, the population density as well as of the average pedestrian flow. This does not mean that the proposed measures do not explain the walkability: in the Roman case, the main commercial streets usually overlap with the main corridors for private vehicles. Thus, there is no difference between the main road network and the pedestrian network. This is a wrong planning solution for the walkability since pedestrians are forced to share space with private vehicles. However, this is improper also for walkability evaluation since quality measures based on the link classification generate inaccurate results on the quality of the land-use and the infrastructure for the pedestrians. Other walkability measures as the node density and the dimension of the block (connectivity measures) are not correlated with our quality measures. Thus, if the number of nodes and the dimension of the blocks are usually considered explanatory variables when trying to realize a pedestrian-oriented development, it is required to associate to their benchmark values a proper land-use and infrastructure design for pedestrians.
Conclusions
1. In this paper, an evaluation of the walkability propensity has been conducted for the real case of the Rome City, focusing on the computation of quality measures not based on the shape of the network and the urban topol-ogy. Specifically, these measures are related to the security and the attractiveness of the landscape, to the pedestrian infrastructure characteristics and the pedestrian route dif-ficulty. To this aim, data have been collected on the
pedes-trian paths towards the leading destination in 8 zones of the city dissimilar from the pedestrian point of view.
2. The quality measures are analysed to test the main characteristics affecting both the pedestrian path choice and the walkability of the zone, as well as possible walkability relations among zones.
3. Results underlined as indications on the walkability propensity to choose variables to give a path over another as the population density and the sidewalk characteristics (width, coverage, and usability). However, these indications are not uniquely defined, since they are variable between zone and zone, as a function of their distribution on the territory. 4. Information about the activities (shops, restaurants,
post-offices) has not underlined a specific relation with the increment of the pedestrian share along with a path, while they force the total walkability propensity of the zone (more activities, higher pe-destrian flow). This result depends on the layout of the survey conducted to collect the pedestrian path choices since mainly regular trips towards a desti-nation have been investigated. The fact that only regular trips have been intercepted also justifies the lack of correlation between the pedestrian level of service and the choice of the path.
5. Another impressive result is about the length of the pedestrian paths since it has been demonstrated as planning pedestrian paths as most direct as possi-ble towards the leading destination, help to increase the walkability propensity of the zone. However, the path also catches distances higher than 1 km, since pedestrians are usually available until this length. 6. Finally, comparing the quality measures with
walk-ability measures connected with the road network structure of the zones and available from the litera-ture, the study demonstrates the two subsets of indi-cators are not strictly linked. Therefore, it is required to associate to the usually adopted benchmark val-ues of connectivity and proximity measures a proper land-use and infrastructure design for pedestrians. 7. Further research needs to investigate behavioural
aspects of the pedestrian choices. The aim is to un-derstand both the supply and the demand side all the elements that have to be taken into account for planning purposes. In fact, the possibility to know how to convince users to walk is not only an object for the public health, but also for sustainable mobil-ity goals: if users find useful pedestrian conditions,
Table 5. Walkability measures for several zones in Rome (Gori et al., 2014)
Walkability measure Unit Acilia Fidene Porta di Roma Monteverde TrastevereZone Piazza Bologna
PCA % 52 46 49 66 44 77
Links of type 2 % 7.95 2.86 10.42 14.67 17.46 28.41
Nodes density nodes/ha 1.21 0.28 0.41 0.64 1.29 0.96
they avoid using private vehicles, as well as leave in advance the transit service, thus reducing congested conditions on the transport system.
Disclosure statement
Authors declare they have not competed for financial, pro-fessional, or personal interests from other parties.
References
Bernick, M., & Cervero, R. (1997). Transit villages in the 21st
century. New York, NY United States: McGraw-Hill, Incor-porated. ISBN: 0070054754.
Cervero, R., & Kockelman, K. (1997). Travel demand and the 3Ds: density, diversity, and design. Transportation Research Part D: Transport and Environment, 2(3), 199–219.
https://doi.org/10.1016/S1361-9209(97)00009-6
Cervero, R., Sarmiento, O. L., Jacoby, E., Gomez, L. F., & Nei-man, A. (2009). Influences of built environments on walking and cycling: lessons from Bogotá. International Journal of Sus-tainable Transportation, 3(4), 203–226.
https://doi.org/10.1080/15568310802178314
Dill, J. (2004, January). Measuring network connectivity for bicy-cling and walking. In 83rd Annual Meeting of the
Transporta-tion Research Board (pp. 11–15). Washington, DC.
Ewing, R., & Cervero, R. (2001). Travel and the built environ-ment: a synthesis. Transportation Research Record: Journal of the Transportation Research Board, (1780), 87–114.
https://doi.org/10.3141/1780-10
Frank, L. D., Schmid, T. L., Sallis, J. F., Chapman, J., & Saelens, B. E. (2005). Linking objectively measured physical activity with objectively measured urban form. American journal of preventive medicine, 28(2), 117–125.
https://doi.org/10.1016/j.amepre.2004.11.001
Gori, S., Nigro, M., & Petrelli, M. (2014). Walkability indicators for pedestrian-friendly design. Transportation Research
Re-cord: Journal of the Transportation Research Board, (2464), 38–45. https://doi.org/10.3141/2464-05
Handy, S., Paterson, R. G., & Butler, K. (2003). Planning for street connectivity: getting from here to there. No. PAS Report No. 515. Jacobs, A. B. (1993). Great streets. Cambridge: MIT Press. ISBN:
9780262100489.
Lee, C., & Moudon, A. V. (2006). The 3Ds+ R: quantifying land use and urban form correlates of walking. Transportation Re-search Part D: Transport and Environment, 11(3), 204–215.
https://doi.org/10.1016/j.trd.2006.02.003
Manual, H. C. (2010). HCM2010. Transportation Research Board, National Research Council, Washington, DC. Peponis, J., & Wineman, J. (2002). Spatial structure of
environ-ment and behavior. In R. Bechtel & A. Churchman (Eds.),
Handbook of environmental psychology (pp. 271-291). John Wiley and Sons, New York.
Porta, S., & Renne, J. L. (2005). Linking urban design to sustain-ability: formal indicators of social urban sustainability field re-search in Perth, Western Australia. Urban Design International, 10(1), 51–64. https://doi.org/10.1057/palgrave.udi.9000136
Rodríguez, D. A., Khattak, A. J., & Evenson, K. R. (2006). Can new urbanism encourage physical activity? Comparing a new Urbanist neighborhood with conventional suburbs. Journal of the American Planning Association, 72(1), 43–54.
https://doi.org/10.1080/01944360608976723
Schlossberg, M. (2006). From TIGER to audit instruments: measuring neighborhood walkability with street data based on geographic information systems. Transportation Research Record: Journal of the transportation research board, (1982), 48–56. https://doi.org/10.3141/1982-08
Song, Y., & Knaap, G. J. (2004). Measuring urban form: is Port-land winning the war on sprawl?. Journal of the American Planning Association, 70(2), 210–225.
https://doi.org/10.1080/01944360408976371