TECHNICAL UNIVERSITY OF CLUJ-NAPOCA
ACTA TECHNICA NAPOCENSIS
Series: Applied Mathematics, Mechanics, and Engineering Vol. 60, Issue II, June, 2017
ANALYSIS OF CORRELATIONS BETWEEN PHYSICAL AND
MECHANICAL PROPERTIES OF PLASTIC MATERIALS IN THE NEW
PRODUCT DEVELOPMENT PROCESS
Petru Rareş RUSAN, Ioan BLEBEA, Radu Mircea MORARIU-GLIGOR
Abstract: The contribution of the authors of the present paper is the development of unified model for comparative analysis of various plastic materials based on their physical and mechanical parameter, having as target an easier and more selective way of choosing this kind of materials in engineering applications. The proposed method has at base a graphical representation of their values as a rectangular shape, this resulted 2D representation can be interpreted in an easier way. When a new product is required, from the position in this representation for each material, the user could select the best matching materials based on the represented properties.
1. INTRODUCTION
If during the conception process of a new product that involves plastic materials the technical specifications are not available we must admit that its different physical and technical parameters we are relying during development are situated in a wide range of limits that will affect the properties and qualities of the product. In this case the developer of product must search in different sources of information those parameters and properties, other than the manufacturer of the material datasheet.
So in this situation we could not base our research on really tight values intervals of the analysis indicators as in the case of metallic materials. They resemble more with properties of different alloys of metallic materials for which the physical and mechanical parameters depend on the proportions of the constituent materials in the alloy.
Based on the properties mapping presented in some studies [1] [2] the authors consider that the easiest and most convenient way, for groups of materials, is based on the 2D maps, of two physical-mechanical parameters. In this case one of the parameters are defined as a primary parameter (e.g. modulus of elasticity) and the
second parameter (e.g. ultimate elongation) is considered secondary parameter, but which one are taking also in consideration when making the decision, in such a way that the material must be in the required range with both of the parameters.
Starting at the point where in current practices of development the engineer would like a material from a must have parameter (main parameter), that should be inside the specified limits, but some more conditions are also considered, conditions contained by the 2D mapping, this representation is really useful. The most common naming of materials in Romanian and English language are presented below, in table 1.
2. ANALYSIS OF CORRELATIONS
BETWEEN PHYSICAL AND
MECHANICAL PROPERTIES
group and any parameters of analysis which are available.
Table 1 Naming and codification of most known plastic materials
Coding Detailed Naming
ROMANIAN Language ENGLESH Language
PE Polietilenă PE Polyethylene (PE)
PP Polipropilenă PP Polypropylene (PP)
PS Polistiren PS Polystyrene (PS)
ABS Acrilonitril-Butadien-Stiren (ABS) Acrylonitrile-butadiene-styrene (ABS)
PA, Ny Poliamidă, Nailon Polyamide (PA), Nylon
PMMA, Ac Polimetilmetacrilat (PMMA) Polymethylmethacrylate (PMMA),
PC Policarbonat (PC) Polycarbonate (PC)
POM Polioximetilen (POM) Polyoxymethylene (POM), Acetal
PTFE Politetrafluoretilenă (PTFE) Polytetrafluoroethylene (PTFE)
IOM Ionomeri (IO) Ionomers
CA Celuloză (CA) Celluloses (CA)
PEEK Polieteretercetonă (PEEK) Polyetheretherketone (PEEK)
PVC Policlorură de vinil (PVC) Polyvinylchloride (PVC)
PU(tp) PU(el) PU(ts)
Poliuretan (PU) Polyurethane (PU)
tpPU
(termoplastic)
elPU
(elastic)
tsPU
(termorigid) tpPU elPU tsPU
SI Siliconi (SI) Silicones
POLY(ts) POLY(tp)
Poliester (PET, PBT) Polyesters (PET, PBT) tsPoliester
(termorigid)
tpPoliester
(termoplastic) tsPolyester tpPolyester
EPOXI Răşini epoxidice Epoxy resins
Phl Răşini Fenolice Phenolic resins
E
L
A
S
T
O
M
E
R
I
NRub Cauciuc natural Natural Rubber
SBS etc. Elastomeri Stiren-Butadienici Styrene-Butadiene Elastomers (SBS, SEBS, SBR, BUNA-S)
NR Cauciucuri Butilice (NR) Butyl Rubbers (NR)
Iz Izopren Isoprene
Acrilate Elastomeri Acrillici Acrylate Elastomers
NBR Elastomeri Nitrilici Nitrile Elastomers (NBR, BUNA-N)
PolyB Elastomeri Polibutadienici Polybutadiene Elastomers
PolyS Elastomeri Polisulfurici Polysulphide Elastomers
Eth-Pro Elastomeri Etilen-Propilenici Ethylene-Propylene Elastomers (EP, EPM, EPDM)
EVA Elastoomeri Etilen-Acetat-Vinilici Ethylene-Vinyl-AcetateElastomers (EVA)
PolyCPr Policloropren Polychloroprene
Termo Elastomeri Termoplastici Thermoplastic Elastomers (TPE)
PolyFf Spume poli-flexibile Poly-Flexible foams
PolyFr Spume poli-rigide Poly-Rigid foams
GFRP Compozite polimerice cu fibră de sticlă Polymers/Glass Fiber (GFRP), Fiberglass
CFRP Compozite polimerice cu fibră de carbon Polymers/Carbon Fiber (CFRP)
2.1 Analysis of correlation between ultimate elongation and modulus of elasticity.
Comparing the two representative technical parameters: ultimate elongation and modulus of elasticity, a group of 17 plastic materials are transposed in the table 2, resulting the 2D map from fig. 1. This group of materials was selected considering the criterion that the medium value of the modulus of elasticity must be between 0.30 and 4.35 GPa, this being considered the main parameter of analysis and materials being sorted ascending based on this value.
Table 2. Elongation and Modulus of elasticity
SYMBOL OF MATERIA Modulus of elasticity [GPa] Ultimate Elongation [%] Min . val. Max. val. Mean val. Min. val. Max. val.
IOM 0,20 0,42 0,31 300,00 700,00
PTFE 0,40 0,55 0,48 200,00 400,00
PP 0,90 1,55 1,23 100,00 600,00
PU (tp) 1,31 2,07 1,69 60,00 550,00
ABS 1,10 2,90 2,00 1,50 100,00
PC 2,21 2,44 2,33 70,00 150,00
POLY (ts) 0,30 4,41 2,36 2,00 310,00
CA 0,75 4,10 2,43 5,00 100,00
EPOXI 2,35 3,08 2,72 2,00 10,00
PS 2,28 3,31 2,80 1,20 3,60
POLY (tp) 1,60 4,40 3,00 1,30 5,00
PMMA, Acr 2,24 3,80 3,02 2,00 10,00
PVC 2,14 4,14 3,14 11,93 80,00
Phl 2,76 4,83 3,80 1,50 2,00
PEEK 3,76 3,95 3,86 30,00 150,00
PU (ts) 4,10 4,30 4,20 3,00 6,00
POM, Ac 2,35 6,27 4,31 10,00 75,00
The map, represented in figure 1, could be interpreted in many ways as follows:
For example: the rigid polystyrene (thermostable) POLY(ts) presents the largest limits of each of the two parameters: modulus of elasticity: 0,30 – 4,41 [GPa] and elongation 2,0 – 310 [%]. This means that based on the function of specific procedure of manufacturing
of different companies, of different additives used to alter the physical and mechanical properties, of environmental conditions, of material age, of purity of material, and other factors, we could practically find the indicators of physical and mechanical properties in a wide range of variations, upon cases. In the example of the 17 materials selected above, analyzing the 2D resulting map, it results that for same limits of the modulus of elasticity 0,31 – 4,31 [GPa], we will find a wide range of materials whose values of the modulus of elasticity will fit inside the limits, but which differ by the extremes of limits: Polycarbonate – PC: 2,21 – 2,44 [GPa], Politetrafluoretilen – PTFE: 0,40 - 0,55 [GPa], but also materials with a larger range of values like: Polyester rigid – POLY(tp): 1,60-4,40 [GPa].
Based on this parameter, modulus of elasticity, the designer can choose the proper material. If the component must fit inside a tight specification then he should choose a tighter dispersion of values and inside this limits he will choose materials with a restraint area of dispersion of the specified parameters: Ionomeri-IOM , Polytetrafluoretilen – PTFE, Polycarbonate – PC, Polyurethane thermo stable - PU(ts).
Otherwise if the main parameter for the desired part is the elongation value, the figure 1 will lead us to another area of choice: for higher values of ultimate elongations we will choose
materials such: Ionomeri-IOM,
Politetrafluoretilen - PTFE, Polypropylene PP, Polyurethane thermoplastic PU(tp), Polycarbonate - PC, Polieteretercetone (PEEK) and if the elongation should be in a tighter range we will choose resins like EPOXI, Polystyrene - PS, Polyurethane thermorigid - PU(ts) or phenol resins - Phl.
For example if we like to have a modulus of elasticity around the 2.4 GPa value but also the specific ultimate elongation not less then 60% from the map we note that this criteria is fulfilled by Policarbonte (PC).
Polystyrene PS and phenol resins Phl and maybe Thermorigid Polyurethane PU(ts). If the number of materials are widened down, then
the comparative analysis is easier to be achieved and the results are more relevant.
Fig. 1. The 2D mapping of the 17 materials based in the elongation and modulus of elasticity
Table 3 Elongation and modulus of elasticity
SYMBOL OF MATERIAL
Modulus of elasticity[GPa] Elongation [%]
Min. val. Max. val. Mean val. Min. val. Max. val.
EPOXI 2,35 3,08 2,72 2,00 10,00
PS 2,28 3,31 2,80 1,20 3,60
POLY (tp) 1,60 4,40 3,00 1,30 5,00
PMMA, Acr 2,24 3,80 3,02 2,00 10,00
Phl 2,76 4,83 3,80 1,50 2,00
PU (ts) 4,10 4,30 4,20 3,00 6,00
Probably the method for highlighting an adequate material for a concrete situation of development starts at nominating the main parameter, for example the modulus of elasticity, whose values should be between 2.70 < E < 4.20 GPa, followed by choosing the materials that fit between this values, (see table 3), after that being chosen the secondary parameter, for example the ultimate elongation, and at the end creating the 2D map for the group of 6 selected materials, presented in figure 2.
The materials are sorted in ascending order by the main parameter value
.
After analyzing the graph note the ease of comparison and correlations that could be done for this 6 materials. So if the Polyester (PU(ts)) has the largest range through the modulus of elasticity (1,60 - 4,40 [GPa]), in the case of Polystyrene - PS the range is less wide (2,28 - 3,31) while the PMMA and EPOXI have the widest range of elongation (2,0 - 10 [%]) and Modulus of elasticity [GPa]
Elo ng ati on [%
the phenolic resins Phl have the less elasticity (1,50 - 2,0 [%]).
If we choose in our project the modulus of elasticity to be close we could pick from this
map two materials with really close values of modulus of elasticity: EPOXI and PS.
Fig. 2. 2D map of modulus of elasticity and elongations for a 6 material group.
2.2 Analysis of correlation between ultimate tensile strength and modulus of elasticity.
Taking in consideration as main parameter for analysis the ultimate tensile strength [MPa] and as the second parameter the modulus of elasticity [GPa] we propose to find the correlation between different plastic materials whose first mean parameters are between 3,14 - 6,00 [MPa]. The 7 materials that fulfill this condition are shown in table 4, and the 2D map of them are presented in figure 3.
Analyzing the range of values of the two parameters for each material, we could conclude as follows:
PA and Ny have the largest range of the ultimate strength values but also the largest values of modulus of elasticity, this means that using this materials in a project could lead at an uncertain behavior of the material. This in the
context of that the material certificate is not accompanied by the material technical parameter specifications, and also by the certificate of quality that specifies the two exact parameters.
Table 4 Ultimate tensile strength and Elastic Module
SIMBOL OF MATERIAL
Ultimate tensile strength [MPa]
Modulus of elasticity
[GPa]
Min. val.
Max. val.
Mean val.
Min. val.
Max. val.
PVC 1,16 5,12 3,14 2,14 4,14
PC 2,10 4,60 3,35 2,21 2,44
PU (tp) 1,84 4,97 3,41 1,31 2,07
PEEK 2,73 4,30 3,52 3,76 3,95
PP 3,00 4,50 3,75 0,90 1,55
PA, Ny 0,58 8,30 4,44 0,67 4,51
PTFE 5,00 7,00 6,00 0,40 0,55
Modulus of elasticity [GPa] Elo
ng ati on [%
Fig. 3. 2D map of the 7 materials for ultimate tensile strength vs. modulus of elasticity
The materials that have a modulus of elasticity with high values as PEEK have a lower range of values for ultimate tensile strength, therefore a greater stability in use is most susceptible, even if it has different suppliers as origin of manufacturing. The same is with PC, PP and PTFE materials, PTFE being the best alternative as ultimate tensile strength.
Also in this case the use of the 2D map shows us the versatility of this method, the designer had the possibility to analyze and compare quickly the properties of different materials and being able to choose the best fitted materials upon their properties for a certain application.
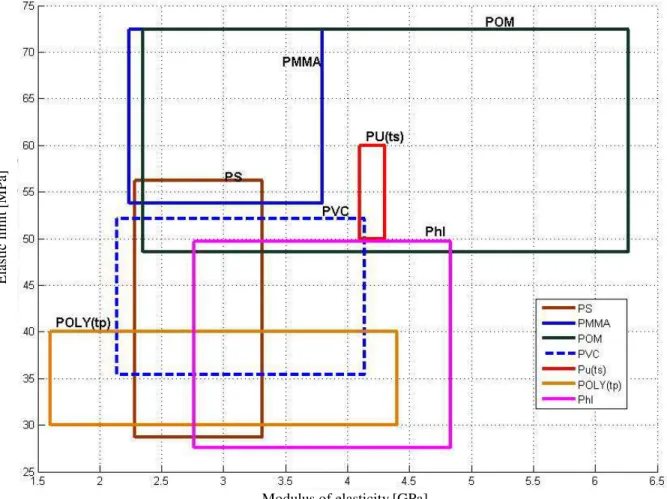
2.3 Analyzing the correlation between modulus of elasticity and elastic limits.
The same conclusions and relevant results could be obtained by comparing the groups of materials based on any other two parameters.
Using the above method, we compared the modulus of elasticity and elastic limits, see figure 4 and table 5.
Table 5 Modulus of elasticity and Elastic limits
SYMBOL OF MATERIAL
Modulus of elasticity [GPa]
Elastic limits [MPa]
Min. val.
Max. val.
Mean val.
Min. val.
Max. val.
PS 2,28 3,31 2,80 28,7 56,2
POLY (tp) 1,60 4,40 3,00 30,0 40,0
PMMA, Acr 2,24 3,80 3,02 53,8 72,4
PVC 2,14 4,14 3,14 35,4 52,1
Phl 2,76 4,83 3,80 27,6 49,7
PU (ts) 4,10 4,30 4,20 50,0 60,0
POM 2,35 6,27 4,31 48,6 72,4
At the first glance this comparison between the modulus of elasticity and the elastic limits Ultimate tensile strength [MPa]
might not seem relevant because our expectation is that a mathematical correlation exists between the two, like proportionality, the results show that the materials with high modulus of elasticity do not have high elastic limit.
For example Polyurethane thermoplastic PU(tp) has high values of modulus of elasticity but the elastic limit is low, instead the Poliximetylen POM has both the modulus of elasticity and the elastic limit at high values
.
Fig. 4. 2D map of modulus of elasticity and elastic limit for a 7 group materials.
For a uninitiated person this 2D map could seems not too relevant but for an design engineer who knows the importance and significance of the two parameters it is a really useful tool [3][4].
Because this kind of maps are not available and are not explored by other articles, in the conducted research we propose to elaborate a method and a computational program that accesses a database and make possible this kind of mapping of materials based on their properties.
3. CONCLUSIONS
1. A first conclusion is that, during the choosing process of plastics, such form of maps
and representations of parameters, in pairs of two, can be very useful. Because the test results are relevant, the material group will be chosen as a criterion defined by limiting the physical or mechanical parameter value, for example, limiting the average value of modulus of elasticity or any other parameters from the group.
2. Of course every two-dimensional map that can be raised within a group of plastics is important for the design engineer during the choosing process of materials because it gives the possibility of matching it with the best goal, defined by technical parameters and physical properties.
E
la
st
ic
l
im
it
[M
P
a]
3. Graphical results are obtained in the form of rectangles, one for each material, with sides equal to dispersion value of the two parameters of analysis. Due to the different edge values for each of the two analysis parameters, some material can be spread very largely of incremental values, and the other less; also the location of each material in the map gives a very clear picture of the ratio values of the two parameters of analysis in the material group, which can lead to drawing conclusions of a practical nature of the relationship between the two parameters and how they relatively influence each other.
4. The problem with using such maps dispersion parameters in pairs analysis is more difficult if the number of plastics considered in the group is too large, which is why the authors believe that by first restricting the group to a maximum of 8 - 12 items, the analysis will be more easy and more efficient.
5. Such representations in the form of maps of two parameters are easily interpreted, analyzing the position and extent of each material in the map, being able to find
combinations of two or more materials when a design project for a new product requires.
8. REFERENCES
[1] Ashby, M.F. (1999) “Materials Selection in
Mechanical Design,” 2nd Edition,
Butterworth Heinemann, Oxford, UK. ISBN 0-7506-4357-9.
[2] CES 4 (2002) “The Cambridge Engineering
Selector,” Version 4, Granta Design,
Cambridge, UK, www.granta.co.uk, pp. 14-17 [3] Charles, J.A., Crane, F.A.A. and Furness, J.A.G.
“Selection and Use of Engineering Materials,”
3rd edition, Butterworth Heinemann, Oxford, UK. ISBN 0-7506-3277-1, (1997)
[4] Harper, C.A. (Editor) “Handbook of Materials
for Product Design,” 3rd edition, McGraw Hill,
New York, USA. ISBN 0-07-135406, (2001);
[5] Urška Sancin and Bojan Dolšak, Decision
Support System for Designing with Polymer Materials – Current Challenges and Future
Expectations, Efficient Decision Support
Systems - Practice and Challenges From Current to Future, Edited by Prof. Chiang Jao, ISBN 978-953-307-326-2, pg. 493 – 508, September, 2011
ANALIZA CORELATIEI PROPRIETĂŢILOR FIZICO-MECANICE ALE MATERIALELOR PLASTICE IN PROCESUL DE PROIECTARE A PRODUSELOR NOI
Rezumat: Contribuţa autorilor lucrării constă în elaborarea şi prezentarea unui model unitar de analiză comparativă a diferiţilor parametri fizico-mecanici ai diferitelor materiele plastice, pentru a usura procesul de alegere selectivă a acestora în inginerie, în general şi, în designul industrial a noilor produse, în special. Metoda de analiză propusă are la bază reprezentarea grafică a valorilor parametrilor sub formă de dreptunghiuri, harta bidimensională astfel obţinută fiind foarte uşor de intepretat. Din analiza poziţiei şi extinderii fiecărui material in cadrul hărţii, se pot găsi combinaţii de două sau mai multe materiale adecvate prin proprietăţiile lor, atunci când un proiect de design, pentru un nou produs, implică acest lucru.
Petru Rares RUŞAN, Phd, Student. Dipl. Eng., Technical University of Cluj-Napoca, B-dul. Muncii, no. 103-105, Department of Engineering Design & Robotics, Office phone: 0743-062756, raresrusan@gmail.com
Ioan BLEBEA, Prof. Dr., Dipl.,Eng., Technical University of Cluj-Napoca, B-dul. Muncii, no. 103-105, Department of Engineering Design & Robotics, Office phone: 0264-401664, ioanblebea47@gmail.com