J
ournal of
F
isheries
S
ciences.com
E-ISSN 1307-234X©
RESEARCH ARTICLE ARAŞTIRMAMAKALESİ
DETERMINATION OF THE TOTAL LIPID AND THE
LONG CHAIN OMEGA-3 POLYUNSATURATED
FATTY ACIDS, EPA AND DHA, IN DEEP-SEA FISH
AND SHARK SPECIES FROM THE NORTH-EAST
ATLANTIC
Peter G. Dunne
1∗, Denis A. Cronin
2, Martine H. Brennan
1, T. Ronan Gormley
11
Ashtown Food Research Centre (AFRC) (Teagasc), Dublin 15, Ireland.
2
Department of Food Science, School of Agriculture, Food Science & Veterinary Medicine, College of Life Sciences, University College Dublin, Dublin 4, Ireland.
Abstract:
The lipid and long chain omega-3 polyunsaturated fatty acid (LC ω-3 PUFA) contents of spot samples of 22 under-utilised species of deep-sea fish were determined. The total lipid content was determined by a rapid extraction technique which used anhydrous sodium sulphate and ethanol to immobilise the moisture in the fish tissue followed by extraction of lipid with hep-tane at 80-85°C. The heptane extract was analysed in a liquid cell between NaCl windows on an infra-red (IR) spectrophotometer. Lipid content of the extract was calculated from the area of the IR spectrophotometric ester stretching band between 1700 and 1800cm-1. After evapora-tion of the heptane, the residue was determined gravimetically. The IR and gravimetric (where sufficient crude lipid quantities were present) results were generally in good agreement. Eigh-teen fish had lipid contents < 1.1g/100g, ranging from 0.18 (birdbeak dogfish, Deania calceus) to 1.1g/100g (forkbeard, Phycis blennoides), while four had lipid contents ranging from 4.25 (Baird’s smoothead, Alepocephalus bairdii) to 16.2g/100g (snake mackerel, Nessiarchus nas-sutus). However, both snake mackerel and orange roughy (Hoplostethus atlanticus) produced IR spectra consistent with the literature findings that they contain high levels of undigestible wax esters. The ω-3 PUFA, eicosapentaenoic acid (C20:5ω-3, EPA) and docosahexaenoic acid (C22:6ω-3, DHA) were determined using capillary gas chromatography. As a source of dietary
ω-3 PUFA, the low-fat fish were generally poor suppliers with amounts ranging from 0.04g/100g (birdbeak dogfish) to 0.29g/100g (greater argentine, Argentina silus) but several species were not substantially inferior to cod (Gadus morhua). The two high lipid species containing large amounts of wax esters, although having appreciable levels of ω-3 PUFA would not be desirable from a dietary point of view. In most of the fish DHA was present at 3 to 6 times the level of EPA.
Keywords:
Fish, Lipid, Fatty acids, Infra-red spectrophotometry, Gas chromatography
∗
Correspondence to: Peter DUNNE, Teagasc, Ashtown Food Research Centre, Ashtown, Dublin 15, IRELAND
Tel: +353 (0) 49 906 1206 Fax: +353 (0) 46 9026154
Özet:
Kuzey-
Doğu Atlantik Derin Deniz Balık ve Köpekbalığı
Türlerinde Total Lipid, Uzun Zincirli Çoklu Doymamış
Omega-
3 Yağ Asitleri, EPA ve DHA’nın Belirlenmesi
Tüketilmeyen 22 derin deniz balığı türünde yağ ve uzun zincirli çokdoymamış omega-3 yağ asitleri (uzun zincirli ω-3 PUFA) analiz edilmiştir.Total lipid içeriği hızlı ekstraksiyon tekniği ile belirlendimiş. Bu teknik anhydrous sodyum sülfat kullanarak balıktaki nemi immobilize etme ve dokulardan yağın heptan kullanılarak 80-85°Cde çıkarılması prensibine dayanmaktadır. Heptan ekstraktı, NaCl camları arasında sıvı bir hücre içinde IR spektrofotometrede analiz edilmiştir. Ekstraktın lipid içeriği IR spektrofotometrik ester bandında 1700 ve 18000 cm-1 aralığında belirlenmiştir. Heptan evapore edildikten sonra, kalıntı gravimetrik olarak belirlenirken, IR ve gravimetrik ölçümler (yeterli ham yağ örneği miktar olduğunda) genel olarak benzer bulunmuştur. 18 balıkta lipid içeriği <1.1g/100g bulunmuştur. Sonuçlar 0.18 (Deania calceus) ve 1.1g/100g (Phycis blennoides) aralığındadır. Diğer 4 türde ise lipid içeriği 4.25 (Alepocephalus bairdii) ve 16.2g/100g (Nessiarchus nassutus) aralığında tesbit edilmiştir. Nessiarchus nassutus ve Hoplostethus atlanticus üzerinde yapılan testlerde,literatür taramasına paralel olarak yüksek oranda sindirilmeyen wax esterleri bulunmuştur. ω-3 PUFA, eicosapentaenoic asit (C20:5ω-3, EPA) ve docosahexaenoic asit (C22:6ω-3, DHA) gaz kramatografisi kullanılarak tesbit edilmiştir. ω-3 PUFA açısından, 0.04g/100g (Deania calceus) ve 0.29g/100g (Argentina silus) gibi düşük lipid içeriğine sahip türler fakir kaynaklar olarak bulunmuş, ama birçok türün Gadus morhuadan ω-3 PUFA’ yı daha az içermediği de görülmüştür. Tüketici açısından düşünüldüğünde, yüksek oranda wax ester içeren yüksek yağlı türler, yeterince ω-3 içermesine rağmen tercih edilmez. Balıkların çoğunda, DHA ise EPAya göre 3-6 kat daha fazla mevcuttur
Anahtar Kelimeler: Balık, Yağ, Yağ asitleri, Infra-red spektrofotometresi, Gaz
Kromotografisi
Introduction
The positive benefits to health resulting from an increased consumption of fish have been effectively demonstrated over the last two decades (Kris-Etherton et al., 2002). In particular, their potential for the prevention or alleviation of the symptoms of coronary heart disease (CHD) has been the subject of extensive research (Burr, 1991; Herold & Kinsella, 1986; Kinsella et al., 1990). Kinsella (1986) concluded that consumption of fish oils containing omega(ω)-3 long chain polyunsaturated fatty acids (LC-PUFA) may have beneficial effects for ischaemic heart disease and thrombosis. Epidemiological evidence has reinforced this hypothesis (Kris-Etherton et al., 2002). The intake of LC ω-3 PUFA, specifically those present in relative abundance in fish and the flesh of marine mammals, i.e. eicosapentaenoic acid, C20:5ω-3 (EPA) and docosahexanenoic acid, C22:6ω-3 (DHA), by the indigenous Inuit population of Greenland has been linked with their low incidence of CHD (Dewailly et al., 2001; Dyerberg & Bang, 1979; Dyerberg et al., 1978, 1975).
The LC ω-3 PUFA from fish oils (EPA and DHA) can induce and are associated with certain desirable changes in blood plasma lipids. These include lower levels of cholesterol, triacylglycerols, low density lipoprotein (LDL), and very low density lipoprotein (VLDL) as well as higher levels of the beneficial high density lipoproteins (HDL) (Dewailly et al., 2001; Herold & Kinsella, 1986). These PUFA should be distinguished from the plant oil ω-3 PUFA such as α-linolenic acid which is found in soya, rapeseed and linseed oils since, in the context of CHD prevention, these fatty acids are not necessarily equivalent in potency or efficacy to the marine oil PUFA (Holub et al., 2002). Kinsella (1986) stated that when fish oil is used to substitute rather than supplement conventional dietary fat, especially saturated fatty acids, more favourable results for health ensue. The effect of
The ω-3 PUFA are thought to exert their beneficial effect at a biochemical level by having an influence on the metabolism of the ω-6 series of PUFA which include arachidonic acid, (C20:4) and it’s essential dietary precursor, linoleic acid (C18:2). Both are precursors of a wide range of related compounds, the eicosanoids, some of which have desirable and others undesirable ef-fects, partly mediated by either their anti- or pro-aggregatory tendencies; the beneficial effects of
ω-3 PUFA on CHD are mediated by both eico-sanoid-dependent and eicosanoid-independent processes as outlined by Holub (2002).
While the benefits to health of an increased consumption of fish or fish oil in the diet are widely recognised (Burr, 1991; Vanschoonbeek et al., 2003), traditional Northeast Atlantic fish stocks such as cod (Gadus morhua) and blue whiting (Micromesistius poutassou) have at the same time been depleted (Anon, 2005). In an at-tempt to conserve stocks and ensure a sustainable supply of fish in order to protect the fishing in-dustry and the land-based processing sector quo-tas have been imposed. Although concerns persist about their commercial viability and even sustai-nability (Clark, 2001) attention has begun to fo-cus on several deep-sea fish and shark species. These species have, in the past, been under-uti-lised in comparison with traditional whitefish species such as cod, haddock (Melanogrammus aeglefinus), whiting (Merlangius merlangus), plaice (Pleuronectes platessa) and sole ( Micro-stomus kitt).
Gregory (1995) assessed the potential useful-ness of this under-utilised resource. Maier et al. (1997) assessed 9 deep-water fish species which were processed to breaded nuggets and found that all species compared favourably with cod nug-gets. Previously, Sawyer et al. (1981) had com-pared flavour and texture characteristics of se-lected under-utilised species of North Atlantic fish and certain other commercially important species, and had obtained considerable variations in intensity of profile attributes within most of the species. A report (Anon, 1974) based on pre-liminary studies on several of these under-utilised
species, concluded that they would be unlikely to be commercially acceptable as whole fish or fil-lets, but several would probably be acceptable as fish fingers or smoked products.
Sensory evaluation studies have also been car-ried out to assess the acceptability of the current species as judged against cod. Cooked fillets were scored for acceptability and four species were preferred to cod (orange roughy, black scabbard, morid cod and Portuguese dogfish); when prepared as nuggets from minced fish ten species were preferred to cod (Brennan & Gormley, 1998). Measurement of the ω-3 PUFA (EPA and DHA) content of these fish (as well as a wider fatty acid profile) was required in order to assess the contribution that consumption of these fish could make to intakes of marine ω-3 PUFA. This would enable an assessment of any potential health benefits to the Irish population, which has an unenviably high level of CHD, to be made.
The objectives of the present study were (a) to extract and measure the quantities of total lipid in spot samples of the 22 fish species, using a rapid infra-red (IR) spectrophotometric method devel-oped in this department (O’ Neill, 1998), (b) to measure concentrations of the LC ω-3 PUFA, EPA and DHA and (c) to obtain broader fatty acid profiles for each species, to evaluate its po-tential effectiveness as a source of dietary ω-3 PUFA
Materials and Methods
Fish samples
Table 1. Under-utilised fish and shark species.
Fish No. Latin Name Common Name
1. Alepocephalus bairdii Baird’s smoothead
2. Anarhichus minor Spotted wolf-fish
3. Aphanopus carbo Black scabbard
4. Argentina silus Greater argentine
5. Brosme brosme Tusk
6. Centrophorus squamosus Leafscale gulper shark
7. Centroscymnus coelolepis Portuguese dogfish
8. Centroscymnus crepidater Longnose velvet dogfish
9. Chimaera monstrosa Rabbitfish
10. Coryphaenoides rupestris Roundnose grenadier
11. Deania calceus Birdbeak dogfish
12. Etmopterus princeps Greater lantern shark
13. Helicolenus dactylopterus Bluemouth rockfish
14. Hoplestethus atlanticus Orange roughy
15. Hydrolagus affinis Small-eyed rabbitfish
16. Micromesistius Poutassou Blue whiting
17. Molva dipterygia Blue ling
18. Molva molva Ling
19. Mora moro Morid cod
20. Nessiarchus nassutus Snake mackerel
21. Phycis blennoides Forkbeard
22. Todarodes sagittatus Flying squid
Sample Preparation
Samples were removed from the freezer and approximately 20g was recovered for analysis. After thawing, skin and bones were removed and the fish was macerated as finely as possible using a sharp knife.
Fat Extraction
Triplicate samples (2g) were accurately weighed into 12cm long pyrex boiling tubes containing Quickfit (Lennox Laboratory Sup-plies, Ltd., Dublin, Ireland) SQ24 screw cap out-lets. Approximately 2g of anhydrous Na2SO4 was
added as a drying agent to immobilise the water in the samples. A glass rod was used to facilitate thorough mixing of this salt with the sample. Ethanol (2ml) was pipetted into the boiling tube and the contents were heated in a water bath set at 80-85°C for 0.5 – 1 min. After removal from the water bath and cooling, 10ml of heptane was added. The tube was vortexed for approximately 30s, fitted with an air condenser, 0.6m in length, and then replaced in the water bath at 85°C and heated for 20 min. After 10 min. the arrangement
was removed from the water bath and again vor-texed for 30s; the process was again repeated at the end of the 20 min. heating period when the condensers were removed and the boiling tubes were left to cool. Distilled water (10ml) was then added, the tubes capped and their weights checked and adjusted by adding more water, if necessary. They were shaken vigorously for 30s and finally centrifuged for 10min. at 3000 rpm (DuPont Instruments Sorvall®-GLC-2B, General Laboratory Centrifuge, Sorvall, Newton, CT, USA). IR spectrophotometric analysis was then carried out on the clear heptane upper layer ob-tained after centrifugation.
Gravimetric measurement of lipids in heptane extracts
Reference method for fat extraction
The reference method for fat extraction used was that recommended by Hubbard et al. (1977). The finely chopped fish (10g) was weighed accu-rately into a mortar. Some grinding sand was added, followed by 30ml of dichloro-methane/methanol (2:1). The sample was ground vigorously for 2-3 min. and the extract was fil-tered (Whatman No. 541 filter paper) into a 250ml separating funnel. The residue was re-turned to the mortar and ground with a further 25-30 ml of solvent followed by filtration. After repeating the process once more, the resulting combined solvent extracts in the separating fun-nel were washed with 2 × 15 ml aliquots of wa-ter. Following inversion, venting and settlement the lower solvent layer was filtered through Na2SO4 into a weighed round-bottomed flask.
The remaining aqueous layer was washed twice with 10 ml aliquots of dichloromethane. When settled, this lower dichloromethane layer was also added to the round-bottomed flask. The solvent was removed by distillation and the lipid residue was oven-dried at 100°C for 30 min. and weighed.
IR Analysis of Lipid Extracts
IR analysis of the heptane lipid extracts was carried out on a Research Series Mattson FTIR spectrophotometer equipped with software for quantitative measurements (Mattson Instruments, 5225 Verond Rd., Madison, WI 53711-4495, USA). A resolution of 4 cm–1 was used and 16 scans were recorded per sample. Spectra were measured using a liquid cell fitted with sodium chloride windows (pathlength 0.3 mm). Sample spectra were ratioed against 0.2% w/v solutions in heptane of either cod flesh oil (CFO) or cod liver oil (CLO) and the band area of the carbonyl group stretching region between 1700cm-1 and 1800cm-1 was measured and the lipid content cal-culated from a calibration graph prepared using the appropriate fish oil.
Calibration of IR method for lipid measure-ment in fish
Total lipid content of the heptane extracts was determined from the area of the residual band (1700-1800cm-1) obtained from the ratioed spec-tra of the samples against a reference fish oil standard (0.02g cod oil in 10ml heptane) as back-ground. CLO was used as the reference material for 2 of the 4 high lipid fish supplied in this
study. The majority were of the whitefish variety which had low (< 1%) total lipids, the latter being composed mainly of structural lipids, such as phospholipids, rather than triacylglycerols. Lipid extracted from fresh cod flesh with dichloro-methane/ methanol (2:1) was used as the refer-ence for these. Calibration graphs for both fish types were prepared by running a series of stan-dards (0.005-0.04g/10ml heptane) against a background spectrum of the reference lipid (0.02g/10ml heptane) and are shown in Fig. 1 and Fig. 2. Lipid content of the sample (g/100g) was then calculated by a procedure described by O’Neill (1998), i.e. the area of the residual band in the ratioed spectrum is used in the equation for the calibration graph to calculate the concentra-tion of lipid in the sample extract (x g / 10ml). Then,
Lipid in sample, g/100g =
± ) ( ) 100 ( 02 . 0 g Sample x
Preparation of fatty acid methyl esters (FAME) and gas Chromatographic (GC) Analysis of Fish Lipids
The lipid residue (20-30 mg in most cases) re-sulting from the evaporation of the heptane was dissolved in 3-5 ml of diethyl ether, transferred to a 25 ml volumetric flask and evaporated to dry-ness on a water bath. Methanolic NaOH (3ml; 0.5M) was then added and the sample saponified by heating on a water bath for 3 min. After cool-ing, 3ml of boron trifluoride (BF3)/methanol
re-agent was added and the mixture heated for a further 3 to 4 min. to complete the methylation. After removal and cooling 2ml of hexane was added to the flask. Saturated NaCl was added, in order to bring the hexane (containing the FAME) into the neck of the flask, where it was drawn off using a Pasteur pipette, transferred to a vile and stored in the refrigerator until analysis.
detector. The carrier gas was H2 at a flow rate of
4ml/minute and the temperature programme employed increased oven temperature from 150 to 220°C at 5°C/minute from injection. Peak identities were assigned by measuring their retention relative to methyl palmitate (C16:0 methyl ester) and comparing the relative retention times (RRT) with those of authentic standards (Table 2). Quantitation of individual fatty acids was obtained by normalisation of peak areas without the use of response factors.
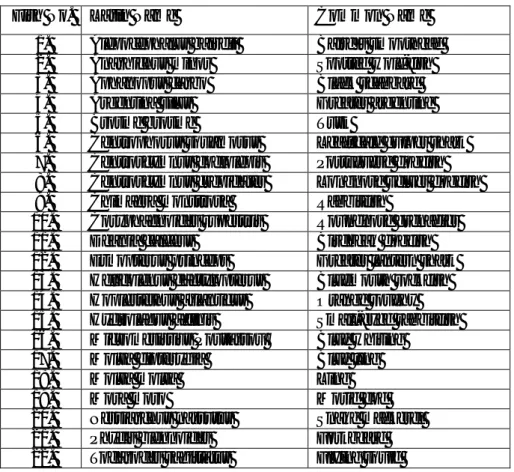
Table 2. Relative retention times (RRT) of FAME standards relative to methyl palmitate (C16:0).
Fatty acid a RRT 14:0 0.63 16:0 1.00 16:1 1.06 18:0 1.42 18:1 1.48 18:2 1.58 18:3 1.72 20:0 1.76 20:1 1.92 20:4 2.18 20:5 2.38 22:1 2.46 22:5 3.25 22:6 3.46
a fatty acids denoted by number of carbon atoms: number of double bonds b
methyl palmitate (16:0) assigned an arbitrary retention time of 1.00
Results and Discussion
Measurement of total lipids in fish samples
While the rapid IR method had already been validated for confectionery products, this was the first application to the measurement of lipid in low-fat, high moisture products. Thus, the scope of the study allowed us to evaluate its feasibility and performance against a number of more con-ventional methods of lipid determination such as Soxhlet extraction and dichloromethane/methanol extraction. Accurate determination of the total lipid content of the fish examined was important as it was needed to evaluate the different species as sources of dietary ω-3 fatty acids. It was in-itially intended to use a standard extraction pro-cedure for gravimetric determination of total li-pids. Since the majority of fish species examined were expected to be of the low fat (< 1g/100g) type, some preliminary experiments were carried
out using cod, which has a lipid content of 0.6-0.7g/100g (Paul & Southgate, 1992). Oven dry-ing of cod samples at 100°C overnight followed by Soxhlet extraction with diethyl ether gave an exceptionally poor recovery of lipids (0.1g/100g), since the drying appeared to have resulted in oxidative polymerisation of the highly unsatu-rated lipids. Extraction of samples which had been freeze-dried for 48h gave somewhat better (0.3g/100g) but still low recoveries. The flesh of some of the fish species examined had a tough, grisly texture and was rather difficult to cut up and obtain representative samples. For this rea-son, triplicate 2g samples were analysed for most of the fish and reproducibility was generally quite satisfactory (standard deviations ranged from 0 to 1).
Application of the well established dichloro-methane/methanol (2:1) procedure to raw cod and to 4 other species (rabbitfish, orange roughy, snake mackerel and flying squid) gave better re-coveries but was also fraught with difficulties. The main problem, particularly bad in the case of Baird’s smoothead, was the formation of emul-sions as soon as water was added to make the system biphasic. A clean separation of layers and production of a clear dichloromethane layer took place very slowly (16h) and replicated analyses were very poor (± 30g/100g). It was for this rea-son that a new procedure using heptane/ethanol extraction and IR analysis of the extracted lipid was evaluated. This procedure had recently proved highly successful for the analysis of total fat in difficult matrices such as biscuits and con-fectionery (O’Neill, 1998). There were two problems associated with the application of this technique to fish. Firstly, the high moisture (ap-proximately 80 %) content of the fish, which would impair contact of solvent and sample dur-ing extraction and secondly, the selection of a suitable reference for IR analysis.
ester stretching (Freeman, 1968). A 0.2% w/v solution run against heptane as background gave a triacylglycerol band area of 1.85. By contrast, cod flesh lipid extract has an absorbance maximum at approximately 1743cm-1 caused by the phospholipids which predominate and because these phospholipids only have two fatty acid chains per molecule as compared with three for triacylglycerols. The area of the ester stretching band in a 0.2% w/v solution of CFO is thus only 1.00.
Application of this lipid measurement technique to a number of cod samples gave results which were quite close to published values, implying that efficient extraction of the lipid was occurring. The results obtained for the lipid analysis of the 22 fish species are presented in Table 3. There was quite a reasonable agreement between lipid contents calculated by IR analysis and those obtained gravimetrically by evaporation of the heptane extracts (where sufficient lipid could be extracted; see Table 3). Of the 22 species, 18 had lipid contents less than 1.1g/100g (range 0.18 to 1.08 g/100g; mean 0.54g/100g) and CFO appeared to be a suitable reference fat for measurement of these by IR analysis. However, of the ‘oily’ fish (n=4) only two, Alepocephalus Bairdii (Baird’s smoothead) and Anarhichus minor (spotted wolf-fish) had genuine triacylglycerols as the major lipid component and were measured most accurately using the CLO calibration. The other ‘oily’ fish,
Hoplestethus atlanticus (orange roughy) and
Nessiarchus nassutus (snake mackerel) gave much lower lipid results when measured by IR against CLO compared to the figure obtained by weighing the evaporated heptane extract. However, using CFO the agreement was much better. Moreover, 0.2% (w/v) solutions of the oil extracted from both of these fish gave band areas
of close to 1.00 and exhibited absorbance maxima at 1743cm-1.
While we have been unable to find very much information on the lipid composition of most of the fish species examined in the study, Hayashi & Takagi (1980) have reported that wax esters make up 88% of the lipids of orange roughy. These compounds, which are esters of long chain aliphatic alcohols and long chain acids, would be expected to absorb between methyl esters of long chain fatty acids (1730cm-1) and triacylglycerols (1751cm-1). Wax esters, which are not digestible by humans, would also appear to constitute most of the lipid fraction of snake mackerel. With a lipid content of 16.2g/100g, this would hardly be a palatable fish. Sparks & deWit (1980) reported that fish with a high wax ester content were not permitted for sale in Japan.
Table 3.Mean lipid content of under-utilised fish and shark species as determined by infra-red spectrophotometry and gravimetrically.
Fish No.a Lipid content (g/100g)
IR method Heptane residue
1. 3.73 4.25 2. 5.93 6.10 3. 0.93 1.06 4. 0.67 0.63 5. 0.35 0.35 6. 0.67 0.56 7. 0.59 0.50 8. 0.65 0.63 9. 0.75 0.63 (0.75)b 10. 0.50 0.52 11. 0.10 0.18 12. 0.30 0.30 13. 0.67 0.69 14. 7.6 7.23 (7.7) 15. 0.61 0.70 16. 0.44 0.56 17. 0.24 0.33 18. 0.54 0.32 19. 0.38 0.36 20. 16.0 16.2 (15.3) 21. 0.60 1.08 22. 0.51 0.37
aFish numbers correspond to those in Table 1.
b Values in parentheses were obtained by dichloromethane/methanol extraction
Fish species as sources of ω-3 PUFA
Although the EPA and DHA contents and fatty acid profiles of an extensive range of fish has been reported previously (Özogul et al., 2009; 2008; 2007; Ackman, 2000), many of the fish and shark species examined in the present study have not been examined. The EPA and DHA contents of the 22 fish species are reported
Table 4. Mean ω-3 polyunsaturated (PUFA) contents of the 22 under-utilised fish and shark species expressed on a lipid basis.
Fish No.a EPA b DHA c EPA + DHAd 1. 1.1 4.4 5.5 2. 6.5 4.8 11.3 3. 3.7 13.8 17.5 4. 9.9 36.7 46.6 5. 6.4 44.9 51.3 6. 2.1 37.2 39.3 7. 2.6 31.6 34.2 8. 3.1 36.2 39.3 9. 4.6 35.9 40.5 10. 9.9 24.5 34.4 11. 2.4 22.7 25.1 12. 2.9 39.1 42.0 13. 5.0 30.9 35.9 14. 8.3 0.9 9.2 15. 3.8 19.6 23.4 16. 20.8 29.3 50.1 17. 3.9 38.1 42.0 18. 11.2 41.3 52.5 19. 8.1 27.3 35.4 20. 2.9 4.2 7.1 21. 4.8 21.6 26.4 22. 18.2 44.3 62.5
a Fish numbers correspond to those in Table 1. b
EPA, eicosapentaenoic acid (C20:5, ω-3), as g/100g of lipid c DHA, docosahexaenoic acid (C22:6, ω-3), as g/100g of lipid d total ω-3 PUFA assumed to be the sum of EPA and DHA, as
g/100g of lipid.
Fatty or ‘oily’ fish, such as herring, mackerel and salmon are excellent sources of LC ω-3 PUFA with combined levels of EPA and DHA ranging from around 1 to in excess of 5g / 100g fish (Cronin & O’Sullivan, 1990). By contrast, the 18 low fat fish examined in the present study were quite modest sources with amounts ranging from as low as 0.04g/100g fish (birdbeak dog-fish) to 0.29g/100g fish (greater argentine, fork-beard) with a mean of 0.2g/100g fish. Cod, with a
lipid content of around 0.6g/100g and total ω-3 PUFA of 47% would provide about 0.3g ω-3 PUFA /100g of, so the species examined are in general somewhat poorer sources than cod. Ac-cording to Soltan & Gibson (2008) low fat fish are limited sources of ω-3 PUFA; these authors reported that low fat fish had concentrations of
ω-3 PUFA which were an order of magnitude lower than those of high fat fish such as Atlantic salmon and swordfish. The results of Soltan & Gibson (2008) with low fat fish corroborate the findings of the present study. Indeed, the analyti-cal challenges presented by many of the fish in the present study, in terms of their unsuitability to conventional gravimetric determination of total lipid necessitated the application of the rapid IR technique discussed.
Of the two ‘oily’ species containing triacyl-glycerols, Alepocephalus bairdii with a lipid content of 4.25g/100g but containing only 5.5 g
Table 5. Major fatty acids in lipids of under-utilised fish and shark species, excluding eicosapentaenoic acid and docosahexaenoic acid.
Fish No. a
Fatty acid composition (g/100g lipid)
C16:0 C16:1 C18:0 C18:1 C18:2 C20:1 C20:4 C22:1 C22:5 1. 16.2 6.2 3.8 13.2 0.8 11.9 0.9 21.2 1.7 2. 15.2 11.4 2.5 36.3 0.5 4.5 1.7 0.8 1.0 3. 15.5 3.2 4.8 27.2 0.9 10.5 1.5 9.9 1.3 4. 19.5 2.2 2.6 1.4 1.2 5.6 1.8 5.6 1.9 5. 25.8 1.4 3.7 10.6 - 2.9 5.0 - - 6. 18.2 1.3 7.2 14.6 2.2 1.8 5.7 - 1.9 7. 18.6 1.4 7.8 14.0 1.1 1.9 7.6 - 2.7 8. 23.4 1.1 3.5 13.0 1.3 2.1 5.0 - - 9. 22.4 1.5 4.3 14.2 0.9 - 5.7 - - 10. 13.7 1.9 1.7 18.9 1.4 4.3 2.1 2.0 1.0 11. 23.1 1.5 5.3 20.0 1.7 4.9 1.9 4.5 2.4 12. 7.4 - 4.4 17.3 - 2.1 6.8 - - 13. 16.4 3.1 4.0 17.5 1.3 1.4 3.6 0.9 2.0 14. 1.8 6.5 0.5 31.8 0.8 11.0 0.2 5.2 9.7 15. 15.9 2.4 5.0 14.6 0.8 2.5 4.8 1.3 4.4 16. 21.6 1.4 4.3 6.6 1.6 1.3 1.7 - - 17. 20.4 2.0 4.7 16.2 2.0 1.3 5.7 - 1.5 18. 18.3 1.6 4.9 10.8 1.0 1.9 3.8 - 1.4 19. 22.0 1.6 4.6 16.5 1.6 2.1 4.4 2.0 2.3 20. 1.9 2.2 3.4 33.0 1.3 6.5 0.3 4.2 0.6 21. 12.2 1.8 2.9 21.2 0.9 3.7 2.4 2.3 1.4 22. 22.0 - 4.1 2.9 0.5 5.0 - - -
a
Fish numbers correspond to those in Table 1. - not detected
y = 50x - 1
R2 = 1
-1 -0.8 -0.6 -0.4 -0.2 0 0.2 0.4 0.6 0.8 1 1.2
0 0.01 0.02 0.03 0.04 0.05
cod oil(g/10ml) v cod oil (0.02g/10ml) in heptane
R
es
id
u
a
l b
a
n
d
a
re
a
(
1
7
0
0
1
8
0
0
c
m
-1)
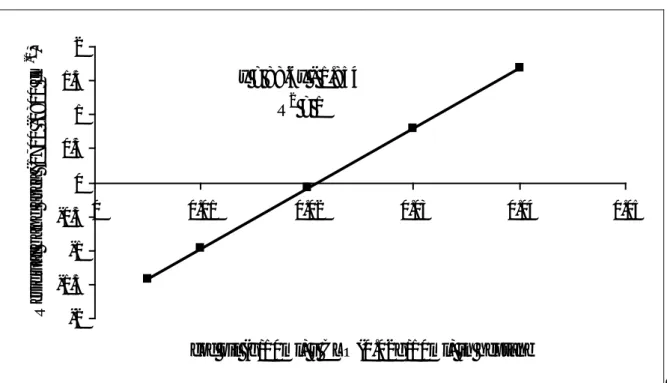
y = 88.6x - 1.854
R
2= 1
-2 -1.5 -1 -0.5 0 0.5 1 1.5 2
0 0.01 0.02 0.03 0.04 0.05
cod oil (g/10ml) v CLO(0.02g/10ml) in heptane
R
es
id
u
al
b
an
d
ar
ea (1700 -1800 c
m
-1 )
Figure 2. Cod liver oil standards (g/10ml) run against a background of spectrum of cod oil (0.02g in 10ml heptane).
0 0.2 0.4 0.6 0.8 1 1.2 1.4
Alepocephalus b airdii Anarhichus m inor Aphanopus carb o Argentina silus Brosm e b rosm e Centrophorus squam osus Centroscymnus coelolepis Centroscymnus crepidater Chim aera m onstrosa Coryphaenoides rupestris Deania calceus Etm opterus princeps Helicolenus dactylopterus Hoplostethus atlanticus Hydrolagus affinis Microm esistius poutassou Molva dipterygia Molva m olva Mora m oro Nessiarchus nassutus Phycis b lennoides Todarodes sagittatus
g omega-3/100g whole fish
Figure 3. The concentration of total omega-3 PUFA (the sum of EPA and DHA) per 100g of whole
Conclusion
The rapid method for lipid extraction de-scribed in this study was highly promising, in ei-ther the IR or gravimetric modes, for the meas-urement of total lipid in low fat fish species. As a source of dietary LC ω-3 PUFA the low fat fish were generally poor suppliers, but several species were similar to cod. Two of the high fat species contained mainly wax esters in their lipids and would not be desirable sources of LC ω-3 PUFA.
Acknowledgements
The Marine Institute, Fisheries Research Centre, is thanked for providing the fish samples. Technical assistance provided by Rosemary Gormley is appreciated.
References
Ackman, R.G., (2000). Fatty acids in fish and shellfish. In: Fatty acids in foods and their health implications. C.K. Chow (Ed.), Sec-ond Edition, Marcel Dekker, Inc., New York, pp. 153-174.
Anon, (2005). Review of the state of world ma-rine fishery resources. FAO Fisheries Tech-nical Paper 457. Food & Agriculture Or-ganisation of the United Nations, Rome. Anon, (1974). Deep water trawl fish tested for
food market, Fishing News International,
13: 47-49.
Brennan, M.H., Gormley, T.R., (1998). Quality evaluation of under-utilised fish species.
Proceedings of the 28th Annual Food Sci-ence and Technology Research ConferSci-ence, University College Cork, September. p75. Burr, M.L. (1991). Is oily fish good for the
heart?, Trends in Food Science & Technol-ogy, 2: 17-20.
Clark, M., (2001). Are deepwater fisheries sus-tainable? – the example of orange roughy (Hoplostethus atlanticus) in New Zealand,
Fisheries Research, 51: 123-135.
Clarke, M.W., Connolly, P.L., Kelly, C.J., (1999). Preliminary catch, discards and se-lectivity results of trawl survey on deepwa-ter slopes of the Rockall trough, Marine In-stitute Fishery leaflet 178, Marine InIn-stitute, Galway, Ireland. Available at:
December 7, 2007]
Cronin, D.A., O’Sullivan, K., (1990). Processed fish products as sources of n-3 polyunsatu-rated fatty acids, Irish Journal of Food Sci-ence and Technology,14: 17-24.
Deng, J.C., (1978). Effect of iced storage on free fatty acid production and lipid oxidation in mullet muscle, Journal of Food Science,43:
337.
Dewailly, E., Blanchet, C., Lemieux, S., Sauvé, L., Gingras, S., Ayotte, P., Holub, B.J., (2001). n-3 fatty acids and cardiovascular disease risk factors among the Inuit of Nu-navik, American Journal of Clinical Nutri-tion, 74: 464-473.
Dyerberg, J., Bang, H.O., (1979). Haemostatic function and platelet polyunsaturated fatty acids in Eskimos, The Lancet, 314: 433-435. Dyerberg, J., Bang, H.O., Stoffersen, E.,
Mon-cada, S., Vane, J.R. (1978). Eicosapen-taenoic acid and prevention of thrombosis and atherosclerosis. The Lancet, 312: 117-119.
Dyerberg, J., Bang, H.O., Hjorne, N. (1975). Fatty acid composition of the plasma lipids in Greenland Eskimos. American Journal of Clinical Nutrition, 28: 958-966.
Fletcher, G.C., Statham, J.A., (1988). Deteriora-tion of sterile chill-stored and frozen trum-peter fish, Journal of Food Science, 53:
1336.
Freeman, N.K., (1968). Applications of infra-red absorption spectroscopy in the analysis of lipids, Journal of the American Oil Chemists Society,45: 798-809.
Gormley, T.R., (1990). Chilled Foods – The State of the Art. Elsevier Applied Science Pub-lishers, London.
Gregory, H., (1995). Deepwater species offer re-source hope, Seafood International,10: 30-31.
atlanti-cus, Bulletin of the Japanese Society of Sci-entific Fisheries,46: 459-463.
Herold, P.M., Kinsella, J.E., (1986). Fish oil con-sumption and decreased risk of cardiovas-cular disease; a comparison of findings from animal and human feed trials. American Journal of Clinical Nutrition,43: 566. Holub, B.J., (2002). Clinical nutrition: 4.
Omega-3 fatty acids in cardiovascular care, Ameri-can Journal of Clinical Nutrition, 166: 608-615.
Hubbard, W.D., Sheppard, A.J., Newkirk, D.R., Prosser, A.R., Osgood, T., (1977). Compari-son of various methods for the extraction of total lipids, fatty acids, cholesterol and other sterols from food products, Journal of the American Oil Chemists Society, 54: 81-83.
Kinsella, J.E., Lokesh, B., Stone, R.A., (1990). Dietary n-3 polyunsaturated fatty acids and amelioration of cardiovascular disease: pos-sible mechanisms, American Journal of Clinical Nutrition, 52: 1-28.
Kinsella, J.E., (1986). Food components with potential therapeutic benefits. The n-3 poly-unsaturated fatty acids of fish oils, Food Technology,2: 89-97.
Kris-Etherton, P.M., Harris, W.S., Appel, L.J., (2002). Fish consumption, fish oil, omega-3 fatty acids and cardiovascular disease,
Cir-culation, 106: 2747-2757.
Maier, K., Gormley, T.R., Connolly, P.L., Auty, M., (1997). Assessment of underutilised fish species, Farm & Food, 7: 30-34.
O’Neill, J.P. (1998). Trans-fatty acids – occur-rence and measurement in foodstuffs and uptake in a selected Irish population group. PhD Dissertation , University College Dub-lin.
Özogul, Y., Özogul, F., Çiçek, E., Polat, A., Ku-ley, E., (2009). GC-capillary analysis of fatty acids in 34 seawater fish species, Jour-nal of Food Sciences and Nutrition,60: 464-475. Özogul, Y., Duysak, Ö., Özogul, F., Özkütük,
A.S., Türeli, C., (2008). Seasonal effects in the nutritional quality of the body structural tissue of cephalopods, Food Chemistry, 108:
847-852.
Özogul, Y., Özogul, F., (2007). Fatty acid pro-files of commercially important fish species from the Mediterranean, Aegean and Black Seas, Food Chemistry, 100: 1634-1638.
Paul, A.A., Southgate, D.A.T., (1992). McCance and Widdowson’s The Composition of Foods. UK Ministry of Agriculture, Fisher-ies & Food, 2: 89-97.
Sawyer, F.M., Prell, P., Candello, A.V., Maller, O. Kapsalis, J., (1981). A comparison of fla-vour and texture characteristics of selected underutilised species of North Atlantic fish and certain commercially important species,
Refrigeration Science and Technology, 4:
505-512.
Soltan, S.S.A.M., Gibson, R.A. (2008). Levels of omega-3 fatty acids in Australian seafood,
Asia Pacific Journal of Clinical Nutrition,
17: 385-390.
Spark, A.A., deWit, A.A. (1980). Wax esters in edible fish. Identification of fish. Annual Report of the Fishing Industry Institute, 34: 45.