Emerging Science Journal
Vol. 2, No. 1, February, 2018
Increasing the Thermal Efficiency of Double Tube Heat
Exchangers by Using Nano Hybrid
Mohamad Hosein Barzegar
a*, Mohamad Fallahiyekta
ba M.Sc student of Chemical Engineering of Islamic Azad University, Borujerd Branch, Iran b PhD of Chemical Engineering, Faculty Member of Islamic Azad University, Borujerd Branch, Iran
Abstract
In this study overall heat transfer in a double pipe heat exchanger fitted with twisted-tape elements and hybrid nanofluid were studied experimentally. Hybrid nanoparticles with a diameter of 20nm and a concentration of 1% (w/w) were prepared. The effects of temperature, mass flow rate, concentration of nanoparticles on the overall heat transfer coefficient and heat transfer changes in the turbulent flow regime were investigated. The results showed that when both of twisted tape and nanofluid have been used, heat transfer coefficient was about 40 percent higher than when they were not used. The experimental results also showed that 1% Al2O3/CuO nanofluid with twisted tape has slightly higher heat transfer when compared to 1% hybrid nanofluid without twisted tape. Neural networks used for modeling the system. The dependency of overall heat transfer coefficient of nanofluid (OHTCNF) on Reynolds number have depicted. The correlation coefficient for all data 0.98 is the successful prediction is shown. In this experimental work, nanoparticles were dispersed in hot current and cold water absorbed heat from hot nanofluid, so this system could be a good candidate for using in food industries, because at the end of this process there isn't any needs of extracting nanoparticles from the cold current. The heat transfer rate from the heating fluid was calculated by some known equations.
Keywords:
Nano Hybrid; Nanofluid; Thermal Efficiency; Heat Exchangers.
Article History:
Received: 25 July 2017
Accepted: 12 January 2018
1- Introduction
An equipment which is used for heat transfer between two fluids in industry, is Lehigh heat exchanger. Generally, viscos liquids like water are used in double pipe heat exchanger. Due to large heat transfer area, small footprint, well-designed mechanics, well-known creation techniques, and high applicability of wide range of materials, these types of heat exchangers are very common in the industry. However, there are some downsides to this equipment such as occupying large volumes in case of high thermal load. Moreover, price to heat transfer area ratio is rather high. Nanotechnology has been applied in these conventional heat exchanger which resulted in introducing nanofluids. (Choi [1]). The nanofluid had better heat transfer characteristics as opposed to previous fluids such as water, oil, or ethylene glycol. NFs are formed by dispersing solid particles, fibers, or tubes of 1 to 50nm length in conventional HT fluids. Nanofluids possess considerable thermal characteristics including high heat transfer rate, thermal homogeneity, and low fluctuation ability when passing through the passages. The advances in nanotechnology have resulted in the development of a category of fluids termed nanofluids, first used by a group at the Argonne National Laboratory in America in 1995. Aghayari et al. [2] examined dispersion of Al2O3 nanoparticles in liquid as a NF in turbulent flow regime for using in a double pipe heat exchanger. They studied the effect of Reynolds number, temperature, volume fraction, and nanoparticle source on the overall heat transfer coefficient. Their results revealed that increasing the Reynolds number and particle concentration would lead to an increase in heat transfer coefficient.
Comparing to the base fluid, aluminium oxide NF at the concentration of 0.2 and 0.3 showed higher thermal efficiency. For instance, the thermal efficiency for water at temperature of 50oC and constant mass flow rate equals to
1450000 while it is 1565000 and 1580000 at NF 0.2 and 0.3 of concentration, respectively. As for NF at the concentration of 0.1, the heat transfer efficiency was approximately 1.71% higher than the thermal efficiency in the base fluid, with the amounts of 1123123 comparing to 1103842. This increase can be due to several reasons including particle
*CONTACT: Chemical.eng8112@gmail.com
immigration, non-uniformity in thermal conductivity distribution, and fluid viscosity that reduces the thickness of boundary layer and results in a delay in the boundary layer development.
Probably, Duangthongsuk and Wongwises [3] were the first who suggested the addition of solid particles in nanometric size into a base fluid and reported enhancement of thermal conductivity compared to base fluid. Many studies have been done in order to evaluate the heat transfer performance and flow characteristics of various nanofluids in both the laminar and the turbulent flow regimes [4–14]. These studies have proven that introducing nanoparticles into the base fluid would increase its thermal conductivity. This increase has a direct relationship with the nanoparticle concentration.
Jamshidi et al. [20] studied the effect of SiO2 nanoparticles on the viscosity of base fluid experimentally. They used base fluids among common heat transfer fluids such as ethylene glycol, transformer oil and water. Furthermore, different volume percentages of ethylene glycol in water were used as ethylene glycol-water solution. Different volume fractions of SiO2 nanoparticles were added to the base fluid. It was shown that the viscosity of solution increases by adding nanoparticles. The effect of cooling and heating processes on the viscosity of nanofluid was also investigated. Based on the obtained results, as the temperature increases the viscosity of base fluid and nanofluid decrease. It was also revealed that there are very little differences between the viscosity of nanofluid in a specific temperature at cooling and heating cycles. According to the experimental results, new correlations for predicting the viscosity of nanofluids was presented. These correlations related the viscosity of nanofluid to the particle volume fraction and temperature.
Alias et al. [21] studied the properties of TiO2-Ethylene glycol nanofluids. The nanofluids was prepared using two-step method with the aid of Polyvinylpyrrolidone (PVP) as stabilizing agent. The effect of temperature and concentration on viscosity and thermal conductivity were studied. Nanofluids at different concentrations were evaluated over a temperature range between 30 and 60 ℃ and the change in thermal conductivity was being recorded via a thermal analyzer device. It was observed that introducing nanoparticles into the base fluid would enhance its thermal conductivity. In addition, it was discovered that surface chemistry i.e. pH value, has an impact on the rheological behavior and the characteristics of the nanofluid. Moreover, in order to measure the dynamic viscosity of the nanofluid, a calibrated viscometer on cylindrical measurement chamber was used. The results showed that viscosity increases with increasing nanoparticles concentration. Based on their results, as temperature increases, the kinetic energy of nanoparticles will also increase and thus cause each nanoparticle to collide with higher frequency. This, in turn, reduces the attraction force among the nanoparticles and prevents the agglomerations.
Hemmat Esfe et al. [22] have designed an artificial neural network (ANN) to predict thermal conductivity and the dynamic viscosity of ferromagnetic nanofluids using experimental data. These input data include temperature, particles diameter, and solid volume fraction. The have used experimental as learning dataset in order to train the neural network. The authors have used an iteration method to find the right architecture. Their results have shown that there was no over-fitting in the designed neural network, hence it was able to track the data. The output from their ANN have indicated that the maximum errors in the prediction of thermal conductivity and dynamic viscosity were 2 percent and 2.5 percent, respectively. They also presented two sets of correlations for predicting the thermal conductivity and dynamic viscosity according to the ANN outputs. Their correlations were in an excellent agreement with the experimental data.
2- Preparation and Characterization of Hybrid Nanofluid
The nanofluid used in the experiment was 99.0+% hybrid nanofluids pre-dispersed in water, with an average particle size of 20 nm. The nanofluid was mixed with deionized water. To prepare experimental concentrations, nanofluids with the nanoparticles concentration lower than 3% (w/w) were able to remain stable over a week, so intermediate mixing was not necessary.
The concentration of Al2O3-CuO nano-particles in nanofluid samples varied 1%(w/w). NF samples were then mixed by ultra-sonic method for 3 to 4 hours.
3- Experimental Setup
Figure 1. Experimental setup.
4- Data Reduction
In the present study, the nanoparticles dispersed in water with concentrations were use. During the test, cold water absorbed heat from hot nanofluid. The heat transfer rate from the heating fluid was calculated from the following equation:
ρnanofluid= (1 − 𝜑)ρ𝑏+ 𝜑ρ𝑛𝑝 (1)
Cnanofluid = (1 − 𝜑)Cb+ 𝜑C𝑛𝑝 (2)
Timofeeva et al. [15] suggested the effective medium theory to calculate thermal conductivity:
knanofluid = (1 + 3φ)kb (3)
The Wasp model [16] predicts results similar to those of Hamilton– Crosser under spherical particles.
knanofluid = [
k𝑛𝑝+ 2kb−2φ(kb− k𝑛𝑝)
k𝑛𝑝+ 2kb+φ(kb− k𝑛𝑝)
] kb (4)
Knanofluid= Kwater
[
1 + 2φ (1 −
Kb
K𝑛𝑝
2 Kb
K𝑛𝑝+ 1
)
1 − φ (
1 − Kb
K𝑛𝑝
Kb
K𝑛𝑝+ 1
) ]
(5)
Brinkman [17] suggested an equation for calculating the viscosity of the suspension, which is defined as follows:
μnanofluid =
1
(1 − φ)2.5μb (6)
μnanofluid = (1 + 2.5φ)μb (7)
μnf= (1 + 2.5φ + 6.2φ2)μw (8)
Qnf= ṁnfCpnf(Tout− Tin)nf (9)
Where 𝑄𝑛𝑓is the heat transfer rate of the nanofluid and 𝑚̇𝑛𝑓 is the mass flow rate of the nanofluid. The heat transfer rate
into the cooling water was calculated from the following equation:
𝑄𝑤= 𝑚̇𝑤𝐶𝑝𝑤(𝑇𝑜𝑢𝑡− 𝑇𝑖𝑛)𝑤 (10)
In this study, the supplied heat by the hot nanofluid was found to be 3% higher than the received heat. This deviation can be interpreted by convection and radiation heat loss along the test section. The average heat transfer rate is:
𝑄𝑎𝑣𝑒 =
𝑄𝑤+ 𝑄𝑛𝑓
2 (11)
The average value of experimental heat transfer coefficient and mean Nusselt number of the nanofluid are calculated as the following:
ℎ𝑛𝑓=
qave
T
̅wall− Tb,nf (12)
𝑁𝑢𝑛𝑓=
ℎ𝑛𝑓𝐷
𝐾𝑛𝑓 (13)
Where 𝑇̅𝑤𝑎𝑙𝑙 is the mean wall surface temperatures measured by 4 stations lined between the inlet and outlet of the test
tube.
T
̅wall= ∑Twall
8 (14)
Where 𝑇𝑤𝑎𝑙𝑙 is the local wall temperature.
Tb,nf is mean bulk nanofluid temperature:
Tb,nf=
Tin+ Tout
2 (15)
The flow regime can be defined from Reynolds number based on the flow rate at the inlet of the test tube. For purely viscous non-Newtonian fluid, the Reynolds number is defined as follows:
𝑅𝑒 =𝜌𝑛𝑓𝑣𝑛𝑓2−𝑛𝑑𝑖
𝑛
𝑚𝛾𝑛−1 (16)
Where 𝑣𝑛𝑓is the mean velocity of the nanofluid and 𝑑𝑖 is the diameter of the tube. Friction factor can be calculated from
the following equation:
fnf=
∆Pnf
(L d⁄ )ρi nf(vnf2/2) (17)
Where 𝑓𝑛𝑓 is the friction factor of the nanofluid, ∆𝑃𝑛𝑓 is the measured pressure drop of the nanofluid and L is the length
of the tube.
The Prandtl number and Peclet number of the nanofluid can be calculated from the following equations:
𝑃rnf =
mγn−1Cp
nf
Knf
(18)
Penf =
vnfdp
αnf
Where dp is the diameter of the nanoparticles and αnf is the thermal diffusivity of the nanofluid.
The performance evaluation analysis (η) is defined as the enhanced convective heat transfer coefficient (hE) to the
non-enhanced one (hNE) at the same pumping power.
𝜂 = ℎ𝐸
ℎ𝑁𝐸 (20)
This parameter is relevant to the operational cost and energy saving.
Xuan and Li correlation is used to predict the heat transfer performance of nanofluids flowing in the turbulent flow regime:
𝑁𝑢𝑛𝑓= 0.0059(1 + 7.628 𝜑0.688𝑃𝑒𝑑0.001)𝑅𝑒𝑛𝑓0.923𝑃𝑟𝑛𝑓0.4 (21)
To compare friction factor Blasius correlation [19] for water and Duangthongsuk and Wongwises correlation [9] for nanofluid were employed:
Blasius correlation:
𝑓 = 0.316𝑅𝑒−0.25 (22)
Duangthongsuk and Wongwises correlation:
𝑓𝑛𝑓 = 0.961𝜑0.052𝑅𝑒𝑛𝑓−0.375 (21)
5- Artificial Neural Network
Artificial neural networks (ANNs) are a set of models in machine learning and cognitive science which are inspired form the biological networks and they are employed to estimate an unknown function with large number of inputs. The key component of this method is creating new structure for processing the data in the system. The system basically consists of very large number of neurons which are elements that operate coordinately to solve a problem and transfer the information through a network of electromagnetic communications. When one cell is damaged in such a network, the rest of them compensate the lack of its operation and at the same time, contribute to reconstruct it. Additionally, are capable of learning. For instance, the system learns no to touch a hot area by burning the touch nerve cells, thus the system find its way to modify its mistakes and errors suing the algorithm. These systems are based on adoptive learning. On other words, employment of examples, weight of synapses is changed so that the system creates appropriate and relatively precise answer in case of new input data. Neural network consisted of a network of simple processing elements (neurons) which can declare a predetermined overall complex behavior of the relationships between processing elements and element parameters. The main and the most inspiring source for this technique derived from the conducted experiment on central nervous system and neurons (axons, dendrite and synapse) which is one of the most significant components of Neural Information Processing Systems (NIPS). Training data are given to the network in training algorithms and the network repeatedly updates the weights and orientations in order to conform the predicted values to the desired values. Back Propagation-Levenberg-Marquardt learning algorithm (BP-LM) in addition to tansig transfer function are employed in the present study. In the present study, data related to Reynolds number and concentration were considered as input and overall heat transfer was approved as target for the neural network.
6- Discussion and Results
40 ℃, was 2030, while this value was equal to 2233 for nanofluid with the concentration of 1% (v/v) at the same conditions. Overall, the experimental data showed that the overall heat transfer efficiency was higher in the case of nanofluid comparing to the base fluids, i.e. water. In the higher mass flow rates, the increase in the temperature had a strong effect on overall heat transfer coefficient. Thus, the nanofluid operation time had also an effect on the heat transfer coefficient on nanofluid. This is also worth mentioning that surface properties of the particles and the heat exchanger design are important parameters and should also be considered as well.
Figure 2. Variation of mean heat flow rate with Reynolds number.
Figure 3. Variation of overall heat transfer coefficient with Reynolds number.
0 200 400 600 800 1000 1200 1400 1600 1800 2000
0 5000 10000 15000 20000 25000
Q
av
e
(W)
Re number Water + plain tube
Nanofluid 1%(w/w) + plain tube
Nanofluid 1%(w/w) + twisted tape(y/w=5) Nanofluid 1%(w/w) + twisted tape(y/w=3)
0 500 1000 1500 2000 2500 3000 3500 4000 4500 5000
0 5000 10000 15000 20000 25000
U
(
w
/m
2.C
)
Re number Water + plain tube
Nanofluid 1%(w/w) + plain tube
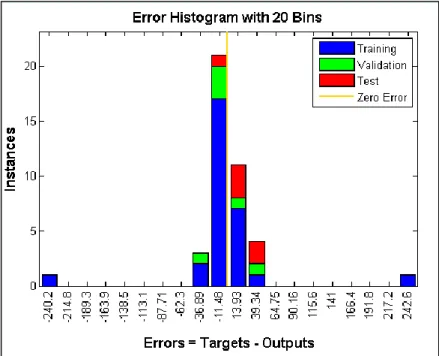
Figure 4. The regression graph for experimental results and prediction data for nanofluid hybrid.
According to Figure 4, the predicted values (ANN) for overall heat transfer are shown versus the values obtained by the experimental tests (Exp.). As it is obvious, the graph's data follow the line X=Y, which this indicates that the network is able to predict the viscosity with high accuracy. On other words, since the predicted values are identical with the corresponding experimental values, there should be a 45-degree line function. Whatever the values are less scattered around the line X=Y, the system has a better performance. In the science of statistics, dispersion is typically represented by correlation coefficient. If correlation coefficient is close to one, then this indicates that the predicted values for the model and what measured in the laboratory are the same. One of the problems occurs for neural networks with low number of data in training is "overfitting" phenomenon in which the model cannot be generalized. Evaluation of error for testing and accuracy data is one of the ways to recognize the overfitting. Proximity of the correlation coefficient for this type of data shows that overfitting did not occur. Accordingly, the correlation coefficient for the data is equal to 0.98 which indicates that this phenomenon did not happen in our model. According to Figure 5, the difference between the predicted values and experimental data are scattered around zero-axis. This means that the mean deviation is close to zero. This results from the summation of positive and negative deviations. On other words, negative and positive deviations would neutralize each other. Figure 5 indicates the extent of error between the experimental results and what predicted by the neural network. This could be used to study the neural network performance index and dispersion. The more the curve is sharp and focused, the better the neural network is in prediction.
7- Conclusion
Increasing the heat transfer and thermal efficiency depends on the increase in the fluid thermal conductivity and the decrease in the boundary layer thickness.
Nanofluid heat transfer and overall heat transfer increases with the concentration 1% (w/w). The decrease in the boundary layer thickness can be attributed to the mobility of the particles near the wall, migration of the particles towards the tube center, and decrease of the viscosity.
The system was used for modeling neural networks .As well as data Reynolds number and concentration as input nanoparticles overall heat transfer coefficient was chosen as a target. The correlation coefficient for all data 0.98 is the successful prediction is shown.
8- References
[1] S. U. S. Choi, “Enhancing thermal conductivity of fluids with nanoparticles,” in Developments and Applications of Non- Newtonian Flows, D. A. Siginer and H. P. Wang, Eds., vol. 66, FED 452, pp. 99–105, ASME, New York, NY, USA, 1995. [2] Aghayari, Reza, Heydar Maddah, Fatemeh Ashori, Afshin Hakiminejad, and Mehdi Aghili. “Effect of Nanoparticles on Heat
Transfer in Mini Double-Pipe Heat Exchangers in Turbulent Flow.” Heat and Mass Transfer 51, no. 3 (July 25, 2014): 301–306. doi:10.1007/s00231-014-1415-0.
[3] Duangthongsuk, Weerapun, and Somchai Wongwises. “Heat Transfer Enhancement and Pressure Drop Characteristics of TiO2– water Nanofluid in a Double-Tube Counter Flow Heat Exchanger.” International Journal of Heat and Mass Transfer 52, no. 7–8 (March 2009): 2059–2067. doi:10.1016/j.ijheatmasstransfer.2008.10.023.
[4] Chun, Byung-Hee, Hyun Uk Kang, and Sung Hyun Kim. “Effect of Alumina Nanoparticles in the Fluid on Heat Transfer in Double-Pipe Heat Exchanger System.” Korean Journal of Chemical Engineering 25, no. 5 (September 2008): 966–971. doi:10.1007/s11814-008-0156-5.
[5] Duangthongsuk, Weerapun, and Somchai Wongwises. “Effect of Thermophysical Properties Models on the Predicting of the Convective Heat Transfer Coefficient for Low Concentration Nanofluid.” International Communications in Heat and Mass Transfer 35, no. 10 (December 2008): 1320–1326. doi:10.1016/j.icheatmasstransfer.2008.07.015.
[6] Santra, Apurba Kumar, Swarnendu Sen, and Niladri Chakraborty. “Study of Heat Transfer Due to Laminar Flow of Copper–water Nanofluid through Two Isothermally Heated Parallel Plates.” International Journal of Thermal Sciences 48, no. 2 (February 2009): 391–400. doi:10.1016/j.ijthermalsci.2008.10.004.
[7] Namburu, Praveen K., Debendra K. Das, Krishna M. Tanguturi, and Ravikanth S. Vajjha. “Numerical Study of Turbulent Flow and Heat Transfer Characteristics of Nanofluids Considering Variable Properties.” International Journal of Thermal Sciences 48, no. 2 (February 2009): 290–302. doi:10.1016/j.ijthermalsci.2008.01.001.
[8] Gherasim, Iulian, Gilles Roy, Cong Tam Nguyen, and Dinh Vo-Ngoc. “Experimental Investigation of Nanofluids in Confined Laminar Radial Flows.” International Journal of Thermal Sciences 48, no. 8 (August 2009): 1486–1493. doi:10.1016/j.ijthermalsci.2009.01.008.
[9] Duangthongsuk, Weerapun, and Somchai Wongwises. “An Experimental Study on the Heat Transfer Performance and Pressure Drop of TiO2-Water Nanofluids Flowing Under a Turbulent Flow Regime.” International Journal of Heat and Mass Transfer 53, no. 1–3 (January 2010): 334–344. doi:10.1016/j.ijheatmasstransfer.2009.09.024.
[10] Hojjat, M., S. Gh. Etemad, R. Bagheri, and J. Thibault. “Convective Heat Transfer of Non-Newtonian Nanofluids through a Uniformly Heated Circular Tube.” International Journal of Thermal Sciences 50, no. 4 (April 2011): 525–531. doi:10.1016/j.ijthermalsci.2010.11.006.
[11] Hojjat, M., S.Gh. Etemad, R. Bagheri, and J. Thibault. “Rheological Characteristics of Non-Newtonian Nanofluids: Experimental Investigation.” International Communications in Heat and Mass Transfer 38, no. 2 (February 2011): 144–148. doi:10.1016/j.icheatmasstransfer.2010.11.019.
[12] Heidary, H., and M.J. Kermani. “Heat Transfer Enhancement in a Channel with Block(s) Effect and Utilizing Nano-Fluid.” International Journal of Thermal Sciences 57 (July 2012): 163–171. doi:10.1016/j.ijthermalsci.2012.02.001.
[13] Pelević, N., and Th.H. van der Meer. “Numerical Investigation of the Effective Thermal Conductivity of Nano-Fluids Using the Lattice Boltzmann Model.” International Journal of Thermal Sciences 62 (December 2012): 154–159. doi:10.1016/j.ijthermalsci.2011.09.022.
Jonathan V. Selinger. “Thermal Conductivity and Particle Agglomeration in Alumina Nanofluids: Experiment and Theory.” Physical Review E 76, no. 6 (December 28, 2007). doi:10.1103/physreve.76.061203.
[16] F.J. Wasp, Solid–Liquid Slurry Pipeline Transportation, Trans Tech, Berlin, 1977.
[17] Brinkman, H. C. “The Viscosity of Concentrated Suspensions and Solutions.” The Journal of Chemical Physics 20, no. 4 (April 1952): 571–571. doi:10.1063/1.1700493.
[18] Batchelor, G. K. “The Effect of Brownian Motion on the Bulk Stress in a Suspension of Spherical Particles.” Journal of Fluid Mechanics 83, no. 01 (November 1977): 97. doi:10.1017/s0022112077001062.
[19] R.B. Bird, W.E.Stewai, E.N. Lightfoot, Transport Phenomena, Second ed., John Wiley & Sons,2002.
[20] Jamshidi, N., Farhadi, M., Ganji, D.D., Sedighi, K., Experimental Investigation on the Viscosity of Nanofluids, IJE TRANSACTIONS B: Applications Vol. 25, No. 3, 2012 201-209
[21] Alias, H., Johari, A., Ngadi ,N., Zakwan Zaine, M., Thermal and Flow Behaviour of Titania-Deionized Water Nanofluids, Advances in Environmental Biology, 2015, 9(21) , Pages: 43-47.