Emerging Science Journal
Vol. 4, No. 4, August, 2020
Analyzing Navigational Data and Predicting Student Grades
Using Support Vector Machine
SriUdaya Damuluri
a, Khondkar Islam
b, Pouyan Ahmadi
a*, Namra Qureshi
a a Department of Information Sciences and Technology, George Mason University, 4400 University Dr, Fairfax, VA, 22030, United StatesAbstract
The advent of Learning Management System (LMS) has unfolded a unique opportunity to predict student grades well in advance which benefits both students and educational institutions. The objective of this study is to investigate student access patterns and navigational data of Blackboard (Bb), a form of LMS, to forecast final grades. This research study consists of students who are pursuing a Networking course in Information Science and Technology Department (IST) at George Mason University (GMU). The gathered data consists of a wide variety of attributes, such as the amount of time spent on lecture slides and other learning materials, number of times course contents are accessed, time and days of the week study material is reviewed, and student grades in various assessments. By analyzing these predictors using Support Vector Machine, one of the most efficient classification algorithms available, we are able to project final grades of students and identify those individuals who are at risk for failing the course so that they can receive proper guidance from instructors. After comparing actual grades with predicted grades, it is concluded that our developed model is able to accurately predict grades of 70% of the students. This study stands unique as it is the first to employ solely online LMS data to successfully deduce academic outcomes of students.
Keywords:
Educational Data Mining; Machine Learning;
Learning Management System; Support Vector Machine; Classification Algorithms; Grades Prediction.
Article History:
Received: 09 May 2020
Accepted: 13 July 2020
Published: 01 August 2020
1- Introduction
Educational Data Mining (EDM) is a newly emerging field in which educational data is investigated to better understand the students and their environment. It makes use of data mining techniques and machine learning algorithms to gain insights about students’ learning process. This can assist educational institutions to fully understand students’ behavior and needs and accordingly refine teaching methods. EDM can help students realize their deficiencies and work on their weak areas which would help them save both time and money that is needed to repeat a course or class.
In order to investigate the effect of learning patterns on academic performance, we collected educational data from Blackboard Learn, the learning management system (LMS) used in George Mason University. Blackboard is utilized by instructors and students to deliver and access the course content which includes course materials, lecture notes, discussion boards, homework, and lab assignments. The course report generated for analysis from Blackboard consists of information about every student’s navigational behavior. For instance, the number of times each student accessed a particular course item and the total time they spent on it is reported.
We analyze these learning behaviors highlighted in the data from previous semesters to develop a model that can make predictions about current students early on, so that we can prevent them from failing a class or help them improve their grades. For example, based on the predictive model, we can identify students who are lagging behind and would need to prepare more vigorously for the upcoming midterm exam and devote more time studying for the course. By doing so, they can perform well in mid-semester’s heavily weighted assessments and make-up for their
*CONTACT: [email protected]
DOI:http://dx.doi.org/10.28991/esj-2020-01227
grades. The generalized predictions made by the classification algorithm are applicable to comprehensive written exams and hands-on skills assessments because the navigational behavior data is based on access to lecture slides, recordings, labs, and homework assignments, which consist of information covered in the exams. Similarly, the training model would be useful to determine the students at risk of failure prior to the final exam and lab skills exam and forewarn those students to avoid ending up with a poor grade in the course. For developing our predictive classification model, we use Support Vector Machine which is a supervised machine learning algorithm, as described by Kuhn and Johnson [1]. After building the model, we compare the observed grade (actual grade that we have access to) and the predicted grade (analytical result) to determine model’s predictive power and understand its implications.
We aim to address the following questions through this research study:
What correlation exists between student access patterns for course materials and their final grade?
Can LMS data be used to build a predictive model for academic outcomes?
What are the most important variables among navigational data that significantly contribute to grade prediction?
Can we successfully identify students who are at risk for failing a course using a machine learning algorithm?
The research paper consists of five main sections, including the introduction above. The following section, literature review, presents the findings of previous studies performed on academic performance predictions. The next section will talk about the research methodology and step-by-step process pursued to obtain results. The fourth section will demonstrate analysis results and observations. The final section will contain the discussion and conclusion based on interpretation of the results as well as the future steps to carry on this research study.
2- Literature Review
The literature review concentrates on previous research and studies performed on predicting student performance and identifying the factors that contribute to student success. A qualitative research study by Rastrollo-Guerrero et al. asserts that predicting student performance can help improve academic results enhancing institution’s reputation and help reduce dropout rates. Since new mechanisms have made automated data collection possible, analysing such data can provide important insights regarding the relationship between the students and academic tasks. After studying 70 papers, it is concluded that Machine Learning, Artificial Neural Networks, Recommender Systems, and Collaborative Filtering are the best Artificial Intelligence tools to predict student performance [2].
Although many machine learning platforms have been developed and even show success at predicting student performance, most of these measures have only been available to educators in the technological fields. Alyahyan and Düştegör created a step-by-step instruction manual for educators who can use it to employ data mining techniques for predicting student outcomes. This would provide easier and extensive access to data mining technology for a wide variety of users in the education field [3]. A South African study led by Burger and Naudé investigated high school students to determine predictors of academic success and concluded that students’ grade 12 performance, academic self-concepts, and the type of high school students attended contribute most significantly to success in higher education and career [4].
Degree completion rates and student retention are a strong indicator of universities and colleges’ success at making important contributions to society’s well-being. Cardona and Cudney collected and analysed data on students’ age, gender, GPA, degree type, and other variables using SVM to predict completion of STEM degree within three years at a community college. The results of this study can help create a strong and responsive support system for college students [5].
study effort was done to predict the students’ final grades based on the features extracted from their homework data [9]. To find ways to enhance learning outcomes, Burman and Som utilized Support Vector Machine to predict student performance based on students’ psychological features. Using linear kernel and radial basis kernel, students are categorized as high, low, or average relative to their academic scores [10].
Naïve Bayes was found to be the most appropriate classification algorithm in Kotsiantis et al. according to the accuracy and sensitivity of the model. Six Machine Learning algorithms were used to identify poorly performing students in a distance learning environment of Hellenic Open University. The attributes used for their study included sex, age, occupation, marital status, computer literacy, written assignments, etc [11]. Kabra and Bichkar used Decision Tree classifier as an application of educational data mining to generate a model which is used to predict students’ performance in the first year of their engineering exam. This is done to identify students who are likely to fail. Factors like gender, math or science score, location, parent occupation, etc. were also considered as input variables [12]. Devasia et al. made use of Naïve Bayes algorithm to predict the performance of students at the end of the semester. They used the same factors as gender, location, annual income, parental occupation, parent qualifications, reading habits, number of hours spent on studies, student grades in previous schools, social network usage, etc. as predictor variables. They also made use of class test, seminar, and assignment scores for predicting the output variable, which is classified as poor, average, good, or excellent [13]. One study by Sorour et al. analysed the student comments data after each lesson to predict student grades [14].
Another study by Ashenafi et al. uses peer assessment system where students are required to participate in peer-based online homework activities throughout the course. Several factors were considered including tasks completed, voting, and ratings of questions and answers discussed during the course, etc. [15]. Support Vector Machine was deemed the most appropriate classifier in the study by Brodic et al. where first test grade, second test grade, attendance, seminar grade and final exam were used as the important input features for the model. This study highlights the different classification techniques which can be used as a prediction tool in educational context [16]. Another research effort by Kadambande et al. utilizes Semantic rules and Support Vector Machine to predict educational success. Based on the results of the study, students are offered advice and recommendations regarding their educational career and improving scores in future examinations [17].
Our previous research study attempted to determine the most appropriate algorithm that can yield a successful model to predict the students’ final grades. It was found that SVM has the highest prediction accuracy when compared to other algorithms including Naïve Bayes, K-Nearest Neighbors, and Linear Discriminant Analysis [18].
This study focuses on the navigational behavior of students on an e-learning platform. The model is trained on the students’ data about accessing the course content which can be utilized to identify the students who need help achieving academic success. The institutions, educators, and instructors can make use of these results to efficiently manage the study content and better design their courses to ensure student success. We consider factors like number of hours each student spent on the course on specific days of the week, total number of hours spent on the course, total logins, and number of times and number of hours spent on each course item. The predictive model is built without the use of any previous academic performance record.
3- Research Methodology
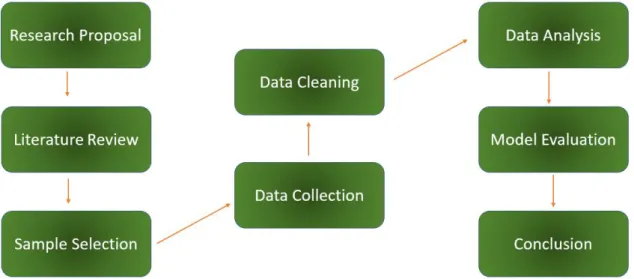
Figure 1. Flow chart of research methodology.
3-1- Sample Selection and Data Collection
The participants of this study are undergraduate students enrolled in a networking course in Volgenau School of Engineering at George Mason University. The dataset contains records of 300 students from 11 sections of in-class or online classes of two identical courses: IT 341 (Data Communications and Networking Principles) or CYSE 230 (Computer Networking Principles). Since the data is accrued directly from Blackboard, students do not need to actively participate in this study and the data is anonymized to protect student privacy.
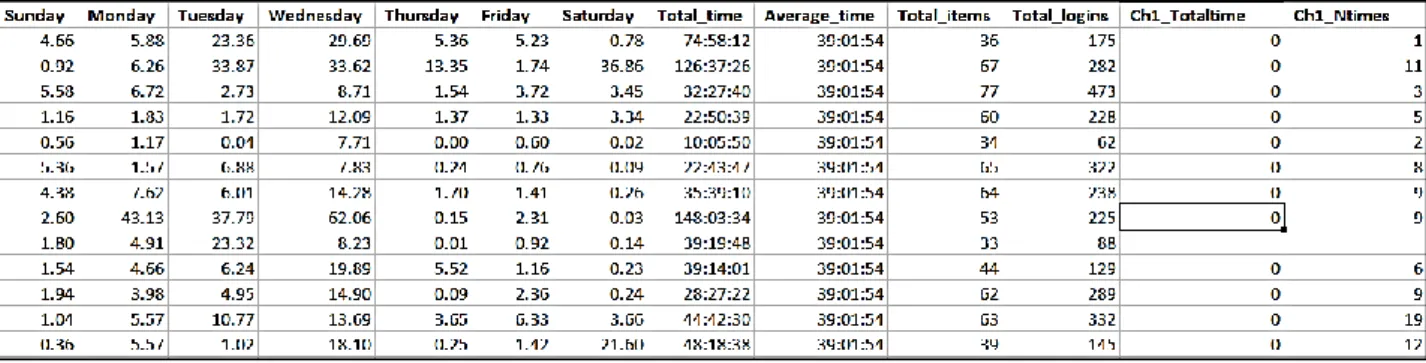
Figure 3. Aggregated students’ data to a single file.
The relevant information from individual student reports is aggregated into a single Microsoft Excel file which contains all students’ data, as visible in Figure 3 above. Aggregated dataset makes it easy to analyze and visualize patterns hidden in the data. Table 1 lists the variables that are used to predict academic performance of students. These variables are considered because they represent the course materials students spend time on to prepare for mid-term and final examinations.
Table 1. Variables evaluated for the analysis.
Attribute Name Description
Sunday-Saturday
Total time
Total logins
Total items
Ch1-Ch11 (Duration)
Ch1-Ch11 (Clicks)
RS1-RS8 (Duration)
RS1-RS8 (Clicks)
HA1 & HA2 (Duration)
HA1 & HA2 (Clicks)
LS1-LS12 (Duration)
LS1-LS12 (Clicks)
Grade
Time spent on a particular day
Time spent on the course
Total number of logins
Items accessed
Time spent on each chapter
No. of times each chapter is accessed
Time spent on Routing and Switching chapters
No. of times Routing and Switching chapters are accessed
Time spent on Homework Assignments
No. of times Homework Assignments are accessed
Time spent on each lab session
No. of times each lab session is accessed
Student course grade
3-2- Data Cleaning
After data collection, the first step was data pre-processing. Initially, the dataset had some missing values, irrelevant attributes, and improper datatypes, making it necessary to prepare the data to make it consistent for the analysis phase and ensure higher accuracy of the training model. First, irrelevant attributes i.e. course ID, student ID, and date range, were eliminated. Table 1 above only contains the final attributes chosen for this study. Next, students with incomplete records and little or no information about their course activities on Blackboard (perhaps because they dropped out of the course early on in the semester) were removed from the dataset. This left us with 300 study participants, as noted above. Lastly, Mean Imputation Method, as described by Buuren, was utilized to compute values for students who were only missing partial information for certain variables in their course report [19]. By employing this method, missing values for each variable are replaced with the mean of the corresponding variable. The data cleaning was carried out using a combination of Microsoft Excel and RStudio.
3-3- Data Analysis
effectively on Blackboard. First, the datatype for all attributes is transformed into numeric as Support Vector Machine (SVM), which is the algorithm used to build the performance model, works most efficiently with numeric attributes. Next, we carried out clustering analysis to find how various variables in the dataset are related to each other and with the final grade. Variables that depict a negative relationship with the final grade are not incorporated into the final predictive model. The final grades of students, which can be A, B, C, D, or F, are converted to a numerical scale as well.
To classify each student based on their final grade, Support Vector Machine is employed. We chose SVM because our previous research study, which was done to evaluate predictive power of various machine learning algorithms including Naïve Bayes, K-Nearest Neighbors, Linear Discriminant Analysis, and Support Vector Machine, concluded that SVM has the highest accuracy rate in predicting final grades of students [18]. SVM classifies the data points even in extreme conditions. Additionally, this algorithm works well with even small datasets and results in high accuracy rate, which is the case for our research study.
The dataset is divided into a training set and a test set for machine learning analysis. The training set is used to build the model whereas the test set is used to evaluate and validate the model. The evaluation metric for our analysis is the grade of the student which can be classified as A, B, C, D and F.
3-4- Model Evaluation
To evaluate the classification model we built to predict final grades of students in a networking courses based on their navigational activities on Blackboard, test data is fed into the model and the output consists of predicted final grades. Predicted final grades are compared with actual grades earned by students to evaluate model accuracy and meet the goals of this study.
4- Results
4-1- Exploratory Data Analysis and Feature Engineering
Figure 5. Correlation plot for study chapters and final grade.
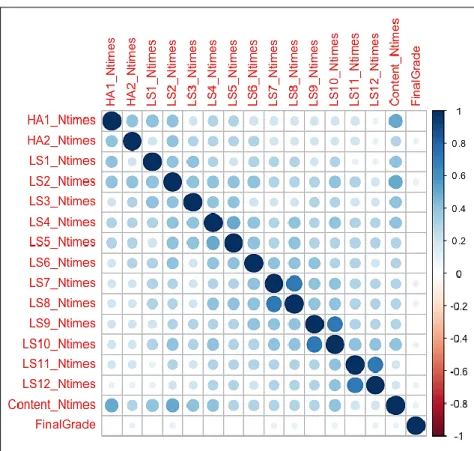
Figure 6. Correlation plot for homework & lab assignments and final grade.
the assignments. However, for other subjects and classes, if due date differs, then final grade would tend to have the strongest relationship with the day of the week most significant for assignments and exams accordingly. It can be observed that grade is negatively correlated with Wednesdays and has a neutral relationship with Tuesdays and Thursdays. These days fall in the middle of week and most sections of the courses analysed for this study are not taught on these days, so they prove to be insignificant. To make our model perform better, we eliminate Wednesday, the negatively correlated variable, for classification analysis.
From Figure 5 above, we can discern that grade has a positive relationship with most chapters of the course curriculum except for Chapter 10, which is also eliminated from classification analysis. This finding indicates that students should concentrate on all their coursework to obtain a good grade. Focusing on a selection of few chapters that seem to be most important would not result in successful completion of the course or desired grade outcome. These results also suggest that these networking courses are well organized and final grade is a very accurate representation of the cumulative material taught in the course, motivating students to focus on all aspects of the course, learn efficiently, and get the best out of it.
Figure 6 portrays the relationship between lab or homework assignments and the final grade. None of these variables illustrate a negative correlation with final grade, deeming class assignments essential to success in the course. However, since exams make up a larger portion of the final grade than assignments, study chapters are more strongly related to final grade than homework and labs.
The correlation plots help in identifying the variables that contribute most to the final grade. Moreover, they guide us about which variables should be eliminated from the machine learning analysis. Correlation plots also give an overall picture of how the final grade is related to various course activities and how well the course is organized to reflect what is covered in the exams or assessments.
4-2- Modeling
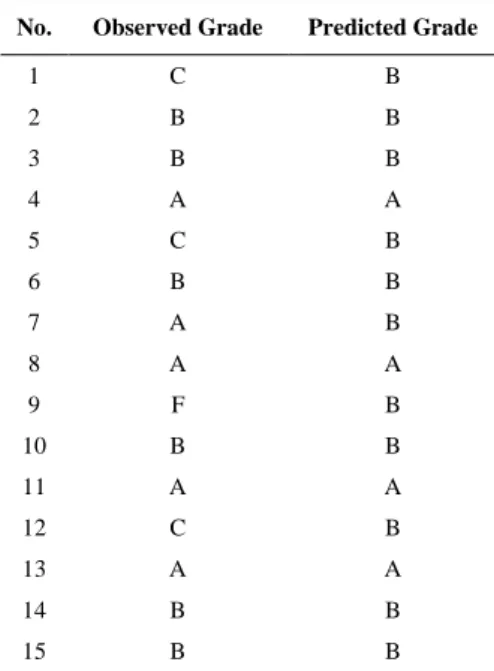
After performing preliminary analysis, we built a training model that can predict the outcome, final grade, using the variables mentioned in Table 1 above. Support Vector Machine (SVM) is the machine learning algorithm used to classify the dataset. It is necessary to split the dataset into training and testing data to avoid overfitting, so 90% of the data is used to train the model whereas 10% of the data is reserved for testing the predictive model. The target attribute, or the output of our model, is the student grade which can be A, B, C, D, or F. Table 2 below depicts the results of our analysis with first column containing observed values (actual grade earned) and the second column comprising of analytical results (predicted grade).
Table 2. Observed vs. predicted grades.
No. Observed Grade Predicted Grade
1 C B
2 B B
3 B B
4 A A
5 C B
6 B B
7 A B
8 A A
9 F B
10 B B
11 A A
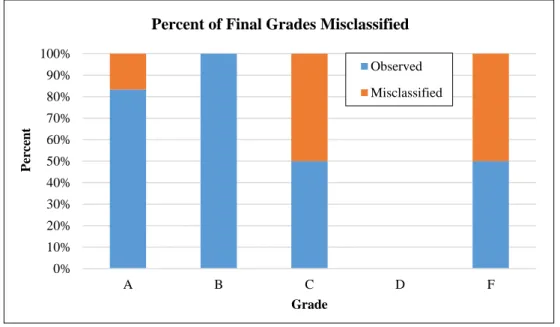
Figure 7. Percent of grades misclassified by SVM model.
From Figure 7, it can be deduced that the algorithm is able to classify A’s and B’s with high accuracy rate but fails to correctly predict C’s and F’s. As seen in Table 2, B’s are the most common grade observed in the data pool, so the model misclassifies many cases as belonging to the category of grade B. The training data also has a small number of C, D and F grades, so the model is not trained properly with respect to those grades. Therefore, 50% of C’s and F’s are misclassified as B’s whereas 100% of B’s are correctly classified. The more cases there are of a particular class in the training dataset, the higher the accuracy. By having more diverse set of training data where all grades are equally represented, the model will result in higher accuracy rates and better predictive performance.
5- Conclusion
Support Vector Machine was used as the supervised machine learning algorithm which can be used to predict the students’ final grade in the course. This classification technique is able to successfully identify students who are at risk of failing the class with an accuracy rate of 70.21%. In addition to pointing out the students who are likely to fall short of passing the course, our model can also predict exact final grades of all students with a very high success rate.
The data is not normally distributed since it contains greater number of students with grades A and B and fewer students with grades C, D and F. The accuracy rate of the prediction can be improved if we have a dataset that is normally distributed i.e., same proportion of all the grades. By incorporating more students’ data into our data pool and utilizing it to predict final grades, we can significantly improve the performance of our model because it would have a more representative training sample.
Our model predicts final grades solely based on navigational behavior of students and does not require any active participation from the subjects. Moreover, the collected data does not contain any observation bias as we are only using numerical data for this study. Our findings are unique in that they do not require any background information, previous academic record, or assignment, lab, and quiz grades to predict grades. By only requiring a small subset of readily available information without burdening the students or the professors, our model is very much applicable to everyday life.
This research study is very powerful and holds great implications for both students and academic institutions. It can provide a clear picture to student for how much effort and time they should invest into a class in order to succeed. If students clearly see that their current study habits would lead them on a path of failure and they have a concrete model which demonstrates that, they would be very motivated to save their grade when it is still in their hands. Our model can confidently and accurately predict final grade even before midterm, which leaves students with plenty of time to make up for any low grades. Our performance model can also assist instructors and academic institutions to caution these students prior to the mid-semester and final exams to minimize actual failure rate. Moreover, the data would be useful for instructors to better design and organize their course content to help students focus on the most important course resources to prepare for the heavily weighted assessments such as final exams.
To improve the accuracy and performance of our predictive model, we plan to have a follow-up study as this is an on-going research project. We plan to include a larger dataset that may normalize the training sample, which would further improve the accuracy rate and predict all of the grades more precisely. Also, we would like to include several courses other than networking courses in our study to test the generalizability of our findings. Lastly, we would like to
0% 10% 20% 30% 40% 50% 60% 70% 80% 90% 100%
A B C D F
Per
ce
n
t
Grade
Percent of Final Grades Misclassified
release results of our model to the professors teaching future courses being incorporated into the data pool for grade prediction so that they can provide timely remediation to their students and prevent them from failing the class.
6- Conflict of Interest
The author declares that there is no conflict of interests regarding the publication of this manuscript. In addition, the ethical issues, including plagiarism, informed consent, misconduct, data fabrication and/or falsification, double publication and/or submission, and redundancies have been completely observed by the authors.
7- References
[1] Kuhn, Max, and Kjell Johnson. “Applied Predictive Modeling” (2013). doi:10.1007/978-1-4614-6849-3..
[2] Rastrollo-Guerrero, Juan L., Juan A. Gómez-Pulido, and Arturo Durán-Domínguez. “Analyzing and Predicting Students’ Performance by Means of Machine Learning: A Review.” Applied Sciences 10, no. 3 (February 4, 2020): 1042. doi:10.3390/app10031042.
[3] Alyahyan, Eyman, and Dilek Düştegör. “Predicting Academic Success in Higher Education: Literature Review and Best Practices.” International Journal of Educational Technology in Higher Education 17, no. 1 (February 10, 2020). doi:10.1186/s41239-020-0177-7.
[4] Burger, Andri, and Luzelle Naudé. “Predictors of Academic Success in the Entry and Integration Stages of Students’ Academic Careers.” Social Psychology of Education 22, no. 3 (May 25, 2019): 743–755. doi:10.1007/s11218-019-09497-3.
[5] Cardona, Tatiana A., and Elizabeth a. Cudney. “Predicting Student Retention Using Support Vector Machines.” Procedia Manufacturing 39 (2019): 1827–1833. doi:10.1016/j.promfg.2020.01.256.
[6] Shahiri, Amirah Mohamed, and Wahidah Husain. "A Review on Predicting Student's Performance Using Data Mining Techniques." Procedia Computer Science 72 (2015): 414-422. doi: 10.1016/j.procs.2015.12.157.
[7] Buenaño-Fernández, Diego, David Gil, and Sergio Luján-Mora. “Application of Machine Learning in Predicting Performance for Computer Engineering Students: A Case Study.” Sustainability 11, no. 10 (May 17, 2019): 2833. doi:10.3390/su11102833. [8] Oloruntoba, S. A., and J. L. Akinode. "Student academic performance prediction using support vector machine." International
Journal of Engineering Sciences and Research Technology 6, no. 12 (2017): 588-597. doi:10.5281/zenodo.1130905.
[9] Minaei-Bidgoli, B., D.A. Kashy, G. Kortemeyer, and W.F. Punch. “Predicting Student Performance: An Application of Data Mining Methods with an Educational Web-Based System.” 33rd Annual Frontiers in Education, 2003. FIE. (November 2003). doi:10.1109/fie.2003.1263284.
[10] Burman, Iti, and Subhranil Som. “Predicting Students Academic Performance Using Support Vector Machine.” 2019 Amity International Conference on Artificial Intelligence (AICAI) (February 2019). doi:10.1109/aicai.2019.8701260.
[11] Kotsiantis, Sotiris, Christos Pierrakeas, and Panagiotis Pintelas. "Predicting Students' performance in Distance Learning Using Machine Learning Techniques." Applied Artificial Intelligence 18, no. 5 (2004): 411-426. doi:10.1080/08839510490442058. [12] Kabra, R. R., and R. S. Bichkar. "Performance prediction of engineering students using decision trees." International Journal of
computer applications 36, no. 11 (2011): 8-12.
[13] Devasia, Tismy, Vinushree T P, and Vinayak Hegde. “Prediction of Students Performance Using Educational Data Mining.” 2016 International Conference on Data Mining and Advanced Computing (SAPIENCE) (March 2016): 91-95. doi:10.1109/sapience.2016.7684167.
[14] Sorour, Shaymaa E., Jingyi Luo, Kazumasa Goda, and Tsunenori Mine. “Correlation of Grade Prediction Performance with Characteristics of Lesson Subject.” 2015 IEEE 15th International Conference on Advanced Learning Technologies (July 2015): 247-249. doi:10.1109/icalt.2015.24.