PROPERTIES OF AN
V
#STATISTIC FOR FIXED EFFECTS
IN THE LINEAR MIXED MODEL FOR LONGITUDINAL
DATA
Jeanine M. Matuszewski
A dissertation submitted to the faculty of the University of North Carolina at Chapel Hill in partial fulfillment of the requirements for the degree of Doctor of Philosophy in the Department of Biostatistics, Gillings School of Global Public Health.
Chapel Hill 2011
Approved by:
Lloyd J. Edwards
Pranab K. Sen
Bahjat F. Qaqish
John Preisser
ii
ABSTRACT
JEANINE M. MATUSZEWSKI. Properties of an V# Statistic for Fixed Effects in the Linear
Mixed Model for Longitudinal Data. (Under the direction of Dr. Lloyd J. Edwards)
The V# statistic has become a widely used tool when analyzing data in the linear univariate setting. Many V# statistics for the linear mixed model exist but their properties are not well established. The purpose of this dissertation is to examine the properties and
performance of V"# for fixed effects in the linear mixed model.
Two approaches are considered in deriving approximations for the mean and variance
of V"# under the null and alternative hypotheses which include using the Beta distribution and
a Taylor series approximation Test statistics based on these two approximations of the mean.
and variance are proposed and compared to the overall test for fixed effects in the linearJ
mixed model. Using simulations, the Type I error rate of the proposed V"# test statistics derived from the Beta distribution was equivalent to the Type I error rate for the overall J
test. The Type I error rates for the test statistic based on the Taylor series approximation
moments were slightly inflated.
The impact of covariance structure misspecification, estimation technique, and
denominator degrees of freedom method on the asymptotic properties of V"# are explored. For the simulation studies examined, the estimation technique does not impact the values of
V"#. The values and asymptotic properties of V"# using Kenward-Roger, containment and
Satterthwaite methods are greatly impacted by covariance structure misspecification whereas
V"# using the residual method is not. Simulations illustrate the impact of underspecification
The asymptotic V"#'s for the underspecified models using Kenward-Roger degrees of freedom are smaller than the true asymptotic V"#'s. Conversely, the asymptotic V"#'s for the underpecified models using residual methods are larger than the true asymptotic V"#.
iv
ACKNOWLEDGEMENTS
There are many people to whom I must show my appreciation. First, to my
dissertation advisor, Lloyd Edwards. Thank you for your guidance and advice throughout
this process. It has been invaluable. I must also thank my committee members, Mike
Bowling, P.K. Sen, Bahjat Qaqish, and John Preisser for their time with regards to my
research. To my family, thank you for your constant and unwavering support and
encouragement. Your unconditional love has helped me immensely on this difficult journey.
Finally, to my husband, you have been with me through this entire adventure, the good times
and the bad. I would not have been able to complete this dissertation without your love and
TABLE OF CONTENTS
LIST OF TABLES...xii
LIST OF FIGURES... xviii
CHAPTER 1 INTRODUCTION AND LITERATURE REVIEW... 1
1.1 Introduction...1
1.2 The V# Statistic in Linear Univariate Model... 1
1.2.1 Model Notation... 1
1.2.2 Formulae and Interpretations of V# in Linear Regression... 2
1.2.3 Properties of the Univariate V# statistic... 3
1.3 The General Linear Multivariate Model... 5
1.3.1 Model Notation... 5
1.3.2 General Linear Hypothesis Tests... 6
1.4 The General Linear Mixed Model... 8
1.4.1 Model Notation... 8
1.4.2 Estimation Techniques...9
1.4.3 Inference for the Linear Mixed Model...10
1.4.4 Misspecification of the Covariance...14
1.5 V# Statistics for the Linear Mixed Model... 16
vi
Linear Mixed Model... 16
1.5.2 Evaluating the V# Statistics for the Linear Mixed Model...17
1.5.3 V"# for fixed effects in the Linear Mixed Model...19
1.6 Summary and Overview...20
2 ASYMPTOTIC PROPERTIES OF V"# AND TESTS OF HYPOTHESES...27
2.1 Introduction...27
2.2 Distributions and Their Properties... 27
2.2.1 Central distribution... 27J 2.2.2 Non-central distribution...28J 2.2.3 Central Beta distribution... 29
2.2.4 Non-central Beta distribution...29
2.3 Approximating the Mean and Variance of V"# using the Beta Distribution... 31
2.3.1 Motivation and Justification for using the Beta distribution...31
2.3.2 Under the Null Hypothesis...32
2.3.3 Under the Alternative Hypothesis...33
2.4 Mean and Variance of V"# using the Taylor Series Approximation... 34
2.4.1 Under the Null Hypothesis...36
2.4.1.1 First Order Approximations...36
2.4.1.2 Second Order Approximations... 38
2.4.2 Under the Alternative Hypothesis...38
2.4.2.2 Second Order Approximations... 40
2.5 Asymptotic Values of the Mean and
Variance of V"#... 41 2.5.1 Noncentrality Parameter...42
2.5.1.1 Case 1:\3 is the same for all 3
is the same for all
and D3 3...42 2.5.1.2 Case 2: \3 œ\35 for
groups of size
5 œ "ß ÞÞÞß O
and is the same for
8 œO O7 D3
all 3... 43 2.5.1.3 Case 3: \3 is the same for all 3
and D D3= 3k for 5 œ "ß ÞÞÞß O
groups of size nO œ 7O... 43 2.5.1.4 Case 4: \3 œ\35 and D D3= 3k
for 5 œ "ß ÞÞÞß O groups of size
nO œ 7O...44 2.5.2 Denominator Degrees of Freedom... 45
2.5.3 Asymptotic Properties of V"# using the Beta Distribution Approach Moments
under the Null Hypothesis...45
2.5.4 Asymptotic Properties of V"# using the Beta Distribution Approach Moments
under theAlternative Hypothesis...46
2.5.5 Asymptotic Properties of V"# using the Taylor Series Approximation Moments
under the Null Hypothesis...48
2.5.6 Asymptotic Properties of V"# using the Taylor Series Approximation Moments
under the Null Hypothesis...48
2.5.7 Summary of Asymptotic Results... 49
viii
2.6.1 Beta Distribution Test Statistic... 50
2.6.2 Taylor Series Approximation Test Statistic... 50
2.7 Simulation Study Results...52
2.7.1 Data Generation... 52
2.7.2 True V#... 54
2.7.3 Objectives and Methods: Large Sample Mean of V"# under L0... 55
2.7.4 Results: Large Sample Mean of V"# under L0...55
2.7.5 Objectives and Methods: Large Sample Mean of V"# under LA...55
2.7.5.1 Asymptotic Properties of V"#: Model I: Covariance 1...56
2.7.5.2 Asymptotic Properties of V"#: Model I: Covariance 2...56
2.7.5.3 Asymptotic Properties of V"#: Model II: Covariance 1... 57
2.7.5.4 Asymptotic Properties of V"#: Model II: Covariance 2... 57
2.7.5.5 Asymptotic Properties of V"#: Model III: Covariance 1... 58
2.7.5.6 Asymptotic Properties of V"#: Model III: Covariance 2... 59
2.7.6 Results: Asymptotic Mean of V"# under LA...59
2.7.7 Objectives: Hypothesis Testing... 60
2.7.8 Results: Hypothesis Testing...61
2.8 Conclusions...62
V"#...62
2.8.2 Summary of the Asymptotic Properties of the Expectation and Variance of V"#... 63
2.8.3 Conclusions...64
3 IMPACT OF COVARIANCE STRUCTURE MISSPECIFICATION, DENOMINATOR DEGREES OF FREEDOM AND ESTIMATION TECHNIQUE ON V# "...70
3.1 Introduction...70
3.1.1 Motivation...70
3.2 V# ... 71
" Notation Discussion 3.3 Denominator Degrees of Freedom Methods... 72
3.3.1 Asymptotic Properties of Denominator Degrees of Freedom Methods... 72
3.4 Covariance Structure Misspecification... 73
3.5 Simulation Study...74
3.5.1 Objectives... 74
3.5.2 Methods...74
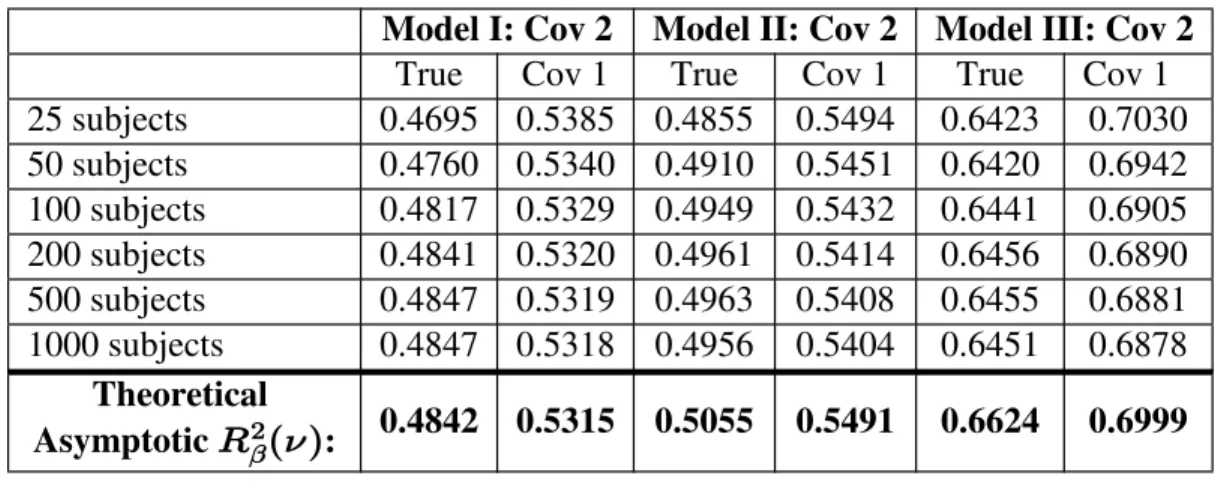
3.5.2.1 Derivation of Asymptotic V"# for Misspecified Covariance Structure...75
3.5.3 Results...76
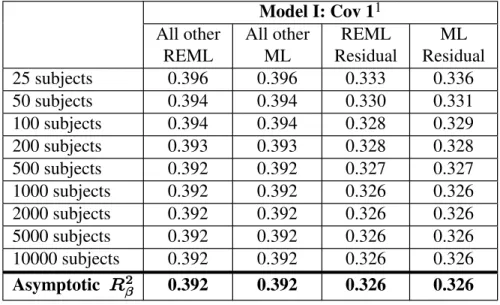
3.5.3.1 ML V Ð ß"# " D /s s| Ñ vs. REML | V Ð ß"# " D /s s Ñ... 76
3.5.3.2 Asymptotic Properties of | V Ð ß"# " D /s s Ñ... 76
3.5.3.3 Asymptotic Properties of V Ð ß"# " D /s s*| Ñ... 77
x
4 SEMI-PARTIAL V"# AND FIXED EFFECTS MODEL
SELECTION USINGV"# ...107
4.1 Introduction...108
4.2 Semi-partial V"#...108
4.2.1 Notation...108
4.3 Model Selection Methods... 109
4.3.1 Information Criteria... 109
4.4 An Adjusted V"# for fixed effects model selection...110
4.5 Real World Examples... 111
4.5.1 Data Background...112
4.5.2 Semi-partial V"#: Results... 112
4.6 Simulation Study for Semi-partial V"#... 112
4.6.1 Objectives and Methods...113
4.6.2 Results...113
4.6.3 Discussion... 114
4.7 Simulation Study for assessing V"# as a Model Selection Tool... 115
4.7.1 Objectives... 115
4.7.2 Scenario 1: Model Selection for Known Covariance Structure...115
4.7.2.1 Results...115
4.7.3 Scenario 2: Complete Model Selection...117
4.7.3.1 Covariance Structure Selection: Results...117
4.7.3.2 Mean Model Selection: Results... 118
5 SUMMARY AND DISCUSSION...143
5.1 Summary... 143
5.2 Conclusions...144
xii
LIST OF TABLES
Table 1.1 Test statistics for general linear hypothesis and the
corresponding multivariate measures of association... 21
Table 1.2 Summary of V# Statistics in the linear mixed model... 21
Table 2.1 Simulated fixed effect parameter values...66
Table 2.2 Simulated covariance parameter values... 66
Table 2.3 Number of replications where there is a positive definite hessian matrix... 66
Table 2.4 Average simulated V# values for true simulated data " from Model 0: Covariance 1 analyzed using various mean models with covariance 1... 66
Table 2.5 Average simulated V# values for true simulated data " from Model 0: Covariance 2 analyzed using various mean models with covariance 2...67
Table 2.6 Constant Kenward-Roger denominator degrees of freedom using REML estimation for simulated linear mixed models and prediction equations using subject sample size...67
Table 2.7 Average simulated V"# using Kenward-Roger denominator degrees of freedom and REML estimation and the corresponding asymptotic true V# "... 68
Table 2.8 Type I error rates for true Model 0: Covariance 1... 68
Table 2.9 Type I error rates for true Model 0: Covariance 2... 69
Table 3.1 Additional simulated covariance parameter values... 81
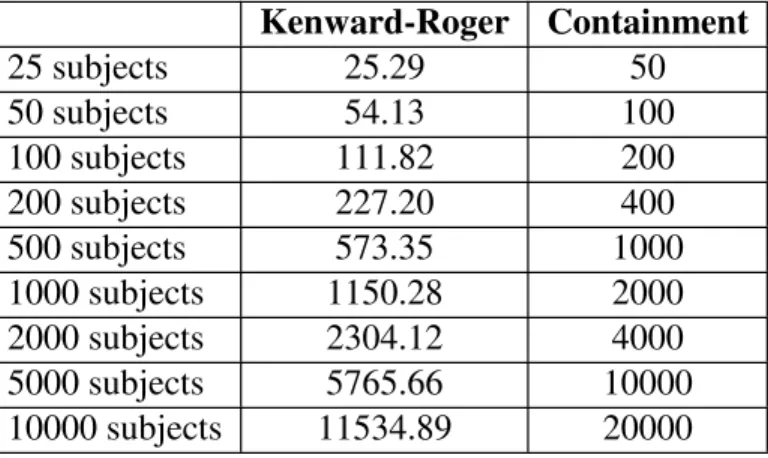
Table 3.2 Formulas to compute the denominator degrees of freedom
using subject sample size for each simulation study...81
Table 3.3 True and simulated V# values for Model I with "
Covariance 1 under REML and ML estimation when using different denominator degrees of
freedom methods...82
Table 3.4 True and simulated V"# values for Model I with Covariance 2 under REML and ML estimation when using different denominator degrees of
freedom methods...83
Table 3.5 True and simulated V"# values for Model I with Covariance 3 under REML and ML estimation when using different denominator degrees of
freedom methods...83
Table 3.6 Average denominator degrees of freedom for
Model II: Covariance 1 under REML estimation
from the simulation study results... 84
Table 3.7 True and average simulated V#
" values for
Model II: Covariance 1 under REML estimation
for the denominator degrees of freedom methods...84
Table 3.8 True and average simulated V#
" values for Model II:
Covariance 1 under ML estimation for the denominator
degrees of freedom methods... 85
Table 3.9 Average denominator degrees of freedom for Model II:
Covariance 2 under REML estimation from the simulation
study results...85
Table 3.10 True and average simulated V"# values for Model II: Covariance 2 under REML estimation by the various
denominator degrees of freedom methods... 86
xiv
Covariance 2 under ML estimation by the various
denominator degrees of freedom methods... 86
Table 3.12 True and average simulated V"# values for Model II: Covariance 3 for the various denominator degrees of
freedom methods...87
Table 3.13 Average denominator degrees of freedom for Model III:
Covariance 1 under REML estimation from the simulation
study results...87
Table 3.14 True and average simulated V# values for Model III: "
Covariance 1 for the various denominator degrees of
freedom methods...88
Table 3.15 Average denominator degrees of freedom for Model III:
Covariance 2 under REML estimation from the simulation
study results...88
Table 3.16 True and average simulated V"# values for Model III: Covariance 2 for the different denominator degrees of
freedom methods...89
Table 3.17 True and average simulated V"# values for Model III: Covariance 3 for the various denominator degrees of
freedom methods...89
Table 3.18 Average V# for the true simulated models and misspecified
"
models with their corresponding asymptotic 'true' V# "
using Kenward-Roger method... 90
Table 3.19 Average V#" for the true simulated models and misspecified models with their corresponding asymptotic 'true' V#" using
the residual method... 90
Table 3.20 Mean (Standard Deviation) of the REML Kenward-Roger
denominator degrees of freedom and statistic for true meanJ
models I...91
Table 3.21 Mean (Standard Deviation) of the REML Kenward-Roger
denominator degrees of freedom and statistic for true meanJ
Table 3.22 Mean (Standard Deviation) of the REML Kenward-Roger denominator degrees of freedom and statistic for true meanJ
models III... 93
Table 4.1 Semi-partial V"# and model V"# using Kenward-Roger usingJ
REML estimation for the dental data with Model II for three
covariance structures...122
Table 4.2 Semi-partial V"# and model V"# using REML estimation with Satterthwaite denominator degrees of freedom for the dental
data with model II for three covariance structures... 122
Table 4.3 Semi-partial V"# and model V"# using REML estimation with the residual degrees of freedom for the dental data
with model II for three covariance structures...122
Table 4.4 Average (Minimum, Maximum) difference between model
semi-partial
V"# and V"# for the continuous time effect
across all 10,000 simulations using REML estimation in Model II...123
Table 4.5 Proportion of times the semi-partial V"# for the continuous time effect exceeds the model V"# across all 10,000
simulations using REML estimation in Model II with
Covariance 2 and Covariance 3... 124
Table 4.6 Percentage of the correct mean model selected using
different denominator degrees of freedom methods when defining V"# and an adjusted V"# for each of the denominator degrees of freedom methods For mean model I with three
different covariance structures... 125
Table 4.7 Percentage of the correct mean model selected using
different denominator degrees of freedom methods when defining V"# and an adjusted V"# for each of the denominator degrees of freedom methods for mean model II with three
different covariance structures... 126
Table 4.8 Percentage of the correct mean model selected using
xvi
degrees of freedom methods for mean model III with three different
covariance structures...127
Table 4.9 Covariance Structure Selection for Model I: Covariance 1
using ML estimation... 128
Table 4.10 Covariance Structure Selection for Model I: Covariance 2
using ML estimation... 129
Table 4.11 Covariance Structure Selection for Model I: Covariance 3
using ML estimation... 130
Table 4.12 Covariance Structure Selection for Model II: Covariance 1
using ML estimation... 131
Table 4.13 Covariance Structure Selection for Model II: Covariance 2
using ML estimation... 132
Table 4.14 Covariance Structure Selection for Model II: Covariance 3
using ML estimation... 133
Table 4.15 Covariance Structure Selection for Model III: Covariance 1
using ML estimation... 134
Table 4.16 Covariance Structure Selection for Model III: Covariance 2
using ML estimation... 135
Table 4.17 Covariance Structure Selection for Model III: Covariance 3
using ML estimation... 136
Table 4.18 Model selection results using AIC criterion as the covariance structure selection for Model I with three different covariance
structures... 137
Table 4.19 Model selection results using AIC criterion as the covariance
structures... 138
Table 4.20 Model Selection Results using AIC criterion as the Covariance structure selection for Model III with three different covariance
structures... 139
Table 4.21 Model selection results using BIC criterion as the covariance structure selection for Model I with three different covariance
structures... 140
Table 4.22 Model selection results using BIC criterion as the covariance structure selection for Model II with three different covariance
structures... 141
Table 4.23 Model selection results using BIC criterion as the covariance structure selection for Model III with three different covariance
xviii
LIST OF FIGURES
Figure 3.1. Plot of Kenward-Roger, Satterthwaite, containment and
residual denominator degrees of freedom methods by subject sample size with prediction lines for each method for Model II:
Covariance 1... 94
Figure 3.2. Plot of Kenward-Roger, Satterthwaite, containment and residual denominator degrees of freedom methods by subject sample size with prediction lines for each method for Model II: Covariance 2... 95
Figure 3.3. Plot of Kenward-Roger, containment and residual denominator degrees of freedom methods by subject sample size with prediction lines for each method for Model III: Covariance 1... 96
Figure 3.4. Plot of Kenward-Roger, containment and residual denominator degrees of freedom methods by subject sample size with prediction lines for each method for Model III: Covariance 2...97
Figure 3.5 Average V"# for Simulated Model - Model I: Covariance 1...98
Figure 3.6 Average V"# for Simulated Model - Model I: Covariance 2...99
Figure 3.7 Average V"# for Simulated Model - Model I: Covariance 3...100
Figure 3.8 Average V"# for Simulated Model - Model II: Covariance 1... 101
Figure 3.9 Average V"# for Simulated Model - Model II: Covariance 2... 102
Figure 3.10 Average V"# for Simulated Model - Model II: Covariance 3... 103
Figure 3.11 Average V"# for Simulated Model - Model III: Covariance 1... 104
CHAPTER 1
INTRODUCTION AND LITERATURE REVIEW
1.1
Introduction
The V# statistic used in linear regression is well known. Its popularity has lead to the development of V# statistics for other types of models, including logistic regression,
proportional hazards regression, and the linear mixed model. There is a growing interest and
need for V# statistics in the linear mixed model because the linear mixed model is an important tool used to analyze continuous longitudinal data. It is an extension of the linear
univariate model which accounts for the correlated measurements of a particular unit. While
the V# statistic and its properties are well developed for linear regression (in the univariate model), there are many different V# statistics for the linear mixed model with var ingy properties. Throughout this chapter, the development and properties ofV# statistics for the univariate, multivariate, and linear mixed models will be highlighted.
1.2
The
V
#Statistic in Linear Univariate Model
The V# statistic for the linear univariate model is well developed and utilized extensively in biomedical research. Researchers in other disciplines find the statistic
appealing because it provides an easy to understand way of explaining how the model fits the
data. Another appealing feature is that it has several equivalent definitions. It is defined as a
goodness of fit measure, squared multiple correlation coefficient and the coefficient of
determination.
The linear univariate model for R subjects and covariates is represented as follows:
(Muller and Stewart, 2006, p. 40-41) :
C \ /
ÐR ‚ "ÑœÐR ‚ :Ñ Ð: ‚ "Ñ ÐR ‚ "Ñ
"
/µ RRˆ!ß5#MR‰
(1.1)
In model 1.1, is a vector of independent responses. C \ is a known constant design matrix of covariates, and is an unknown vector of population parameters."
1.2.2 Formulae and Interpretations of V# in Linear Regression
There are many formulae for V# in the linear univariate model. Kvalseth (1985) gives several different expressions for V# statistics that appear throughout the literature. Two of the V#'s (V# and V#) are the squared multiple correlation coefficient between the regressand
& 6
and the regressors and the squared correlation coefficient between and . These and theC Cs
other expressions of V# are equivalent when using linear least squares regression for a model that includes an intercept (Draper and Smith, 1998, chaps. 1-2).
The predicted values, , in the formulae of Cs V# described in Kvalseth (1985), are computed by fitting model (1.1). Defining V# in this way, does not emphasize the fact that
V# is really a comparison of two models. Anderson-Sprecher (1994) suggest that defining
V# in terms of a model comparison perspective is simpler and minimizes the potential misinterpretations and incorrect usages of the statistic. Muller and Fettermann (2002, p 226)
define V# using a model comparison perspective as follows:
V œ V Ð l ÞÞÞ Ñ
œ Ð Ñ Ð:Ñ
Ð Ñ
# #
" : !
!
C B B
cSSE -SSE d
SSE
" "
3
above equation is equivalent to comparing two models. There is a full model which contains
all of the covariates including the intercept and a null model which contains only an:
intercept.
Equivalently, Draper and Smith (1998, p 141) describe V# as follows,
V œ J
J
# " # "
/
/ / (1.2)
where represents the test of the null hypothesis J L À! "" œ "# œ ÞÞÞ œ":" versus the alternative, L ÀE at least one of the 's (excluding " "!) is zero (i.e. The null hypothesis is that all non-intercept parameters are equal to zero.); /"is the numerator degrees of freedom of the
J statistic which is : "; is the denominator degrees of freedom of the /2 J statistic which is R :. Under L!, since is distributed as J J Ð: "ß R :Ñ , then it is known that V# is
is distributed as a Betaˆ:"# ß R:# ‰.
is a one-to-one function of the overall test. The partial can be used to test
V# J V#
an individual covariate given the other covariates in the model. Muller and Fetterman (2002)
describe the full multiple partial correlation as the correlation between two variables with
both adjusted for other variables. The partial correlation can be denoted as
3cCß B l B ß B ß ÞÞÞß B4 e " # 4"ß ÞÞÞß B:fd.
The formulae presented above give rise to the various interpretations of the V#
statistic in linear regression. The most common way of interpreting V# is as the proportion of variation in the response, , that is described by the covariates, C \. Alternatively, V# is interpreted as the square of the correlation coefficient between the observed outcome and the
predicted outcomes. One can also express V# as a measure of the overall linear association of one dependent variable with several independent variables.
Cameron and Windmeijer (1996) and Kvalseth (1985) define properties of an ideal
V# statistic. The properties proposed by Kvalseth (1985) are as follows:
1. It is a measure of goodness of fit and provides a reasonable interpretation.
2. It is dimensionless.
3. The endpoints of V# correspond to complete lack of fit and perfect fit.
4. It should be general enough to be applied to any model.
5. The model fitting technique should not effect the V#.
6. Comparisons can be made between V# values that are computed using the same dataset.
7. Other goodness of fit measures are relatively comparable to the V#.
8. The residuals that are positive are weighted the same as the residuals that are
negative.
Cameron and Windmeijer (1996) describe four additional properties V# statistics should have. Those properties are:
1. V# does not decrease as covariates are added.
2. V# based on the residual sum of squares coincides with V# based on explained sum of squares.
3. The V# statistic corresponds to a significance test.
4. The interpretation of V# is based on the information content of the data.
Barten (1962) and Montgomery and Morrison (1973) both show that the V# for model
(1.1) is positively biased estimator for the true coefficient of determination. The null
expectation of V# in linear regression using least squares estimation is
I V l œ : " !
R "
Š # L À œ !‹
5
When the total number of observations, R is small, there is potential for large bias. As a result of this positive bias, an adjusted version of V# has been proposed which takes into account the number of covariates in the model. The adjusted version of V# is defined as
V œ " ÐR "ÑÐ" V Ñ ÐR : "Ñ
+#
# .
The adjusted V# increases when a covariate improves the model, whereas the unadjusted V# always increases when covariates are added to the model (represented by the first property in
Cameron and Windmeijer (1996). As a result, the adjusted V# can be used to compare nested models to determine which model is a better fit to the data.
Another important property is that V# converges to the true coefficient of
determination as the sample size increases (Barten, 1962). Helland (1987) states that under
weak conditions, as R Ä ∞,
V Ä
# w
w #
a.s.
x x " " " "
S
S 5
where Sx œ R"" Ð\"BÑ Ðw \ "BÑ; is defined as the B " ‚ : matrix of means of the : covariates, and is an " R ‚ " vector of ones.
1.3
The General Linear Multivariate Model
Correlated data is fairly common in biomedical and social science research.
Multivariate models are one tool used to analyze a set of correlated responses. The correlated
responses may be the same measurement taken repeatedly over time (longitudinal data), or
alternatively there could be different measurements of multiple correlated responses. It is
necessary to take into accoun the correlation t when performing estimation of model
parameters and conducting inference using the data.
The general linear multivariate model is (Muller and Stewart, 2006, 58):p
] œ \ F I
ÐR ‚ :Ñ ÐR ‚ ;Ñ Ð; ‚ :Ñ ÐR ‚ :Ñ (1.3)
where ] is a matrix of repeated measure outcomes where the R rows of ] are mutually independent; \ is a design matrix; F is a matrix of fixed parameters. The random matrix
I has the following properties (1) IÒ Ó œI ! and (2) Zcvec Iw dœ Zcvec ] dœM Œ .
R D
The assumptions of the multivariate model are that there is neither missing nor mistimed
data, the same design matrix applies to all response variables, and the covariance matrix is
not based on the data. Assuming a full rank design, the least squares estimate of F is
Fs œ\ \w "\ ]w which is a unique and unbiased estimator of F (Muller and Stewart,
2006, 65).p
1.3.2 General Linear Hypothesis Tests
The general linear hypothesis for the multivariate model (1.3) is defined as
L À! @!
Ð+ ‚ ,Ñœ GÐ+ ‚ ;ÑÐ; ‚ :ÑF Ð: ‚ ,ÑY
where G Y, and @! represent fixed, known constraints on F. If analyzing repeated measures data, the G matrix represents the between subjects contrasts and the Y matrix represents the within subjects contrasts. In order for the hypothesis to be testable three
conditions must be met. With Q œG \ \ w Gw, the conditions are
Ð"Ñ œ +
Ð#Ñ Ð$Ñ
rank
Q
G \ \ \ \
G œ Y
w w
rank œ ,.
For the multivariate model, there are two groups of hypothesis tests commonly used:
multivariate approach to repeated measures (MULTIREP) tests and univariate approach to
repeated measures (UNIREP) tests. The MULTIREP tests include the Hotelling-Lawley
7
of particular interest because each test has a corresponding multivariate measure of
association. A multivariate measure of association is defined as the proportion of variance
controlled by the multivariate hypothesis. For the general linear hypothesis test given in
(3.2), the hypothesis sum of squares is W2 œŠ@s@!‹wQ"Š@s@!‹. The error sum of squares is W/ œY I IYws sw where Is œ] \Fs. These two quantities are used to compute the MULTIREP test statistics and corresponding measure of association. These tests ands
their measures of association are given in Table 1.1. In Table 1.1, = œ minÐ+ß ,Ñ and is1
defined by Muller and Stewart (2006, p 71) as
1 œ "
+ , % Î + , &
+ , Ÿ % œ c # # # # d"Î#
# # otherwise.
The four MULTIREP tests can be expressed as a one-to-one function of each other
under the null hypothesis and when = œ " (Muller and Stewart 2006, pg 71). When = ", the four multivariate statistics do not have this property. Furthermore, there is not one single
multivariate test statistic that satisfies all of the standard optimality criteria for the more
complex constrasts (= "). The exact distributions of these statistics are only known for special cases when = ". Johnson and Wichern (1992) provide conditions where functions of Wilks' Lambda have an distribution and exact tests are possible. Anderson (2003, pJ
330) shows that the Hotelling-Lawley trace criterion converges in distribution to the ;#
distribution.
It is also important to know the distribution of the test statistics under the alternative
hypothesis to calculate the power of each of the tests. Anderson (2003, p 334) describes how
the power of each of the MULTIREP tests approaches one since the noncentrality parameters
of the tests tends to infinity. As a result, to compare the various MULTIREP tests, it is more
informative to consider a sequence of alternatives such that the powers of the tests will vary.
Sen and Singer (1993, p 238) define a sequence of local Pitman-type alternatives as
LE8 À @8œ@! 8
?
Defining a sequence of local alternatives in this way shows how the alternative is not held
fixed but allowed to get closer and closer to the null hypothesis as the sample size increases.
Power of the four MULTIREP tests can be computed using a sequence of Pitman-type
alternatives and quantized limits. Glueck (1997), Glueck and Muller (2003) and Anderson
(2003) define quantized limits by first, defining a positive integer , and let 7 R Ð7Ñ œ 7R. A quantized limit is then defined such that as 7 Ä ∞, then through a sequence of quantized steps of size R R Ð7Ñ Ä ∞Þ, It is important to recognize that R remains fixed as R Ð7Ñ
increases. Muller et al. (2007) provide new power approximations for all four UNIREP tests
which eliminate the inaccuracies in existing methods.
The bias of various multivariate measures of association for multivariate analysis of
variance model was examined by Kim and Olejnik (2005) and Steyn and Ellis (2009). These
authors conclude that all of the multivariate measures of association examined, including
Wilks' lambda, Hotelling-Lawley trace and Pillai's trace criterion, are biased with the bias
increasing when the sample size is small, and when the number of outcome variables
increases. Steyn and Ellis (2009) introduce the multivariate measures of association as effect
sizes and additionally show that they are biased when the effect size is small.
1.4
The General Linear Mixed Model
The linear mixed model is another way to analyze correlated response data. Laird and
Ware (1982) introduced the general linear mixed model for longitudinal data, based on the
work of Harville (1977). This two-stage random effects model easily accommodates
unbalanced data whereas multivariate models can not. The linear mixed model also differs
from the multvariate model in that it is able to handle mistimed data and allows the structure
of the covariance matrix to be specified by the data instead of assuming its structure.
9
The linear mixed model (LMM) is a powerful statistical tool for analyzing
longitudinal data. The linear mixed model for an independent sampling unit is (Muller and3
Stewart, 2006, Chapter 5):
C3 \ ^ . /
Ð8 ‚ "Ñ3 Ð8 ‚ :Ñ3 Ð: ‚ "Ñ Ð8 ‚ 5ÑÐ5 ‚ "Ñ3 Ð8 ‚ "Ñ3
œ 3 " 3 3 3 à 3 œ "ß ÞÞÞß 7 (1.4)
Here, is a vector of observations for subject ; C3 3 \3 is a known, constant design matrix for subject , with full column rank ; is a vector of unknown, constant, population3 : "
parameters; ^3 is a known, constant design matrix for subject corresponding to the random3
effects , with rank ; is a vector of unknown, random individual parameters; .3 5 .3 /3is an 83
‚ " vector of random errors. Also, R œ8. Throughout, is Gaussian with mean 3œ"
7
3 .3 !
Ð5‚ "Ñ and covarianceD.3 7. , independently of Gaussian /3 Ð83 ‚"Ñ with mean !Ð83‚ "Ñ and covariance D/3 7/ Ð8 ‚ 8 Ñ3 3 , so that
i D
D Œ” •./3
3
. .
/ /
œ !
!
Π3
3
7
7
Here i † is the covariance operator, D.3 7. is a 5 ‚ 5 positive-definite, symmetric covariance matrix of the random effects, and D/3 7/ is an unknown 83 ‚83, constant positive-definite matrix. Under the assumptions, i C3 can be expressed as
D3 7 œ ^3D.3 7. ^3w D/3 7/ . Generally, it is assumed that the covariance D3can be
characterized by a finite set of parameters represented by an < ‚ " vector , which consists7
of the unique parameters in D.3 7. and D/3 7/ . Additionally, ) œÐ ß" 7w w wÑ will be the =
‚ " vector of parameters for model (1.4), where = œ : <.
1.4.2 Estimation Techniques
There are primarily two estimation techniques used in the linear mixed model:
1982; Jennrich and Schluchter, 1986). The technique used plays an important role in both
inference and estimation. The marginal log-likelihood function for model (1.4) is
6 œ R Ð# Ñ " l l
# #
" Ð Ð
# MLÐ Ñ
Ñ Ñ
", 7 D 7
" D 7 "
log 1 log
3œ" 7 3œ" 7 " 3
3 3 w 3 3 3
C \ C \
The restricted log-likelihood function for model (1.7) is
6 œ R : Ð# Ñ " "
# # #
" " Ð Ð
# #
REMLÐ Ñ
Ñ Ñ
", 7 D 7
D 7 " D 7 "
log log log
log
1 » » k k
» » 3œ" 3œ" 7 7 w 3 3 3œ" 3œ" 7 7 w 3 3 " " \ \
\ \ C \ C \
3
3 3 3 w 3 3 3
The expression for the estimate of is given by"
"s œ D 7s D 7s
3œ" 3œ"
7 7
w w
3 " 3 3 " 3
"
\ 3 s \ \ 3 s C .
The expression for "s is the same for ML and REML, but the estimates differ based on the estimation of D 73 . The estimator, , is unbiased; however, there is no closed for"s m
expression for the variance of . The common approach is to estimate the approximate"s
variance with
Z Ð Ñ
s s" œ s
3œ" 7
w
3 " 3 "
\D 73 s \ . (1.5)
Kackar and Harville (1984) have shown that formula (1.5) underestimates the true
variance of "s.
11
Inference in the linear mixed model has advanced considerably since it was first
popularized in the seminal works of Harville (1977) and Laird and Ware (1982). There are
special cases of balanced data where the exact distribution of the parameter estimates is
known (Grizzle and Allen, 1969). Although generally, exact distributions are not known.
Asymptotic approximations are used for inference. Laird and Ware (1982) suggest using
asymptotic likelihood ratio tests for fixed effect hypothesis tests. The simulation studies in
Helms (1992) show an inflated Type I error rate of the asymptotic likelihood ratio test.
Welham and Thompson (1997) propose adjusted likelihood ratio tests when using REML
estimation for fixed effects hypothesis tests. Another complication to using the likelihood
ratio test is presented by Verbeke and Molenberghs (2000). The authors explain that the
likelihood ratio test based on REML log-likelihood function, (1.10), should not be used for
hypotheses involving the fixed effects.
As an alternative to the likelihood ratio test, Helms (1992) and others have proposed
an approximate test for testing the fixed effects. J The approximate tests are a Wald-typeJ
test for the hypothesis,
L À! G"œ! vs. L ÀA G" Á!
which has the general form,
JŠsß ‹œ Þ
Š ‹ Š ‹
" 7
" 7 "
s
s
G G G G
G
s w " w s
"
– Œ3œ" —
7 w
3 " 3
\ Ds3 \
rank (1.6)
The JŠ" 7sßs‹ statistic is usually approximated by an distribution to account for theJ
underestimation of the variance of "s.
There are several methods for determining the denominator degrees of freedom, , for/
based on the residual degrees of freedom. The residual denominator degrees of freedom are
R :. This method is correct for designs where the outcome is independent and identically distributed (ie. ignoring covariance structure of the model.) because it is the same degrees of
freedom of the error term as the conventional test. This method should only be consideredJ
when there is a very large sample size and asymptotic distributions are good approximations.
Kesselman et al. (1999a) conclude that the degrees of freedom using the residual method are
too large when the covariance is not spherical.
The MIXED procedure used in SAS (2004) describes an alternative method of
calculating the denominator degrees of freedom called the containment method. This method
is based on the degrees of freedom in the balanced split-plot designs. The degrees of freedom
are calculated by scanning the random effects terms to determine if they contain the fixed
effect which is being tested. If no random effect contains the fixed effect being tested, the
denominator degrees of freedom is the same as the residual method.
A more conservative method involves adjusting the degrees of freedom using the
procedure developed by Satterthwaite (1946). The Satterthwaite (1946) approximation
computes the denominator degrees of freedom using the chi-square distribution to
approximate the distribution of the estimated variance of G s". Specifically, the estimated approximate denominator degrees of freedom for a linear combination of fixed effects
estimates (G is an " ‚ : matrix.) are,
/ s œ
#
s
– Œ —
– Œ —
G G G G 3œ" 7 w
3 " 3
3œ" 7 w 3 " 3
\ s \
\ s \
D D 3 3 7 7 s s " w # " w Var ,
where the denominator is approximated using gradients (Littell, 2002). Keselman et al.
(1999b) found that the tests using Satterthwaite method of estimating denominator degreesJ
13
authors also noted that the tests were more robust when the true covariance structure wasJ
known.
Another method of estimating the degrees of freedom which is very similar to the
Satterthwaite approach was developed by Kenward and Roger (1997). These authors not
only estimate the denominator degrees of freedom for the test in the linear mixed modelJ
but also adjusted the estimates of the covariance matrix of the parameter estimates. A more
accurate estimate of D3 7 is computed to account for the variability in s7 and account for the small sample bias. Kenward and Roger (1997) approximate the distribution of the -statisticJ
by choosing a scale and denominator degrees of freedom such that - 7 -J µ J 6ß 7
approximately.
There have been various studies done to compare these methods of estimating the
denominator degrees of freedom. Alnosaier (2007) has shown special cases computing the
degrees of freedom using Satterthwaite method coincides with the Kenward-Roger method.
Other studies have examined when the two methods differ. Schaalje et al. (2002) found the
two methods Type I error rates were affected by simulation scenarios of different imbalance,
sample size, and covariance structure complexity. The Kenward-Roger method outperformed
or performed similarly to the Satterthwaite approximation in all simulation scenarios. Most
recently, Arnau et al. (2009) compared the Type I error rate of the tests using Kenward-J
Roger, the Satterthwaite and containment degrees of freedom. The simulation results showed
that the Satterthwaite approach had liberal Type I error rates, and that the Kenward Roger
approach provides the best control of the Type I error rates.
A sequence of random variables e f\8 is said to converge in distribution to ,\
denoted as, \8 Äd\ if the distribution functions ofJ8 and of J \8 and satisfy:\ J B Ä J B8 as 8 Ä ∞ for each continuity point of .B J
Given a random variable with \ \ µ J Ð/"ß /#ß =Ñ then as /# Ä ∞ \, Äd] where
] µ/" Ð Ñ
sample theory, gives JŠ" 7sßs‹Äd+";#Ð+ß Ñ= . Schluchter and Elashoff (1990) and Manor
and Zucker (2004) have examined the chi-square approximation for small sample data using
both REML and ML estimation. The chi-square approximations had inflated Type I error
rates.
1.4.4 Misspecification of the Covariance
In practice, information regarding the covariance structure is often unknown. As a
result, researchers must assume a covariance structure for the data. Assumptions about the
distribution of the random effects and errors are also made when fitting a linear mixed model.
The linear mixed model assumption as seen in Section s 1.4.1 are that the errors and the
random effects are independent and normally distributed. Much research has been done
examining what happens when these assumptions about the random effects and errors are
incorrect, and the covariance is misspecified. Thus, there are two types of covariance
misspecification that can occur. First, it is possible that the structure has been misspecified.
The other misspecification occurs is if either the distribution of the error term or the
distribution of the random effects does not meet the linear mixed model assumptions (i.e.
neither is normally distributed.).
Many authors suggest that specifying the covariance structure can lead to more
accurate fixed effects inference. One potential disadvantage would be if the covariance
structure is misspecified. Ferron et al. (2002) examined the sensitivity of various fit criteria
to misspecifications of the covariance structure, and then examined the bias of the fixed
effects and random effects parameters when there was misspecification They simulated data.
from a first order autoregressive error structure and determined that Akaike's Information
Criteria (AIC) identified the correct structure 70% of the time and the Schwartz's Bayesian
Criterion identified the correct structure 45% of the time. Additionally, when the error
15
or the tests of the fixed effects, but there was bias in the estimates of the random effects.
Gomez et al. (2005) examined the Kenward-Roger statistic Type I error rates for tests ofJ
fixed effects when simulating data based on 15 different covariance structures when the
covariance structure is selected using AIC and BIC. The authors concluded that the Type I
error rates of the KR statistic when covariance is unknown were greater than 0.05 for all ofJ
their simulation studies.
Ferron, Dailey and Yi (2002) examined the effect of underspecification of the error
structure on the fixed effects estimates and their standard errors under REML estimation. In
their simulation study, the true error structure was autoregressive of order 1 and the
misspecified error structure is independent and identically distributed. Underspecification of
the error structure lead to unbiased estimator of the fixed effects but the variance parameterss
were biased. Kwok, West and Green (2007) found similar results with respect to
underspecification of the error structure. These authors expanded the result by also lookings
at general misspecification and overspecification. They conclude that general
misspecification of the error structure lead to an overestimation of the variances of the
random effects which implies overestimation of the standard errors of the fixed effect.
Alternatively, overspecification of the error structure lead to smaller random effect variances
which implies standard errors of fixed effects were smaller.
Verbeke and Lesaffre (1997) investigated the effect of misspecifying the distribution
of the random effects on the inference based on the ML estimates of the model. The authors
concluded that misspecifying the distribution of the random effects does not ffect the MLa
estimates of the fixed effects. Actually, the fixed effects estimates are consistent and
asymptotically normally distributed regardless of the distribution of the random effects, but
the misspecification of the distribution does have an effect on the random components.
Similarly, Fellingham and Raghunathan (1995) found that when the distribution of the
Conversely, REML estimation is poor when the random effects distribution is not symmetric.
Manor and Zucker (2004) found similar results when they simulated data where the random
terms had a t-distribution (symmetric) and a log-normal distribution. The Type I error rates
were closer to the nominal level when the random effects had a t-distribution as compared to
the log-normally distributed random effects. When the random effects were simulated from
the log-normal distribution, the Type I error rates were larger than when random effects were
simulated from the t-distribution. Vallejo, Ato, and Valdes (2008) also researched the
consequences of covariance misspecification by examining Type I error rates for tests of
fixed effects when choosing a model based on various information criteria. The Type I error
rates of the models chosen from the AIC criterion that were generated from symmetric
distributions were robust.
1.5
V
#Statistics for the Linear Mixed Model
1.5.1 Criteria for Assessing V# statistics for the Linear Mixed Model
As seen in Section 1.2, the V# statistics for the linear univariate model using least squares regression are equivalent. Unfortunately, the various V# statistics for other models are different and do not coincide (Kvalseth, 1985). Each of the formulae given in Section 2
are ways in which the V# statistic can be adapted in the linear mixed model. Those formulae are not equivalent in the case of the linear mixed model. When applying those formulae very
different V# statistics arise. At this time, there is not a universally accepted V# statistic for fixed or random effects in the linear mixed model because opinions differ as to what V#
should measure in this setting. This poses a problem when determining from which V#
statistic for the linear mixed model to choose.
Kramer (2005) further describes the impossibility of defining a single V# for fixed effects for mixed models due to the complexity of the model and the variety of questions that
17
fixed effects, or of the random effects. Edwards et al. (2008) highlight the three types of
model comparisons that occur in the linear mixed model. It is possible to compare models
with the same covariance structure but different fixed effects, models with the same fixed
effects but different covariance structures, and models with different fixed effects and
different covariance structures. This distinction is important because in the linear mixed
model, variation can be explained due to the fixed effects or due to the covariance
specification.
Another issue when defining an V# statistic for fixed effects for the linear mixed model is the choice of the null model. Throughout the literature of V# statistics in the linear mixed model, there has mainly been two null models that have been discussed. There is the
null model with only an intercept in the fixed effects and the null model with both a fixed and
random intercept. The null model for V"#, an V# statistic for fixed effects defined by Edwards et al. (2008) can be, different from those two null models. It has a fixed effect in
the intercept and the same covariance structure as the model of interest. The interpretation of
the V# statistic depends on the choice of the null model (Edwards et al., 2008).
1.5.2 Evaluating the V# Statistics for the Linear Mixed Model
Table 1.2 is a summary of the V# statistics used in the linear mixed model. A comprehensive review and details of notation is provided in Edwards et al. (2008). Since
many of the V# statistics for the linear mixed model are new, there is an increased interest in evaluating each of them and how they behave. The evaluation methods used in the recent
work focus on the properties that are important for an ideal V# statistic.
One property that is important for V# statistics is that the statistic increases when important covariates are added to the model. Conversely, it is not desirable for the V#
statistic to increase when fitting an overfitted model. Orelien and Edwards (2008) evaluated
proposed by Xu (2003) (Hs#, V##and s3#) in distinguishing between overfitted, true, and underfitted models. The marginal version of these statistics refers to when the predicted
values are computed using only the fixed effects ŠCs œ3 \3"s‹, and the conditional version refers to when the predicted values are computed using the random
effectsŠCs œ3 ‹. The conditional versions of < ß V ß- # and s , V#
# #
\3"s ^ .3 3s 1 Trand as well as H
and s3# performed poorly. Those statistics could not distinguish when important covariates were missing whereas, the marginal versions of < ß V ß- #1 and Trand could The authors.
conclude that the marginal V# statistics presented are able to determine the most parmonious model among overfitted, true, and underfitted models.
Another important property of a V# statistic is that they are monotone. Liu et al. (2008) show that two of the three V# statistics that they proposed are monotone through examining the dimension of the projected subspace of their statistics.
Sun et al. (2010) also emphasize the importance of the monotonic nondecreasing
property in a nV# statistic. The authors primary reason for choosing Magee's (1990) likelihood ratio based statistic was due to that property. They evaluated the performance of
VLR# < VW#
-, Trand, and conditional and marginal versions of . They were intested in finding which statistic best captured the quantitative locus trait effect in association mapping.
Another important property for Sun et al. (2010) was that the V# statistic reduces to the usual
V# statistic for the fixed linear model. The authors point out that <
- does not have this property.
Another evaluation method used is based on the ability of a nV# statistic to select a model. Wang and Schaalje (2009) conducted a simulation study on 17 model selection
statistics to determine the success rate of choosing a fixed effect when the covariance
19
compound symmetric covariance structure. There was not one criterion that was consistently
better than the others. Performance of these model selection criteria was found to be based
on covariance structure, values of parameters, and sample size.
Kramer (2005) focused on examining V# statistics as a goodness of fit measurement.
VPV# and V[# statistics were evaluated and the author found that as the model complexity increased, the V# statistics increased.
1.5.3 V"# for fixed effects in the Linear Mixed Model
Edwards et al. (2008) expanded on formula (1.2) and proposed an V# statistic for the fixed effects in the linear mixed model. The newly proposed V"# is as follows,
V œ
; " J s sß " ; " J s sß
"#
"
"
Š ‹
Š ‹
/ /
" D " D
.
Edwards et al. (2008) showed that under certain conditions where the linear mixed model
coincided with the multivariate linear model, the V"# is identical to the Hotelling-Lawley trace association statistic. Another correspondence between a statistic for the linear mixed
model and a statistic for the multivariate linear model is shown in Bathke et al. (2009).
These authors showed, under special cases, the equivalence of an ANOVA type statistic from
the linear mixed model and the Greenhouse-Geisser adjustment.J
The V"# statistic Edwards et al. (2008) propose is based on the restricted maximum likelihood (REML) estimation while noting that the formulae do apply to the maximum
likelihood estimation computations. Additionally, the authors recommend using the
Kenward-Roger to define J V"# because small sample inference of the Kenward-Roger isJ
the most accurate.
a signficance test because it is a 1-1 function of the test for the linear mixed model usingJ
Kenward-Roger's statistic and REML estimation. The J V# statistic based on the likelihood ratio test introduced by Magee (1990) also has this property.
Another advantage of the V"# proposed is that the same statistic generalizes to define a partial V# statistic for marginal (fixed) effects of all sorts. None of the other V# statistics reviewed appear to have the same important property.
1.6
Summary and Overview
In the linear univariate model, the V# statistic has been extensively researched and is a widely implemented analysis tool. It serves as a goodness of fit tool, a model selection tool,
and a measure of the strength of association. There are several formulae for the V# statistic and they are all equivalent under the context of linear regression models.
Each expression for the V# statistic in the univariate model gives rise to a nV#
statistic in the linear mixed model. Unfortunately, these statistics are not equivalent and there
is not one universally accepted V# statistic for the linear mixed model.
through both theoretical This dissertation will present some of the properties ofV"#
and applied analysis. In Chapter 2, theoretical results are presented which describe the
asymptotic properties of V"# defined by the Kenward-Roger method using approximations to the mean and variance of V"#. In addition, two tests of hypothesis are developed and
evaluated using a large scale simulation study. Chapter 3 examines the impact of covariance
structure misspecification, denominator degrees of freedom methods, estimation techniques
21
Table 1.1 Test Statistics for General Linear Hypothesis and the Corresponding Multivariate Measures of Association
Hotelling-Lawley Trace Pillai-Bartlett Trace Wilks' Lambda Roy's Largest Root
trÐW W2 "Ñ trW W2Ð 2 W Ñ" trW WÐ 2W Ñ" max eigenvalue
/ c / d c / / d W W W
2 2 / " Î=
" Î= = "Î1 Ð Ñ
Ð Ñ
Ð Ñ
œ œ œ "
( HLTHLT ( PBT ( trtr
WLK WW2W
2 /
Table 1.2. Summary of V# Statistics in the Linear Mixed Model
Source Formula
Vonesh et al. (1996)
Vones
<- œ "
ˆ ‰ ˆ ‰ ˆ ‰ ˆ ‰
3œ" 7
3 3 w 3 3
3œ" 3œ"
7 7
3 83 3 83 83 83
w w
3 3 #
C sC C sC
C C sC sC
C1 C1 Cs1 Cs1 R CCs
h and Chinchilli (1997)
Zheng (2000)
V œ " 1#
C C
. ß Î# Ðs s Ñ Î#s
ˆ ‰ ˆ ‰
3œ" 7
3 3 w 3 3
3œ" 7
3 83 w 3 83
3œ" 7
3 3 3 w C sC C sC
C C
C Cs , KŒM ,
1 1
Trand œ "
5 7
ˆ ‰
3œ" 7
3 3 83
# ! # # ! ! # # #!
. ß C ÎÐ# Ñs
# s
s ##
s
s s s
VWW
R R
VWW
# #
8
C 1 5
5 5
5
5 5 5
Xu (2003) . . . Magee (1990) " #
$ s œ " Hs œ " V œ "
V œ "
VWW VWW # ! 3 exp exp Š ‹ ‘
LR logP logP V œ "
Q [# C C 0 Buse (1973)
ˆ ‰ ˆ ‰
3œ" 7
3 3 w 3" 3 3
3œ" 7
3 83 w 3" 3 83 C sC Z C sC
REFERENCES
Alnosaier, W.S. (2007). Kenward-Roger approximate F test for fixed effects in mixed linear models. Unpublished doctoral dissertation, Oregon State University, Portland, OR.
Anderson, T.W. (2003). An introduction to multivariate statistical analysis. (3 ed.).rd Hoboken, NJ: Wiley.
Anderson-Sprecher, R. (1994). Model comparisons and R . # The American Statistician 48, 113-117.
Arnau, J., Bono, R. and Vallejo, G. (2009). Analyzing small samples of repeated measures data with mixed model adjusted test. J Communications in Statistics- Simulation and Computation38, 1083-1103.
Barten, A.P. (1962). Note on unbiased estimation of the squared multiple correlation coefficient. Statistica Neerlandica16, 151-163.
Bathke, A.C., Schabenberger, O., Tobias, R.D., and Madden, L.V. (2009).
Greenhouse-Geisser adjustment and the ANOVA-type Statistic: Cousins or twins? The American
Statistician613, 239-246.
Buse, A. (1973). Goodness of fit in generalized least-squares estimation. American Statistician, 27, 106–108.
Cameron, A.C. and Windmeijer, F.A.G. (1996). R-squared measures for count data regression models with applications to health-care utilization. Journal of Business and Economic Statistics14, 209-220.
Draper, N.R., and Smith, H. (1998). Applied Regression Analysis (3 ed.). New York, NY:rd Wiley.
Edwards, L.J., Muller, K.E., Wolfinger, R.D., Qaqish, B.F., and Schabenberger, O. (2008). An V# statistic for fixed effects in the linear mixed model. Statistics in Medicine27, 6137-6157.
Fellingham, G.W. and T.E. Raghunathan. (1995). Sensitivity of point and interval estimates to distributional assumptions in longitudinal data analysis of small samples.
23
Ferron, J., Dailey, R., and Yi, Q. (2002). Effects of misspecifying the first-level error structure in two-level models of change. Multivariate Behavioral Research37, 379-403.
Ferron, J., Hogarty, K. Y., Hess, M., Romano, J., Kromrey, J. D., Niles, J. D., Dawkins, G.R., and Sentovich, C. (2002). A macro for examining the consequences of error structure
misspecifications. Proceedings of the Twenty-Seventh Annual SAS Users Group
International Conference, Cary, NC: SAS Institute Inc. 201-227.
Glueck, D.H. (1996). Power for a generalization of the GLMM with fixed and random
predictors. Unpublished doctoral dissertation, University of North Carolina at Chapel Hill, Chapel Hill, NC.
Glueck, D.H. and Muller, K.E. (2003). Adjusting power for a baseline covariate in linear models. Statistics in Medicine22, 2535-2551.
Gómez, V.E., Schaalje, G.B., & Fellingham, G.W. (2005). Performance of the Kenward-Roger method when the covariance structure is selected using AIC and BIC. Communications in Statistics- Simulation and Computation34, 377–392.
Grizzle, J.E., Allen, D.M. (1969). Analysis of growth and dose response curves. Biometrics
25, 357–381.
Harville, D.A. (1977). Maximum likelihood approaches to variance component estimation and to related problems. Journal of the American Statistical Association72, 320-340.
Helland, I.S. (1987). On the interpretation and use of V# in regression analysis. Biometrics
43, 61-69.
Helms, R.W. (1992). Intentionally incomplete longitudinal designs: I. Methodology and comparison of some full span designs. Statistics in Medicine11, 1889-1913.
Jennrich, R.I. and Schluchter, M.D. (1986). Unbalanced repeated-measures models with structured covariance matrices. Biometrics42, 805-820.
Johnson, R.A. and Wichern, D.W. (2002). Applied Multivariate Statistical Analysis (5th ed.). Hoboken, NJ: Prentice Hall
Kackar, R.N. and Harville, D.A. (1984). Approximations for standard errors of estimations of fixed and random effects in mixed linear models. Journal of the American
Kim, S. and Olejnik, S. (2005). Bias and precision of measures of association for a fixed-effect multivariate analysis of variance model. Multivariate Behavioral Research40, 401-421.
Kenward, M.G. and Roger, J.H. (1997). Small sample inference for fixed effects from restricted maximum likelihood. Biometrics53, 983-997.
Keselman, H.J., Algina, J., Kowalchuk, R.K., and Wolfinger, R.D. (1999a). A comparison of recent approaches to the analysis of repeated measurements. British Journal of Mathematical and Statistical Psychology52, 63-78.
Keselman, H.J., Algina, J., Kowalchuk, R.K., and Wolfinger, R.D. (1999b). The analysis of repeated measurements: A comparison of mixed model Satterthwaite tests and aJ
nonpooled adjusted degrees of freedom multivariate test. Communications in Statistics- Theory and Methods28, 2967-2999.
Kramer, M. (2005). R statistics for mixed models. 2005 2 Proceedings of the Conference on
Applied Statistics in Agriculture, Manhattan, KS, pp 148–160.
Kvalseth, T.O. (1985). Cautionary note about V#. The American Statistician39, 279-285.
Kwok, O., West, S.G. and Green, S.B. (2007). The impact of misspecifying the within-subject covariance structure in multiwave longitudinal multilevel models: A monte carlo study. Multivariate Behavioral Research42, 557-592.
Laird, N.M. and Ware, J.H. (1982). Random-effects models for longitudinal data. Biometrics38, 963-974.
Liu, H., Zheng, Y, and Shen, J. (2008). Goodness-of-fit measures of R for repeated2 measures mixed effect models. Journal of Applied Statistics35, 1081-1092.
Littell, R.C. (2002). Analysis of unbalanced mixed model data: A case study comparison of
ANOVA vs. REML/GLS. Journal of Agricultural, Biological and Environmental
Statistics , 472-490.7
Magee, L. (1990). V# measures based on Wald and likelihood ratio joint significance tests. The American Statistician44, 250-253.