Effects of Pregnancy on the Pharmacokinetics of Metformin
Michael Z. Liao, Shannon K. Flood Nichols, Mahmoud Ahmed, Shannon Clark, Gary D. Hankins,
Steve Caritis, Raman Venkataramanan, David Haas, Sara K. Quinney, Laura S. Haneline,
Alan T. Tita, Tracy Manuck, Joanne Wang, Kenneth E. Thummel, Linda Morris Brown,
Zhaoxia Ren, Thomas R. Easterling, and Mary F. Hebert
University of Washington, Departments of Pharmaceutics (M.Z.L., J.W., K.E.T.), Obstetrics and Gynecology (T.R.E., M.F.H.), and Pharmacy (T.R.E., M.F.H.), Seattle, Washington; Madigan Army Medical Center, Division of Maternal-Fetal Medicine, Department of Obstetrics and Gynecology, Tacoma, Washington (S.K.F.N.); University of Texas Medical Branch in Galveston, Department of
Obstetrics and Gynecology, Galveston, Texas (M.A., S.Cl., G.D.H.); University of Pittsburgh, Departments of Obstetrics and Gynecology (S.Ca.), Pharmacy and Pharmaceutical Sciences (R.V.), Pittsburgh, Pennsylvania; Indiana University, Departments of
Obstetrics and Gynecology (D.H., S.K.Q.) and Pediatrics (L.S.H.), Indianapolis, Indiana; University of Alabama at Birmingham, Department of Obstetrics and Gynecology, Birmingham, Alabama (A.T.T.); University of North Carolina, Department of Obstetrics and Gynecology, Chapel Hill, North Carolina (T.M.); Biostatistics and Epidemiology Division, Environmental and Health Science Unit, RTI International, Rockville, Maryland (L.M.B.); and Obstetric and Pediatric Pharmacology and Therapeutic Branch, Eunice Kennedy
Shriver National Institute of Child Health and Human Development, Bethesda, Maryland (Z.R.)
Received June 24, 2019; accepted December 30, 2019
ABSTRACT
This study’s primary objective was to fully characterize the phar-macokinetics of metformin in pregnant women with gestational diabetes mellitus (GDM) versus nonpregnant controls. Steady-state oral metformin pharmacokinetics in pregnant women with GDM receiving either metformin monotherapy (n524) or a combination with glyburide (n530) as well as in nonpregnant women with type 2 diabetes mellitus (T2DM) (n 524) were determined utilizing non-compartmental techniques. Maternal and umbilical cord blood samples were collected at delivery from 38 women. With both 500-and 1000-mg doses, metformin bioavailability, volume of distribution beta (Vb), clearance, and renal clearance were significantly
in-creased during pregnancy. In addition, in the women receiving metformin 500 mg, significantly higher metformin apparent oral clearance (CL/F) (27%), weight-adjusted renal secretion clearance (64%), and apparent oral volume of distribution beta (Vb/F) (33%)
were seen during pregnancy. Creatinine clearance was significantly higher during pregnancy. Increasing metformin dose from 500 to 1000 mg orally twice daily significantly increased Vb/F by 28%,
weight-adjusted Vb/F by 32% and CL/F by 25%, and weight-adjusted
CL/F by 28% during pregnancy. Mean metformin umbilical cord
arterial-to-venous plasma concentration ratio was 1.060.1, venous umbilical cord-to-maternal concentration ratio was 1.4 6 0.5, and arterial umbilical cord-to-maternal concentration ratio was 1.560.5. Systemic exposure after a 500-mg dose of metformin was lower during pregnancy compared with the nonpregnant women with T2DM. However, in patients receiving metformin 1000 mg, changes in esti-mated bioavailability during pregnancy offset the changes in clearance leading to no significant change in CL/F with the higher dose.
SIGNIFICANCE STATEMENT
Gestational diabetes mellitus complicates 5%–13% of pregnancies and is often treated with metformin. Pregnant women undergo physiological changes that alter drug disposition. Preliminary data suggest that pregnancy lowers metformin concentrations, poten-tially affecting efficacy and safety. This study definitively describes pregnancy’s effects on metformin pharmacokinetics and expands the mechanistic understanding of pharmacokinetic changes across the dosage range. Here we report the nonlinearity of metformin pharmacokinetics and the increase in bioavailability, clearance, renal clearance, and volume of distribution during pregnancy.
Introduction
Gestational diabetes mellitus (GDM) complicates 5%–13% of pregnancies in the United States. (Hunt and Schuller, 2007). GDM is associated with carbohydrate intolerance resulting in hypergly-cemia of variable severity (World Health Organization, 2014). GDM is associated with increased risk for maternal infections, traumatic deliveries, hypertensive disorders, and preeclampsia as well as neonatal hypoglycemia, respiratory distress syndrome, macrosomia, polyhydramnios, shoulder dystocia, and kernicterus (Bryson et al., 2003; Reece, 2010). Surgical deliveries are much more common in women with GDM. Although GDM resolves after pregnancy, these women have an increased risk of type 2 diabetes mellitus (T2DM) later in life (Kitzmiller et al., 2007; Dabelea and Crume, 2011).
This research was supported in part by theEunice Kennedy ShriverNational Institute of Child Health and Human Development [Grants U10HD063094, U10HD047892, U10HD047905, U10HD047891, and U10HD057753], the National Institutes of Health National Center for Advancing Translational Science through the Clinical and Translational Science Awards Program [Grants ULITR000423, TLITR000422, and ULITR001108], and National Institute of General Medical Sciences of the National Institutes of Health [Grant R01GM124264]. The content of this manuscript is solely the responsibility of the authors and does not necessarily represent the official views of theEunice Kennedy ShriverNational Institutes of Child Health and Human Development or the National Institutes of Health. In addition, the views expressed are those of the author(s) and do not reflect the official policy or position of the US Army Medical Department, US Department of the Army, US Department of Defense, or the US Government. The investigators have adhered to the policies for protection of human subjects as prescribed in 45 CFR 46.
Historically, insulin has been the mainstay of GDM pharmacological treatment. However, because of ease of administration, lower cost, and comparable efficacy, oral hypoglycemic agents are now commonly used in the management of GDM. Metformin, an oral antihyperglycemic biguanide frequently used in the treatment of GDM, decreases insulin resistance (DeFronzo, 1999; Winder and Hardie, 1999; Zhou et al., 2001). Dosage strategies for pregnant women with GDM typically follow the Food and Drug Administration–approved dosage range for metformin in nonpregnant subjects with T2DM. Metformin is a small, basic compound with a high unbound fraction (Scheen, 1996). In addition, it is a substrate for organic cation transporters (OCTs) (Wang et al., 2002; Kimura et al., 2005; Tanihara et al., 2007) and, after a 500-mg dose, almost entirely excreted unchanged in the urine (Pentikäinen et al., 1979; Zhou et al., 2007; Graham et al., 2011). OCT2 (encoded by SCL22A2) has been proposed to play a critical role in the pharmaco-kinetics (PK) of metformin. Metformin is actively transported from the circulation into renal epithelial cells primarily by OCT2 leading to net renal secretion (Takane et al., 2008). As a strong base with pKa of 11.5, metformin’s net tubular secretion is not likely to be subject to passive tubular reabsorption (Scheen, 1996). Decreased activity of OCT2 in nonpregnant subjects due to genetic differences or drug-drug interac-tions with inhibitors, such as cimetidine, results in 30%–60% decrease in metformin renal and net renal secretion clearances and up to 74% in-crease in area under the concentration-time curve (AUC) (Song et al., 2008; Wang et al., 2008; Chen et al., 2009; Blackhall et al., 2010; Dumitras et al., 2013). Renal excretion of metformin from tubular cells into the urine is mediated through the multidrug and toxin extrusion proteins (MATEs) 1 and 2-K (MATE1/SLC47A1 and MATE2-K/ SLC47A2) (Sato et al., 2008; Tsuda et al., 2009a,b; Ito et al., 2012). In addition to OCT2, MATE1, and MATE2-K, metformin is also a sub-strate of OCT1 (SLC22A1) and the plasma membrane monoamine transporter (PMAT). OCT1 is predominantly expressed in the liver but also has been reported to be expressed on the apical side of both the proximal and distal tubules in the kidney (Tzvetkov et al., 2009). PMAT (SLC29A4) is expressed on the apical membrane of intestinal epithelial cells and has been suggested to be involved in intestinal absorption of metformin (Zhou et al., 2007). Finally, metformin crosses the placenta via active transport. OCT3 is expressed on the basal (fetal-facing) membrane of the syncytiotrophoblasts in the placenta and transports metformin into the fetal circulation (Lee et al., 2018). Umbilical cord concentrations of metformin at the time of delivery have been reported to be 50% to exceeding maternal concentrations in some cases (Hague et al., 2003; Vanky et al., 2005; Charles et al., 2006). Glyburide has not been reported to interact with metformin, impair renal filtration, or alter any of the drug transporters involved with metformin disposition.
Preliminary data suggest that the pharmacokinetics of metformin are altered by pregnancy (Eyal et al., 2010). The primary objective of this study was to fully characterize the pharmacokinetics of metformin in pregnant women with GDM as compared with nonpregnant women with T2DM.
Materials and Methods
This was a multicenter, prospective, randomized phase I–II PK study (clinicaltrials.gov identifier NCT01329016). We examined the time course of orally administered steady-state metformin in the plasma of pregnant women with GDM receiving either metformin monotherapy (n524) or a combination with
glyburide (n530) as well as metformin monotherapy in nonpregnant women with T2DM (n 524). The primary endpoint and full study design will be published elsewhere. The study was approved by the institutional review boards at the University of Washington, Madigan Army Medical Center, University of Texas Medical Branch in Galveston, University of Pittsburgh, Indiana University, University of Utah Health Care, University of Alabama at Birmingham, and RTI International and conducted in accordance with their guidelines. All subjects gave written informed consent.
Subjects
GDM.Women 18–45 years of age with singleton pregnancies were included after receiving a diagnosis of GDM based on either a 1-hour glucose tolerance test (50 g).185 mg/dl, 2-hour oral glucose tolerance test (75 g) with one or more values meeting or exceeding the International Association of Diabetes and Pregnancy Study Groups Consensus Panel Guidelines (Sugawara et al., 2005), or 3-hour oral glucose tolerance test (100 g) with two or more values meeting or exceeding Carpenter and Coustan designations (Carpenter and Coustan, 1982) and failure to achieve glycemic control with dietary therapy. Women were excluded if they were taking medications expected to interact with metformin or alter blood glucose concentrations or had any of the following: serum creatinine
.1.2 mg/dl, hematocrit,28%, allergy to metformin, significant hepatic disease, congestive heart failure, history of myocardial infarction, moderate to severe pulmonary disease, adrenal insufficiency, or pituitary insufficiency.
T2DM.Nonpregnant female subjects with T2DM 18–45 years of age who were receiving metformin were included in the study. Thirteen nonpregnant subjects were included based on the above criteria. In addition, we included 11 female, nonpregnant 24–44-year-old subjects with T2DM from another similar study in which subjects received the same formulation of metformin and underwent the same steady-state metformin pharmacokinetic sample collections described below (Eyal et al., 2010). Subjects were excluded for serum creatinine
.1.2 mg/dl and hematocrit,28%.
Dosing Regimen
Subjects with GDM were randomized after diagnosis but prior to 33 weeks gestation to metformin monotherapy, glyburide monotherapy, or metformin and glyburide combination therapy. Results from the glyburide monotherapy group are not reported in this paper. Metformin dosage was initiated at 500 or 1000 mg orally twice daily and titrated based on clinical need. Metformin immediate-release tablets were provided by the investigators for treatment of subjects with GDM and for the 3 days prior to the PK study for nonpregnant subjects with T2DM. Subjects with T2DM were not randomized to treatment. Rather, they received metformin for therapeutic reasons, and dosages were titrated without regard to the study. Subjects recorded on a calendar the time each metformin dose was taken for the 3 days prior to the pharmacokinetic study day, and pill counts were performed to assess adherence. Except for clear liquids, subjects fasted for$5 hours prior to study drug administration on the PK study day. Metformin was administered simultaneously with the initiation of a standardized meal containing two slices of whole-wheat toast, two teaspoons margarine, and 240 ml Boost Plus consumed within 10 minutes.
Sample Collection
On the day of the metformin PK study, serial blood samples were collected as follows: predose, then 0.5, 1, 1.5, 2, 2.5, 3, 4, 5, 6, 8, 10, and 12 hours postdose, truncated to the dosing interval for measurement of metformin plasma concen-trations. Urine was collected in 4-hour intervals as follows: predose and then 0–4, 4–8, and 8–12 hours postdosing, truncated to the dosing interval. When possible, maternal as well as umbilical cord venous and arterial blood samples were collected at the time of delivery for measurement of plasma metformin concentrations. Blood samples were collected in heparinized tubes, and plasma was isolated by centrifugation and stored at280C until analysis. Urine was refrigerated until completion of the collection interval then stored at280C until analysis.
Plasma and Urine Metformin Analysis
Metformin plasma and urine concentrations were measured utilizing a validated liquid chromatography with tandem mass spectrometry assay as previously described (Zhang et al., 2015). The lower limits of quantitation were 4.95 ng/ml for plasma and 30mg/ml for urine. For plasma, the coefficients of variation for this method were 2.6%–11.9% for intraday and 2.1%–6.4% for interday, and accuracy was 96%–100%. For urine, the CV for this method was,14% for intraday and interday, and accuracy was 94%–105%.
Genotyping
DNA was isolated from whole blood, and genotypes were determined using validated TaqMan assays. Maternal and umbilical cord samples were
assayed for OCT1: SLC22A1 (rs622342); OCT2: SLC22A2c.808G.T
polymorphism (rs316019); MATE1: SLC47A1 (rs2289668 and rs8065082); MATE2-K: -130G.A polymorphism (rs12943590); and PMAT (rs2685753 and rs6971788).
Steady-State Pharmacokinetics Analysis
Steady-state metformin PK parameters were estimated using standard non-compartmental techniques. Maximum concentration and time to maximum concentration (Tmax) were determined from the measured concentrations. AUC was estimated using the linear trapezoidal rule. When concentrations fell below the lower limit of quantification for the assay prior to the end of the dosing interval, the concentration at the end of the dosing interval was estimated by extrapolating the predicted concentration based on the regression line from the time of the last measurable concentration (Clast) with the elimination rate constant (k) using Cend of dosing interval5Clast•e2kt, in which t was the time between Clast and the end of the dosing interval. The elimination rate constant, k, was determined by log-linear regression of the terminal slope. Apparent oral clear-ance (CL/F) was estimated by CL/F5dose/AUC. Apparent oral volume of distribution beta (Vb/F) was estimated by Vb/F5(CL/F)/kelim. Half-life (T1/2) was estimated by T1/25ln(2)/k over a period of;2 half-lives. Renal clearance (CLR) was determined with amount of metformin excreted in the urine unchanged (Ae) by Ae/AUC. Metformin net renal secretion clearance (CLsec) was estimated with creatinine clearance (CrCL) by CLsec5CLR2(fuCrCL), in which fu was the unbound fraction of metformin in plasma and was assumed to be 1 (Scheen, 1996). Creatinine clearance was estimated by CrCL5[(Uv)(UCr)]/[(SCr)(time)], where Uv5urine volume, UCr5urine creatinine, and SCr5serum creatinine. The percent of dose recovered in the urine was determined by Ae/dose100. Metformin is not metabolized, has negligible biliary excretion, and is eliminated exclusively by the kidneys (Pentikäinen et al., 1979). A study reported that an intravenous dose of radiolabeled metformin was completely recovered from urine over 48 hours with no radioactivity found in feces (Pentikäinen et al., 1979). Therefore, for metformin, it is acceptable to estimate bioavailability (F) by F5Ae/ dose (Beckmann, 1969; Pentikäinen et al., 1979; Sambol et al., 1996a; Gong et al., 2012; Zamek-Gliszczynski et al., 2013). Volume of distribution beta (Vb) and CL
were estimated by Vb5(Vb/F)F and CL5(CL/F)F. Pharmacokinetic
parameters were adjusted based on actual body weights.
Statistical Analysis
Mann-Whitney test was used to compare PK parameters for monotherapy versus combination therapy for 500- and 1000-mg doses separately, compare all 500-mg doses with all 1000-mg doses, and compare PK parameters in pregnant with nonpregnant subjects for 500- and 1000-mg doses separately. Results are reported as mean 6S.D. for the above analyses. In addition, all data were combined (all subjects and all doses), and the effects of pregnancy were assessed using the linear mixed effects model controlling for random effects of dose and weight of individuals and then compared by ANOVA. These results are reported as mean6S.E.M.P#0.05 was considered significant.
Results
Fifty-seven subjects with GDM at 26–38 weeks gestation (27 White, 19 Hispanic/Latina, one Native American, eight Black, and two Asian) and 24 nonpregnant subjects with T2DM (eight White, nine Hispanic/ Latina, one Native American, five Black, and one Asian) participated in
this study. Metformin daily doses ranged from 1000 to 2000 mg/day in two divided doses, with the exception of four subjects who were taking metformin three times per day. We were unable to determine half-life and apparent oral volume of distribution in three subjects with GDM and one subject with T2DM because of termination of sample collection prior to reaching the terminal elimination phase.
Figure 1 depicts mean steady-state metformin concentration-time profiles in pregnant women with GDM and in nonpregnant women with T2DM receiving 500 mg orally twice daily. Estimated steady-state metformin PK parameters for pregnant women with GDM and non-pregnant women with T2DM are reported in Table 1. For both 500- and 1000-mg doses, respectively, pregnancy significantly increased metfor-min bioavailability (P,0.01,P,0.01), Vb(P,0.001,P,0.005), weight-normalized Vb(P,0.005,P,0.005), CL (P,0.01,P,0.05), weight-normalized CL (P,0.01,P,0.05), percent of dose excreted unchanged in urine (P,0.01,P,0.01), CLR(P,0.01,P,0.05), and weight-normalized CLR (P , 0.01, P , 0.05) as well as creatinine clearance (P,0.001,P,0.001). Pregnancy also significantly increased metformin Tmax(P,0.01), Vb/F (P,0.05), CL/F (P,0.05), and weight-normalized CLsec (P , 0.05) for women receiving 500 mg. However, Vb/F, CL/F, and CLsecwere not significantly different in pregnant subjects when compared with nonpregnant subjects for those women receiving 1000-mg doses. Half-life of metformin for both 500 and 1000 mg was not significantly altered during pregnancy.
All data were combined (all subjects and all doses), and the effects of pregnancy were assessed using the linear mixed effects model controlling for random effects of dose and subjects’ weight and then compared by ANOVA. Multiple PK parameters were found to be significantly altered by pregnancy. The presence of the pregnancy factor corresponded to a significant increase of 0.1660.04 for bioavailability (x2512.1,P50.0005), 193669 ml/min (x257.35,P50.006) for clearance, 77 6 18 l (x2 5 15.36, P 5 9*1025) for volume of distribution, and 193669 ml/min for renal clearance (x257.35,
P 5 0.006) of metformin. Pregnancy also significantly increased creatinine clearance by 716 14 ml/min (x25 22.2,P5 2*1026). There was a trend toward an increase in metformin renal secretion clearance during pregnancy (121663 ml/min,x253.55,P50.06). When using the linear mixed effects model controlling for random effects, pregnancy did not significantly alter half-life, time to maximum concentration, apparent oral volume of distribution, or apparent oral clearance.
As expected, Fig. 2 shows that mean steady-state metformin oral concentration-time profiles are lower in pregnant women with GDM receiving 500 mg twice daily versus 1000 mg twice daily. Metformin PK
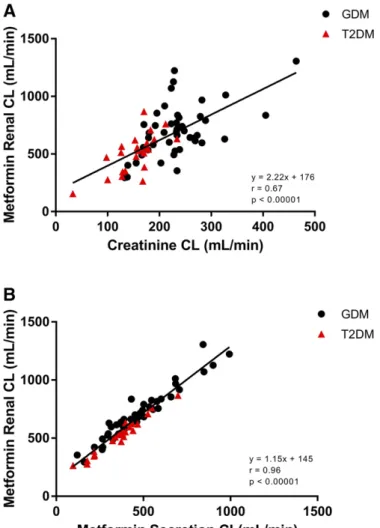
parameters during pregnancy comparing 500–1000 mg doses were dose-dependent. Doubling the dose increased Vb/F by 22% (3686133 L vs. 4506136 l,P,0.02), weight-adjusted Vb/F by 25% (4.061.7 l/kg vs. 5.061.6 l/kg,P,0.006), CL/F by 29% (10856328 ml/min vs. 1405 6 384 ml/min, P , 0.02), and weight-adjusted CL/F by 33% (11.76 3.8 ml/min per kilogram vs. 15.6 64.5 ml/min per kilogram,P,0.02). Half-life, bioavailability, maximum concentration, CL, Vb, percent of dose excreted unchanged in urine, CLR, and CLsecwere not significantly changed. Coadministration of metformin with glyburide did not alter the estimated metformin PK parameters (unpublished data). In both pregnant women with GDM and nonpregnant women with T2DM, metformin renal clearance had a moderate correlation with creatinine clearance (Fig. 3A:r50.67,P,0.0001) and an excellent correlation with renal secretion clearance (Fig. 3B:r50.96,P,0.0001). Metformin renal secretion clearance had a weaker correlation with creatinine clearance (r50.41,P,0.001) (unpublished data). Metformin apparent oral clearance poorly correlated with CrCL (r50.18,P50.06) (unpublished data).
Out of 38 umbilical cord plasma samples collected, 14 arterial and 11 venous metformin concentrations were below the lower limit of
quantification. Mean duration from last maternal dose to time of sample collection was 19 6 7.8 hours (range: 5.5–37.3 hours). The mean measurable metformin plasma concentrations in the umbilical cord arterial and venous samples were 2906233 (range: 13–910 ng/ml) and 331 6 257 ng/ml (range: 11–1070 ng/ml), respectively. The mean maternal metformin plasma concentration was 2626231 ng/ml (range: 6–1020 ng/ml). The mean metformin umbilical cord arterial-to-venous plasma concentration ratio was 1.0 6 0.1. The mean metformin umbilical cord arterial-to-maternal plasma concentration ratio was 1.5 60.5 and umbilical cord venous-to-maternal concentration ratio was 1.4 60.5. Figure 4 depicts the relationship between time post–last dose and metformin umbilical cord-to-maternal plasma concentration ratios (r50.3,P50.1).
Genotype for various relevant metformin drug transporters was determined. OCT1: SLC22A1 (rs622342); OCT2: SLC22A2c.808G.T polymorphism (rs316019); MATE1: SLC47A1 (rs2289668 and rs8065082); MATE2-K: -130G.A polymorphism (rs12943590); and PMAT (rs2685753 and rs6971788) were not significantly associated with metformin AUC, CL/F, CL, CLsec, bioavailability, or umbilical cord-to-maternal plasma concentration ratio.
Discussion
Pregnancy has been reported to alter the PK of many drugs, including metformin (Anderson, 2005; Isoherranen and Thummel, 2013; Cos-tantine, 2014). PK changes during pregnancy are challenging to predict. Pregnancy alters gastric emptying, intestinal transit, organ blood flow, blood volume, protein binding, body composition, drug-metabolizing enzymes, and drug transporters expressions, which can influence the overall drug exposure (Anderson, 2005; Isoherranen and Thummel, 2013). The current study rigorously evaluates metformin PK during pregnancy in women with GDM and nonpregnant women with T2DM and provides mechanistic insight into differences.
Metformin (500 mg) is eliminated almost exclusively by the kidneys (Pentikäinen et al., 1979). It is not metabolized, and biliary excretion is negligible in humans (Graham et al., 2011; Gong et al., 2012; Zamek-Gliszczynski et al., 2013). Therefore, the ratio of Ae/dose is a reasonable 500 mg Pregnant
(n539)
500 mg Nonpregnant
(n59)
PValue 1000 mg Pregnant (n515)
1000 mg Nonpregnant
(n514)
PValue
Metformin
F 0.6460.2 0.4960.08 ,0.01 0.5360.11 0.3760.14 ,0.01
Half-life (h) 4.261.1 4.060.8 0.4 4.360.7 3.760.6 0.2
Tmax (h) 2.661.3 2.160.5 ,0.01 2.461.1 2.261.3 0.7
VB/F (l) 3686133 276652 ,0.05 4506136 4866207 0.6
VB/F (l/kg) 4.0061.68 3.1961.10 0.08 4.9961.64 5.0062.07 0.9
VB(l) 2426138 134623 ,0.001 234666 163648 ,0.005
VB(l/kg) 2.661.6 1.560.3 ,0.005 2.660.9 1.760.6 ,0.005
CL/F (ml/min) 10856328 8546230 ,0.05 14056384 16786574 0.4
CL/F (ml/min per kilogram) 11.763.8 9.562.4 0.05 15.664.5 17.566.5 0.3
CL (ml/min) 7316339 4446121 ,0.01 7586179 5726153 ,0.05
CL (ml/min per kilogram) 7.963.9 4.961.3 ,0.01 8.562.5 6.162.4 ,0.05
Percent of dose recovered in the urine unchanged (%)
64620 4968 ,0.01 53611 37614 ,0.01
CLR(ml/min) 7316339 4446121 ,0.01 7586179 5726153 ,0.05
CLR(ml/min per kilogram) 7.963.9 4.961.3 ,0.01 8.562.5 6.162.4 ,0.05
CrCL (ml/min) 233668 148641 ,0.001 233646 166625 ,0.001
CLsec(ml/min) 4976312 296697 0.06 5306168 4066143 0.1
CLsec(ml/min per kilogram) 5.463.6 3.361.1 ,0.05 5.962.3 4.362.0 0.2
Fig. 2. Mean (error bar S.D.) steady-state metformin concentration-time curves for pregnant women receiving 500 mg orally twice daily (n539) and 1000 mg orally twice daily (n515). Circles indicate concentration with the 500 mg cohort, and squares indicate concentration with the 1000 mg cohort.
TABLE1
Estimatedmetforminsteady-statepharmacokineticparametersforpregnantwomenwithGDMandnonpregnantwomenwithT2DM separatedbydose
estimate of bioavailability (Beckmann, 1969; Pentikäinen et al., 1979; Tucker et al., 1981; Sambol et al., 1996a). We found that metformin bioavailability was significantly higher in pregnant women with GDM compared with nonpregnant women with T2DM. The increase in progesterone during pregnancy prolongs small intestine transit time, which can increase absorption of metformin (Loebstein et al., 1997; Marathe et al., 2000; Dawes and Chowienczyk, 2001; Costantine, 2014). Higher metformin bioavailability has also been reported with propanthe-line, a drug that slows gastrointestinal motility (Marathe et al., 2000).
Higher bioavailability of metformin during pregnancy might also occur because of upregulation of the uptake transporter processes in the intestine. Currently, the molecular mechanism underlying metformin intestinal absorption is not well-understood. Studies in the Caco-2 monolayer culture model suggest that metformin uptake involves multiple transporters, including OCT1 and PMAT (Han et al., 2015). The effect of pregnancy on the expression of these transporters is not known. Limited information is available on xenobiotic absorption during pregnancy; however, increased intestinal absorption of dietary micronutrients is well-documented. In human and animal pregnancy, there is a 2-fold increase in the intestinal absorption of calcium mediated by increases in 1,25-dihydroxyvitamin D and other mechanisms (Kovacs and Kronenberg, 1997). Intestinal absorption of dietary iron
also increases during the second and third trimesters of pregnancy to accommodate for the need to expand red blood cell mass (Food and Nutrition Board, Institute of Medicine, 2001). Absorption of dietary zinc and vitamin B12also increase during pregnancy (Hellegers et al., 1957; Donangelo et al., 2005; Donangelo and King, 2012).
Our study demonstrates that metformin clearance and weight-adjusted clearance were significantly higher during pregnancy. This is driven by changes in metformin renal clearance. Renal clearance was significantly higher during pregnancy and consistent with that previously reported by Eyal et al. (2010). The pregnancy-related changes in renal clearance appear to be largely influenced by increased active renal transport. Figure 3B illustrates the strong correlation between metformin renal clearance and net renal secretion clearance (r50.96,P,0.0001). The strong correlation was expected because net renal secretion clearance makes up approximately two-thirds of metformin renal clearance. Metformin active renal tubular transport has been reported to be mediated by organic cation transporters and multidrug and toxin extrusion proteins (Davison and Dunlop, 1980; Song et al., 2008; Wang et al., 2008; Becker et al., 2009; Chen et al., 2009; Cheung and Lafayette, 2013). Metformin is a substrate for multiple OCTs, including OCT1, OCT2, OCT3, PMAT, and MATEs. In humans, OCT2 and MATEs play a major role in metformin renal clearance (Davison and Dunlop, 1980; Song et al., 2008; Wang et al., 2008; Becker et al., 2009; Chen et al., 2009; Ito et al., 2012; Cheung and Lafayette, 2013). Several studies in vitro and in animals suggest that Oct2 expression and activity in the kidney are regulated by steroidal hormones (Shu et al., 2001; Lee et al., 2013; Han et al., 2015). In addition, it has been suggested that epigenetics may play a role in OCT2 expression and variability in the placenta (Saito et al., 2011). However, little is known about OCT2 regulation in human pregnancy. The mechanism for increased apparent OCT2 activity during pregnancy warrants further study.
Metformin CLR is also influenced by renal filtration. Figure 3A demonstrates the relationship between metformin CLRand CrCL (r5
0.67,P,0.0001). The correlation between metformin CLRand CrCL is not as strong as that seen with net CLseclikely because of the major role active transport plays in metformin CLR. Previous work reported as much as a 40% increase in glomerular filtration rate and 10%–35% increase in renal blood flow during pregnancy (Cheung and Lafayette, 2013). This is consistent with the higher CrCL (P,0.00002) and metformin CLRreported here.
In contrast to the PK changes reported in this study, Charles et al. (2006) utilizing a population PK approach found no change in metformin clearance during late pregnancy compared with nonpregnant Fig. 3. (A) Correlation between creatinine clearance and metformin renal clearance
in pregnant women with GDM (solid circles) and nonpregnant women with T2DM (solid triangles) taking metformin 500 and 1000 mg orally twice daily. (B). Correlation between metformin renal clearance and renal secretion clearance in pregnant women with GDM (solid circles) and nonpregnant women with T2DM (solid triangles) taking metformin 500 and 1000 mg orally twice daily (n568).
patients. They used sparse sampling, with a median of two plasma samples per patient, and fixed the bioavailability at 0.5. Their approach likely contributed to the discrepancy in results. Hughes et al. (2006) also conducted a study to evaluate the pharmacokinetics of metformin in pregnancy and postpartum; however, they only studied seven subjects. Of those seven subjects taking metformin every 12 hours, four were studied for 8 hours and three for only 4 hours. This approach did not allow estimation of any PK parameters except a truncated AUC.
CL/F was significantly (27%) higher in pregnant women than the nonpregnant women who received a 500-mg dose. A higher CL/F will result in lower systemic metformin exposure during pregnancy than expected for a nonpregnant woman, potentially necessitating an in-creased dose for the desired pharmacological effect. However, this was not the case for women who received a 1000-mg dose. The higher metformin bioavailability during pregnancy offset the increase in metformin CL, leading to no significant change in CL/F in patients receiving 1000 mg of metformin. In a pilot study, Eyal et al. (2010) found no significant change in CL/F during pregnancy, but this was a smaller study, and dose-based PK parameters were not estimated. In a study by de Oliveira Baraldi et al. (2012), the PK of metformin was studied in eight pregnant women with polycystic ovary syndrome and nine pregnant women with type 2 diabetes mellitus receiving metformin 850 mg orally every 12 hours. Their CL/F values were similar to our data during pregnancy with the 1000-mg dose. They did not report on the effect of dosage or pregnancy on metformin PK.
It has been previously reported that low functional OCT1 was associated with lower metformin CL/F (Shu et al., 2008). Decreased activity of OCT2 has been reported to decrease metformin CLRand CLsec30%–60% and increase AUC up to 74% (Song et al., 2008; Wang et al., 2008; Chen et al., 2009). Others have reported that MATE1 and MATE2-K are important for renal excretion (Sato et al., 2008; Tsuda et al., 2009a,b; Ito et al., 2012) and PMAT for reabsorption of metformin (Xia et al., 2007). In contrast to previous pharmacogenetics studies in nonpregnant subjects described above that demonstrated differences in metformin PK based on genotype (n526–208), we found no significant association between OCT1, OCT2, MATE1, MATE2-K, or PMAT genotype and metformin AUC, CL/F, CL, CLsec, bioavailability, or umbilical cord-to-maternal plasma concentration ratio in our 77 pregnant women. Similarly, Duong et al. (2013) found no significant relationship between OCTs, MATEs, and PMAT gene variant and CL/F or AUC (n557). The limited number of patients in this study and the potential confounding factor of pregnancy may have masked any genetic effect. Metformin Vbwas significantly higher during pregnancy (P,0.001). The presence of the fetus and placenta as well as the increase in total body water can increase the volume of distribution of hydrophilic drugs, such as metformin, and is likely the reason for the higher metformin Vbduring pregnancy. Vb/F was significantly higher in pregnant women receiving the 500-mg dose; however, the higher bioavailability during pregnancy offset the higher Vbleading to no significant change in Vb/F for pregnant women taking 1000 mg. The Vb/F in our study was similar to that reported by Eyal et al. (2010) during late pregnancy (4326168 l) and de Oliveira Baraldi et al. (2012) (T2DM: 491 l; range 419–798 l) but lower than that reported by de Oliveira Baraldi et al. (2011) (551 l; range 385–1173 l and polycystic ovary syndrome: 551 l; range 406–1037 l) (de Oliveira Baraldi et al., 2012). In addition, the weight-normalized Vb/F was comparable to that previously reported during late pregnancy by Eyal et al. (2010) (4.06 1.5 l/kg). Lastly, the Vb/F in our nonpregnant patients with T2DM was similar to that reported by Sambol et al. (1996b) in nonpregnant healthy volunteers (367642 l).
Our current study demonstrated that increasing the metformin dose from 500 to 1000 mg during pregnancy increased the CL/F and Vb/F
(P , 0.02,P, 0.02, respectively). This observation appears to be driven primarily by the trend toward higher bioavailability with the 500-mg dose and minor differences in clearance and volume. A decrease in bioavailability with increasing dose was also observed in the nonpregnant population reported elsewhere (Tucker et al., 1981). Tucker et al. (1981) reported that the bioavailability of a 1500-mg dose of metformin was 9%–24% lower than with a 500-mg dose (n54). Sambol et al. (1996a) found that an 850-mg dose of metformin had a bioavailability that was 12% lower than with a 500-mg dose. These data are consistent with metformin having capacity limited absorption. Although not reaching significance, our current study found a trend toward a lower metformin bio-availability with 1000-mg doses than with 500-mg (P50.1) doses during pregnancy. Metformin is highly water-soluble, therefore, solubility is unlikely to be a factor in bioavailability dose dispropor-tionality. In addition, metformin is largely ionized in the gastrointes-tinal tract, which limits its permeability. Higher doses of metformin may saturate the uptake transporters in the enterocytes, which would lead to decreased absorption and bioavailability with higher doses (Proctor et al., 2008).
Metformin half-life in our study was consistent with that previously reported in other steady-state pharmacokinetic studies (de Oliveira Baraldi et al., 2011, 2012). However, since these women were taking metformin for therapeutic reasons, sampling duration was limited to the dosing interval. Steady-state dosing is well-suited to demonstrate the impact of a prolonged terminal half-life on drug exposure (AUC) but limits the duration for sampling after dosing. Although our study design did allow for rigorous estimation of the half-life during the dosing interval with concentrations falling over;2 half-lives in the elimination portion of the curve, it did not allow for estimation of the very prolonged half-life that has been reported by Sambol et al. (1996a) between 12 and 48 hours after discontinuation of the drug.
Metformin umbilical cord-to-maternal plasma concentration ratios range from 0.7 to 2.8, consistent with previous reports (Vanky et al., 2005; Eyal et al., 2010; de Oliveira Baraldi et al., 2011). Given metformin’s water solubility, it does not easily diffuse across membranes, suggesting active transport of metformin from the maternal to the fetal side. Metformin is a substrate for the serotonin transporter and OCT3 (Rubinchik-Stern and Eyal, 2012; Han et al., 2015), which are expressed in human placenta (Lee et al., 2018). In addition, metformin plasma umbilical cord arterial-to-venous con-centration ratio centered around 1 (r50.1), which is consistent with insignificant fetal extraction of metformin. Similar results were reported by de Oliveira Baraldi et al. (2011).
In conclusion, pregnancy significantly increases the F, CL, and Vb of metformin. With lower doses, pregnancy also increases the CL/F of metformin, suggesting that higher initial doses might be needed in pregnant women. However, with higher doses, the changes in F during pregnancy offset the changes in CL and Vbleading to no significant change in CL/F and systemic exposure. In addition, we have demonstrated the nonlinearity of metformin pharmacokinetics during pregnancy, with a higher CL/F with higher metformin doses. This finding appears to be primarily driven by the trend toward lower F with higher metformin doses.
Acknowledgments
Authorship Contributions
Participated in research design:Wang, Thummel, Easterling, Hebert.
Conducted experiments:Flood Nichols, Clark, Hankins, Caritis, Venkatar-amanan, Haas, Haneline, Tita, Manuck, Brown, Ren, Easterling, Hebert.
Contributed new reagents or analysis tools:Ahmed, Quinney.
Performed data analysis:Liao, Hebert.
Wrote or contributed to the writing of the manuscript:Liao, Flood Nichols, Ahmed, Clark, Hankins, Caritis, Venkataramanan, Haas, Quinney, Haneline, Tita, Manuck, Wang, Thummel, Brown, Ren, Easterling, Hebert.
References
Anderson GD (2005) Pregnancy-induced changes in pharmacokinetics: a mechanistic-based ap-proach.Clin Pharmacokinet44:989–1008.
Becker ML, Visser LE, van Schaik RH, Hofman A, Uitterlinden AG, and Stricker BH (2009) Genetic variation in the multidrug and toxin extrusion 1 transporter protein influences the glucose-lowering effect of metformin in patients with diabetes: a preliminary study.Diabetes58: 745–749.
Beckmann R (1969) [Absorption, distribution in the organism and elimination of metformin]. Diabetologia5:318–324.
Blackhall FH, O’Brien M, Schmid P, Nicolson M, Taylor P, Milenkova T, Kennedy SJ, and Thatcher N (2010) A phase I study of Vandetanib in combination with vinorelbine/cisplatin or gemcitabine/cisplatin as first-line treatment for advanced non-small cell lung cancer.J Thorac Oncol5:1285–1288.
Bryson CL, Ioannou GN, Rulyak SJ, and Critchlow C (2003) Association between gestational diabetes and pregnancy-induced hypertension.Am J Epidemiol158:1148–1153.
Carpenter MW and Coustan DR (1982) Criteria for screening tests for gestational diabetes.Am J Obstet Gynecol144:768–773.
Charles B, Norris R, Xiao X, and Hague W (2006) Population pharmacokinetics of metformin in late pregnancy.Ther Drug Monit28:67–72.
Chen Y, Li S, Brown C, Cheatham S, Castro RA, Leabman MK, Urban TJ, Chen L, Yee SW, Choi JH, et al. (2009) Effect of genetic variation in the organic cation transporter 2 on the renal elimination of metformin.Pharmacogenet Genomics19:497–504.
Cheung KL and Lafayette RA (2013) Renal physiology of pregnancy.Adv Chronic Kidney Dis20: 209–214.
Costantine MM (2014) Physiologic and pharmacokinetic changes in pregnancy.Front Pharmacol 5:65.
Dabelea D and Crume T (2011) Maternal environment and the transgenerational cycle of obesity and diabetes.Diabetes60:1849–1855.
Davison JM and Dunlop W (1980) Renal hemodynamics and tubular function normal human pregnancy.Kidney Int18:152–161.
Dawes M and Chowienczyk PJ (2001) Drugs in pregnancy. Pharmacokinetics in pregnancy.Best Pract Res Clin Obstet Gynaecol15:819–826.
de Oliveira Baraldi C, Lanchote VL, de Jesus Antunes N, de Jesus Ponte Carvalho TM, Dantas Moisés EC, Duarte G, and Cavalli RC (2011) Metformin pharmacokinetics in nondiabetic pregnant women with polycystic ovary syndrome [published correction appears inEur J Clin Pharmacol(2012) 68:329].Eur J Clin Pharmacol67:1027–1033.
de Oliveira Baraldi C, Moisés ECD, de Jesus Ponte Carvalho TM, de Jesus Antunes N, Lanchote VL, Duarte G, and Cavalli RC (2012) Effect of type 2 diabetes mellitus on the pharmacokinetics of metformin in obese pregnant women.Clin Pharmacokinet 51: 743–749.
DeFronzo RA (1999) Pharmacologic therapy for type 2 diabetes mellitus.Ann Intern Med131: 281–303.
Donangelo CM and King JC (2012) Maternal zinc intakes and homeostatic adjustments during pregnancy and lactation.Nutrients4:782–798.
Donangelo CM, Zapata CL, Woodhouse LR, Shames DM, Mukherjea R, and King JC (2005) Zinc absorption and kinetics during pregnancy and lactation in Brazilian women.Am J Clin Nutr82: 118–124.
Dumitras S, Sechaud R, Drollmann A, Pal P, Vaidyanathan S, Camenisch G, and Kaiser G (2013) Effect of cimetidine, a model drug for inhibition of the organic cation transport (OCT2/MATE1) in the kidney, on the pharmacokinetics of glycopyrronium.Int J Clin Pharmacol Ther51: 771–779.
Duong JK, Kumar SS, Kirkpatrick CM, Greenup LC, Arora M, Lee TC, Timmins P, Graham GG, Furlong TJ, Greenfield JR, et al. (2013) Population pharmacokinetics of metformin in healthy subjects and patients with type 2 diabetes mellitus: simulation of doses according to renal function.Clin Pharmacokinet52:373–384.
Eyal S, Easterling TR, Carr D, Umans JG, Miodovnik M, Hankins GD, Clark SM, Risler L, Wang J, Kelly EJ, et al. (2010) Pharmacokinetics of metformin during pregnancy.Drug Metab Dispos 38:833–840.
Food and Nutrition Board, Institute of Medicine (2001) Iron,Dietary Reference Intakes for Vitamin A, Vitamin K, Arsenic, boron, Chromium, Copper, Iodine, Iron, Manganese, Molybdenum, Nickel, Silicon, Vanadium, and Zincpp 290–393, National Academies Press, Washington, DC. Gong L, Goswami S, Giacomini KM, Altman RB, and Klein TE (2012) Metformin pathways:
pharmacokinetics and pharmacodynamics.Pharmacogenet Genomics22:820–827. Graham GG, Punt J, Arora M, Day RO, Doogue MP, Duong JK, Furlong TJ, Greenfield JR,
Greenup LC, Kirkpatrick CM, et al. (2011) Clinical pharmacokinetics of metformin.Clin Pharmacokinet50:81–98.
Hague WM, Davoren PM, McIntyre D, Norris R, Xiaonian X, and Charles B (2003) Metformin crosses the placenta: a modular for fetal insulin resistance (Letter)?BMJ 327:880–881.
Han TK, Proctor WR, Costales CL, Cai H, Everett RS, and Thakker DR (2015) Four cation-selective transporters contribute to apical uptake and accumulation of metformin in Caco-2 cell monolayers.J Pharmacol Exp Ther352:519–528.
Hellegers A, Okuda K, Nesbitt REL Jr., Smith DW, and Chow BF (1957) Vitamin B12 absorption in pregnancy and in the newborn.Am J Clin Nutr5:327–331.
Hughes RCE, Gardiner SJ, Begg EJ, and Zhang M (2006) Effect of pregnancy on the pharma-cokinetics of metformin.Diabet Med23:323–326.
Hunt KJ and Schuller KL (2007) The increasing prevalence of diabetes in pregnancy.Obstet Gynecol Clin North Am34:173–199, vii.
Isoherranen N and Thummel KE (2013) Drug metabolism and transport during pregnancy: how does drug disposition change during pregnancy and what are the mechanisms that cause such changes?Drug Metab Dispos41:256–262.
Ito S, Kusuhara H, Yokochi M, Toyoshima J, Inoue K, Yuasa H, and Sugiyama Y (2012) Competitive inhibition of the luminal efflux by multidrug and toxin extrusions, but not basolateral uptake by organic cation transporter 2, is the likely mechanism underlying the pharmacokinetic drug-drug interactions caused by cimetidine in the kidney.J Pharmacol Exp Ther340:393–403.
Kimura N, Okuda M, and Inui K (2005) Metformin transport by renal basolateral organic cation transporter hOCT2.Pharm Res22:255–259.
Kitzmiller JL, Dang-Kilduff L, and Taslimi MM (2007) Gestational diabetes after delivery. Short-term management and long-Short-term risks.Diabetes Care30(Suppl 2):S225–S235.
Kovacs CS and Kronenberg HM (1997) Maternal-fetal calcium and bone metabolism during pregnancy, puerperium, and lactation.Endocr Rev18:832–872.
Lee N, Hebert MF, Prasad B, Easterling TR, Kelly EJ, Unadkat JD, and Wang J (2013) Effect of gestational age on mRNA and protein expression of polyspecific organic cation transporters during pregnancy.Drug Metab Dispos41:2225–2232.
Lee N, Hebert MF, Wagner DJ, Easterling TR, Liang CJ, Rice K, and Wang J (2018) Organic cation transporter 3 facilitates fetal exposure to metformin during pregnancy.Mol Pharmacol94: 1125–1131.
Loebstein R, Lalkin A, and Koren G (1997) Pharmacokinetic changes during pregnancy and their clinical relevance.Clin Pharmacokinet33:328–343.
Marathe PH, Wen Y, Norton J, Greene DS, Barbhaiya RH, and Wilding IR (2000) Effect of altered gastric emptying and gastrointestinal motility on metformin absorption.Br J Clin Pharmacol50: 325–332.
Pentikäinen PJ, Neuvonen PJ, and Penttilä A (1979) Pharmacokinetics of metformin after in-travenous and oral administration to man.Eur J Clin Pharmacol16:195–202.
Proctor WR, Bourdet DL, and Thakker DR (2008) Mechanisms underlying saturable intestinal absorption of metformin.Drug Metab Dispos36:1650–1658.
Reece EA (2010) The fetal and maternal consequences of gestational diabetes mellitus.J Matern Fetal Neonatal Med23:199–203.
Rubinchik-Stern M and Eyal S (2012) Drug interactions at the human placenta: what is the evidence?Front Pharmacol3:126.
Saito J, Hirota T, Kikunaga N, Otsubo K, and Ieiri I (2011) Interindividual differences in placental expression of the SLC22A2 (OCT2) gene: relationship to epigenetic variations in the 59 -upstream regulatory region.J Pharm Sci100:3875–3883.
Sambol NC, Brookes LG, Chiang J, Goodman AM, Lin ET, Liu CY, and Benet LZ (1996a) Food intake and dosage level, but not tablet vs solution dosage form, affect the absorption of met-formin HCl in man.Br J Clin Pharmacol42:510–512.
Sambol NC, Chiang J, O’Conner M, Liu CY, Lin ET, Goodman AM, Benet LZ, and Karam JH (1996b) Pharmacokinetics and pharmacodynamics of metformin in healthy subjects and patients with noninsulin-dependent diabetes mellitus. J Clin Pharmacol 36: 1012–1021.
Sato T, Masuda S, Yonezawa A, Tanihara Y, Katsura T, and Inui K (2008) Transcellular transport of organic cations in double-transfected MDCK cells expressing human organic cation trans-porters hOCT1/hMATE1 and hOCT2/hMATE1.Biochem Pharmacol76:894–903. Scheen AJ (1996) Clinical pharmacokinetics of metformin.Clin Pharmacokinet30:359–371. Shu Y, Bello CL, Mangravite LM, Feng B, and Giacomini KM (2001) Functional characteristics
and steroid hormone-mediated regulation of an organic cation transporter in Madin-Darby canine kidney cells.J Pharmacol Exp Ther299:392–398.
Shu Y, Brown C, Castro RA, Shi RJ, Lin ET, Owen RP, Sheardown SA, Yue L, Burchard EG, Brett CM, et al. (2008) Effect of genetic variation in the organic cation transporter 1, OCT1, on metformin pharmacokinetics.Clin Pharmacol Ther83:273–280.
Song IS, Shin HJ, Shim EJ, Jung IS, Kim WY, Shon JH, and Shin JG (2008) Genetic variants of the organic cation transporter 2 influence the disposition of metformin.Clin Pharmacol Ther84: 559–562.
Sugawara J, Mitsui-Saito M, Hayashi C, Hoshiai T, Senoo M, Chisaka H, Yaegashi N, and Okamura K (2005) Decrease and senescence of endothelial progenitor cells in patients with preeclampsia.J Clin Endocrinol Metab90:5329–5332.
Takane H, Shikata E, Otsubo K, Higuchi S, and Ieiri I (2008) Polymorphism in human organic cation transporters and metformin action.Pharmacogenomics9:415–422.
Tanihara Y, Masuda S, Sato T, Katsura T, Ogawa O, and Inui K (2007) Substrate specificity of MATE1 and MATE2-K, human multidrug and toxin extrusions/H(1)-organic cation antiporters. Biochem Pharmacol74:359–371.
Tsuda M, Terada T, Mizuno T, Katsura T, Shimakura J, and Inui K (2009a) Targeted disruption of the multidrug and toxin extrusion 1 (mate1) gene in mice reduces renal secretion of metformin. Mol Pharmacol75:1280–1286.
Tsuda M, Terada T, Ueba M, Sato T, Masuda S, Katsura T, and Inui K (2009b) Involvement of human multidrug and toxin extrusion 1 in the drug interaction between cimetidine and metformin in renal epithelial cells.J Pharmacol Exp Ther329:185–191.
Tucker GT, Casey C, Phillips PJ, Connor H, Ward JD, and Woods HF (1981) Metformin kinetics in healthy subjects and in patients with diabetes mellitus.Br J Clin Pharmacol12: 235–246.
Tzvetkov MV, Vormfelde SV, Balen D, Meineke I, Schmidt T, Sehrt D, Sabolic I, Koepsell H, and Brockmöller J (2009) The effects of genetic polymorphisms in the organic cation transporters OCT1, OCT2, and OCT3 on the renal clearance of metformin.Clin Pharmacol Ther86:299–306. Vanky E, Zahlsen K, Spigset O, and Carlsen SM (2005) Placental passage of metformin in women
with polycystic ovary syndrome.Fertil Steril83:1575–1578.
Wang DS, Jonker JW, Kato Y, Kusuhara H, Schinkel AH, and Sugiyama Y (2002) Involvement of organic cation transporter 1 in hepatic and intestinal distribution of metformin.J Pharmacol Exp Ther302:510–515.
Wang ZJ, Yin OQ, Tomlinson B, and Chow MS (2008) OCT2 polymorphisms and in-vivo renal functional consequence: studies with metformin and cimetidine.Pharmacogenet Genomics18: 637–645.
Winder WW and Hardie DG (1999) AMP-activated protein kinase, a metabolic master switch: possible roles in type 2 diabetes.Am J Physiol277:E1–E10.
Xia L, Engel K, Zhou M, and Wang J (2007) Membrane localization and pH-dependent transport of a newly cloned organic cation transporter (PMAT) in kidney cells.Am J Physiol Renal Physiol292:F682–F690. Zamek-Gliszczynski MJ, Bao JQ, Day JS, and Higgins JW (2013) Metformin sinusoidal efflux from the liver is consistent with negligible biliary excretion and absence of enterohepatic cycling. Drug Metab Dispos41:1967–1971.
Zhang X, Wang X, Vernikovskaya DI, Fokina VM, Nanovskaya TN, Hankins GD, and Ahmed MS (2015) Quantitative determination of metformin, glyburide and its metabolites in plasma and urine of pregnant patients by LC-MS/MS.Biomed Chromatogr29:560–569.
Zhou G, Myers R, Li Y, Chen Y, Shen X, Fenyk-Melody J, Wu M, Ventre J, Doebber T, Fujii N, et al. (2001) Role of AMP-activated protein kinase in mechanism of metformin action.J Clin Invest108:1167–1174.
Zhou M, Xia L, and Wang J (2007) Metformin transport by a newly cloned proton-stimulated organic cation transporter (plasma membrane monoamine transporter) expressed in human in-testine.Drug Metab Dispos35:1956–1962.