REVIEW
Role of omics techniques in the toxicity
testing of nanoparticles
Eleonore Fröhlich
*Abstract
Nanotechnology is regarded as a key technology of the twenty-first century. Despite the many advantages of nanotechnology it is also known that engineered nanoparticles (NPs) may cause adverse health effects in humans. Reports on toxic effects of NPs relay mainly on conventional (phenotypic) testing but studies of changes in epig-enome, transcriptome, proteome, and metabolome induced by NPs have also been performed. NPs most relevant for human exposure in consumer, health and food products are metal, metal oxide and carbon-based NPs. They were also studied quite frequently with omics technologies and an overview of the study results can serve to answer the question if screening for established targets of nanotoxicity (e.g. cell death, proliferation, oxidative stress, and inflam-mation) is sufficient or if omics techniques are needed to reveal new targets. Regulated pathways identified by omics techniques were confirmed by phenotypic assays performed in the same study and comparison of particle types and cells by the same group indicated a more cell/organ-specific than particle specific regulation pattern. Between dif-ferent studies moderate overlap of the regulated pathways was observed and cell-specific regulation is less obvious. The lack of standardization in particle exposure, in omics technologies, difficulties to translate mechanistic data to phenotypes and comparison with human in vivo data currently limit the use of these technologies in the prediction of toxic effects by NPs.
Keywords: Cytotoxicity, Nanoparticles, Omics technologies, Transcriptomics, Proteomics
© The Author(s) 2017. This article is distributed under the terms of the Creative Commons Attribution 4.0 International License
(http://creativecommons.org/licenses/by/4.0/), which permits unrestricted use, distribution, and reproduction in any medium,
provided you give appropriate credit to the original author(s) and the source, provide a link to the Creative Commons license,
and indicate if changes were made. The Creative Commons Public Domain Dedication waiver (http://creativecommons.org/
publicdomain/zero/1.0/) applies to the data made available in this article, unless otherwise stated.
Background
Many scientists view nanotechnology as the revolution-ary technology of the twenty-first century because it opened new possibilities for improvement of products used in healthcare, cosmetics, and medicine. Nano-sized materials, on the other hand, can also have nega-tive effects on human health, particularly when inhaled. Epidemiological data showed adverse action of air-borne ultrafine particles on humans, which were confirmed in animal exposures [1]. Toxicity of metal, metal oxide and carbon-based nanoparticles (NPs) is most relevant for human health because exposure to this group of NPs is highest, occurs over long periods and degradation and excretion of the ingested particles are low [2]. Numerous studies have addressed adverse effects of NPs exposure by in vitro and in vivo experiments. The vast majority
of in vitro studies used cell-based assays with pheno-typic readout parameters, mainly membrane integrity, apoptosis, cell morphology, and proliferation. Oxidative stress was identified as mechanism of toxic action and, therefore, included in the routine testing. Toxicity test-ing of NPs in vivo comprised exposure of rodents and histopathological evaluation of liver, lung, spleen, kidney, brain, gastrointestinal tract, analysis of bronchoalveolar lavage fluid, blood count and clinical chemistry as read-out parameters.
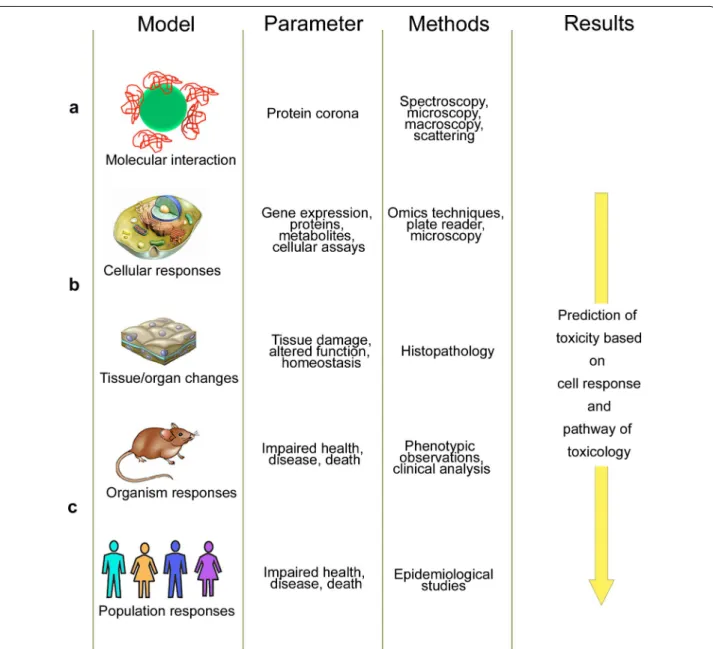
In the last years, principles, methodology and tech-niques of toxicity testing changed and these develop-ments have also influenced the testing of NPs. One important change was the introduction of quantitative analysis of molecular and functional changes in multiple levels of biological organization in traditional toxicology testing (Fig. 1). The new strategy, termed systems toxi-cology, changed the current approach of relying almost exclusively on high-dose phenotypic responses in ani-mals [3]. Core technologies in systems toxicology are the
Open Access
*Correspondence: [email protected]
“omics” techniques, namely genomics, transcriptomics, proteomics and metabolomics. Omics technologies have also been used for in vitro and in vivo testing of NPs. One advantage might be the identification of new targets and markers for NP toxicity. Such markers would be very useful because exposure to NPs occurs at low levels. If realistic exposure levels are used in conventional in vitro
because the techniques identify changes before pheno-typic changes are obvious. Another advantage of the omics techniques would be their lower interference with NPs. False positive and negative results in conventional screening assays have been frequently described. They are due to interference by color, fluorescence, chemical activity, light scattering, etc. (e.g. [5]). In contrast, simi-lar problems have not been reported in omics studies. Removal of the NPs during the isolation procedure of the analyte appears to be the most likely reason for that. The use of omics techniques, however, requires more expensive infrastructure and skilled personal in sample preparation and data analysis than conventional testing. Based on the overview of NP studies using omics tech-niques in vitro and in vivo, this review aims to answer the following questions (i) are omics technologies able to identify new targets in nanotoxicology, (ii) are the tech-nologies robust enough to be used for toxicity screening, (iii) to which extent do the reported regulations corre-spond to results obtained in phenotypic assays.
NPs contained in commercial products with relevance for human exposure were addressed in this review. They appear suitable for such a comparison although the action of some of the NPs is caused partly by dissolved ions. The different omics technologies are shortly intro-duced and data within the same study, between platforms and between research groups and NP action across the platforms and phenotypic assays compared. Finally, a comparison of omics technologies to high-throughput phenotypic testing is made.
Omics techniques
The suffix “omics” stands for “as a whole” and includes epigenomics, genomics, transcriptomics, proteomics and metabolomics. These studies differ from the traditional observation of phenotypes in the way that they can pro-vide primarily mechanistic information and may identify the pathway of toxicity. Based on these techniques it is possible to identify adaptive responses to toxicants at low levels that do not yet cause toxicity but put cells or organ-isms under stress, which reflects the situation of particle exposure. Identification of cellular stress is important because manifest toxicity occurs when the compensation system is exhausted. An example for the manifestation of adverse effects only upon challenge of the organism is the decreased antibacterial defense of mice that have been exposed to CoO NPs [6].
Toxicants that do not interact or bind to a single type of macromolecule can perturbate multiple pathways and result in a broad activation of pathways. NPs influ-ence various cellular processes (proliferation, apoptosis, inflammation, membrane integrity) [7] and induce such
a pattern. In this case, it is usually difficult to deduce the pathway of toxicity from the regulation pattern [3].
Systems toxicology includes genomics, epigenomics (miRNomics and DNA modifications), transcriptomics, proteomics, and metabolomics. Genomics investigates genes and their functions by use of recombinant DNA, DNA sequencing and bioinformatics to analyze func-tion and structure of the genome. The goal is to identify a particular sensitivity of individuals to a given toxin rather than the screening for toxicity of compounds or NPs. The epigenome can be altered by toxicants and, therefore, is useful for toxicity screening.
A detailed description of the respective detection techniques is out of the scope of this review and only the basic principles of the respective techniques will be mentioned.
Epigenomics–miRNomics
The epigenome further includes DNA methylation, post-translational modification of histone tails, and chromatin remodeling. DNA methylation is the main mechanism for the down-regulation of gene transcription by preventing the transcription machinery to bind. Its main importance is seen in tumor biology because DNA hypomethyla-tion in tumors is linked to progression and malignancy [11]. Histones are basic proteins that organize eukaryotic DNA into structural units. Binding of histones to DNA is accompanied by decrease of transcription and can be regulated by a variety of post-translational modifications [12]. Histones in the modified state detach from the DNA and, thereby, activate transcription. Increased activ-ity of enzymes that remove these modifications, mainly histone deacetylases, are involved in cancer progression [13]. Epigenetic changes are involved in the transforma-tion and mutatransforma-tion of cells and, therefore, may serve as indicator for genotoxicity. The biological relevance of an altered epigenome is not yet clear because DNA hypo-methylation may cause cancer but may also be a conse-quence of the transformed state induced by altered cell signaling pathways [14]. Therefore, epigenetics is also not (yet) a part of routine pre-clinical evaluation of drugs. Epigenomic studies use a variety of technologies. His-tone acetylation is determined mainly based on antibody binding using immunohistochemistry and Western blot. DNA methylation can be quantified by polymerase chain reaction, pyrosequencing, high performance liquid chro-matography (HPLC), enzyme-linked immunosorbant assay (ELISA), etc. [15].
Pathways that may indicate adverse effects on DNA are regulation of DNA damage and repair and of nucleic acid metabolism (listed in Table 1).
Transcriptomics
The transcriptome represents the entire set of transcripts or mRNAs present in a cell or an organism and is stud-ied by a panel of molecular biological techniques. Gene expression profiling determines the expression level of all mRNAs at a given time point by DNA microarray, next generation RNA sequencing, subtraction hybridization, differential display, or serial analysis of gene expression. Current estimations indicate a number of around 19,000 coded genes [16], which are represented in commercially available whole genome expression arrays. cDNA micro-array analysis is the most established omics technique and the testing should ideally be performed across both dose and time. Extracted RNA is subjected to reverse transcription to obtain labeled cDNA or to RNA poly-merase amplification to generate labeled cRNA. The sequences are hybridized to oligonucleotides on micro-arrays and scanned under laser light. After analysis of
the hybridization, the identified genes are allocated to pathways based on databases. The advantage of tran-scriptomics is that only one type of biomolecule has to be extracted and analyzed, compared for instance to proteomics, where different protocols have to be used. A known limitation of transcriptomics is the fact that changes in mRNA expression do not influence the phe-notype directly. Transcriptomics is a very established technique with high intra-array reproducibility. Compar-ison between array platforms, on the other hand, varied with a Pearson correlation coefficient of 0.5–0.95 [17]. Problems include inaccuracy for genes with low expres-sion levels and the fact that not all probes on the arrays match the target genes to the same degree.
Proteomics
Table 1 Char ac teriza tion of c ell t oxicit y ac cor ding t o changes in mRNA e xpr ession (tr anscript omics), pr ot eome (pr ot eomics), and metabolome (metabolomics) with c at egories Par ticle Siz e (nm) C ell Exp Regula ted pa th w ay(s) St Im De Pr Mo Me Ve Si O Ref er enc es A. T ranscr ipt omics Ag 5 L51784 3–6 µg/ml; 4 h Ox. str ess
, DNA r
epair X X [ 76 ] Ag 5, 100 U937 1–25 µg/ml; 24 h 5 nm: o x. str ess , inflammation X X [ 80 ] Ag 20 Human der mal f etal fibr oblasts 3–6 µg/ml; 4 h Cyt osk elet on, ener gy metabo
-lism, DNA damage
X X X [ 122 ] Ag
20, 30, 60
Caco -2, MCF-7 5–25 µg/ml; 6–24 h Pr olif eration, str ess r esponse , ox. str ess X X [ 123 ] Ag 20, 50 HepG2 2.5 µg/ml; 4–24 h 20 nm: str ess r esponse X [ 124 ] Ag 20, 50 Human der mal fibr oblasts 200 µM; 1–8 h Cyt osk elet
on, insulin, HGF
sig naling , M APK sig naling , A TP cont ent, apopt osis , c yt osk el -et on X X X X X [ 52 ] Ag 20, 50 A549 1–3 µg/ml; 24–48 h Cell c ycle , o x. str ess X X [ 65 ] Ag 20, 50 HepG2 1–3 µg/ml; 24–48 h Cell c ycle pr og ression (lo w dose), mor pholog ical damage (high dose) X [ 75 ] Ag < 100 HeLa 20 µg/ml; 24–48 h M etabolic pr ocess , cellular pr ocess , str ess r esponse , apopt osis
, cell c
ycle X X X X [ 125 ] Ag 100 Embr
yonic rat cells
20 µg/ml; 48 h Ener gy , metabolism, O2 trans -por
t, inflammation, molecular
binding X X X [ 69 ] Al2 O3 < 100 A549 100 µg/ml; 0–72 h
Cell death, cell c
ycle ar rest X X [ 81 ] A u (NH 2 , C OOH, OH) 17–22 Human mesench ymal st em cells 50 µg/ml; 4 h TFG-β , FGF-2 X [ 126 ] Au 5, 30 Caco -2 200–300 µM; 24–72 h Ox. str ess , apopt osis , g ro wth inhibition X X X [ 127 ] Au
20, 34, 61, 113
Caco
-2/M
-cells
0.5–64
µg/ml; 10–21 da
ys
Ox. str
ess
, ER str
Table 1 c on tinued Par ticle Siz e (nm) C ell Tech Regula ted pa th w ay(s) St Im De Pr Mo Me Ve Si O Ref er enc es A. T ranscr ipt omics C dS e/ZnS 8–10 HSF-42 8–80 nM; 48 h Car boh ydrat e binding , intracellular v esicle for mation, str ess response , mit osis , cyt ok inesis X X X X [ 66 ] Ce O2 3 Caco -2 170 µg/ml; 24–72 h M itochondr ial func tion X [ 129 ] Cu O 50 A549 25 µg/ml; 24 h M itosis
, cell death, p38
path wa y X X X [ 130 ] C uO (r ods , spher ical) 12, 50–80 Caco -2 5–100 µg/ml; 24–120 h Inflammation, o x. str ess (rod > spher ical) X X [ 111 ] Fe3 O4 (C OOH, NH 2 , bar e) 14–18 HCM, BE-2-C, 293T 20–80 µg/ml; 2 da ys Ox. str ess , pr olif eration X X [ 131 ] Fe 3 O4 32 RA W264.7, Hepa1–6 30–100 µg/ml; 4–48 h Immune eff ec ts , cell
death, homeostatic processes
X X X [ 132 ] Fe 3 O4 32 THP -1, HepG2 50–100 µg/ml; 24 h Var ious path wa ys;
HepG2: cell g
ro wth, mobilit y, metabolism X X X [ 104 ] Fe 2 O3
, SiO
2
, T
iO2
, ZnO
3, 10, 5, 8–10
RK O , C aco -2, HaC aT , SKM el28
10, 5–50, 1–5
µg/cm 2; 4 h Ox. str ess r esponse all lines
, ZnO in addition
pr ot ein f olding X X [ 99 ] Fe 2 O3
, SiO
2 , ZnO 100 HEK293 100, 12.5 µg/ml; 24 h Inflammation, str ess , cell death X X X [ 107 ] MW CNT 5–10 × 20–30 Caco -2, diff . THP -1, small air wa y cells 10–100 µg/ml; 24 h Apopt osis , inflammation, cell adhesion X X X [ 93 ] PEG-silane qdots 10–13 IMR-90 8–80 mM; 48 h M itosis
, spindle f
or ma -tion X X [ 66 ] SiO 2 10, 500 RA W264.7 5–50, 250–1000 µg/ml; 24 h Transcr
iption, cell c
ycle pr og ression, inflamma -tion r esponse , apop -tosis , mor phogenesis , diff er entiation X X X X [ 54 ] SiO 2 12 A549 0.1–6 µg/ml; 24–72 h Ox. str ess r esponse; membrane traffick ing; inflammat or y r esponse X X X [ 78 ] SiO 2
12, 5–10, 10–15
Table 1 c on tinued Par ticle Siz e (nm) C ell Tech Regula ted pa th w ay(s) St Im De Pr Mo Me Ve Si O Ref er enc es SW CNT 1–2 × 1000–2000 EAh y926 50 µg/ml; 24 h Inflammation, o x. str ess , and apopt osis X X X [ 53 ] Ti O2 anatase
7, 20, 200
HaC aT n/a; 2–24 h Inflammation r esponse , cell adhesion X X [ 55 ] Ti O2 , ZnO 12, 15 Jur kat, pr im mac -rophages , DCs 1–10 µg/ml; 6–24 h Ox. str ess r elat ed all cell lines
, cell death,
cell g ro wth, immune syst em; TiO 2 iner t X X X X [ 94 ] Ti O2 7000 × 200 × 10 Caco -2, diff . THP -1, small air wa y cells 10–100 µg/ml; 24 h Apopt osis
, cell c
ycle
,
inflammation, cell adhesion, phagoc
y-tosis X X X X X [ 93 ] W C, W CC o 56, 62 HaC aT 30; 3 µg/ml; 3 h–3 da ys H ypo xia-r elat ed response , car boh y-drat e metabolism, endocr ine path wa ys X X [ 106 ] ZnO 20 HaC aT 10–80 µg/ml; 24 h Apopt osis , o x. str ess X X [ 56 ] ZnO 20, 60 A549 25 µg/ml; 24 h DNA damage , apopt osis , ox. str ess X X X [ 134 ] ZnO 28 × 96, 36 × 95, 44 × 73, 25 Olfac tor y cells , human st ellat e cells 2.5–10 µg/ml; 24 h Str ess r esponse , inflam -mat or y r esponse; str ess
, cell g
ro
wth and
sur
vival
, cell sig
naling X X X X X [ 135 , 136 ] A. M iRNomics Ag 20
Human neural st
em cells 10–200 µg/ml; 6–24 h Cell c ycle ar rest, apopt o-sis , o x. str ess , dysfunc -tional neur ogenesis X X X X [ 57 ] Ag 30 Jur kat 0.2 µg/ml; 24 h DNA damage , apopt osis , ox. str ess X X [ 137 ] Fe 2 O3 3–7 PC-12 214 µg/ml; 24 h Apopt osis , phagoc yt osis , inflammation, metabo -lism, endoc yt osis X X X X [ 138 ] MW CNT 100 × 13,000 BEAS-2B 0.25–2 µg/cm
2; 1–48
h M itochondr ia, gluconeo -genesis , micr otubuli func tion X X [ 139 ] B. P rot eomics Au
2.2, 5.9, 17
K562 cells 10 mM; 3–24 h ER str ess X [ 79 ] Au 5, 15 Balb/3T3 58.8 µg/ml; 72 h Cell g ro wth, pr olif era -tion, mor phology , cell cy cle , o x. str ess , inflam
-mation, ECM synthesis
Table 1 c on tinued Par ticle Siz e (nm) C ell Tech Regula ted pa th w ay(s) St Im De Pr Mo Me Ve Si O Ref er enc es Ag 20, 200 Caco -2/T C7:HT29-M TX 1 µg/ml; 24 h Cyt osk elet on r ear range
-ment, cell c
ycle , o x. str ess , metabolism X X X X [ 58 ] Au 20 D er mal fibr oblasts 200 µM; 1–8 h Sig nal transduc tion, cyt osk elet on, ener gy metabolism, o x. str ess X X X X [ 140 ] Au 20 Small air wa y cells/MR C-5 1 nM; 72 h Cell adhesion X [ 70 ] NH 2 -A u, C uO , NH 2 -C dTe 20 THP -1
15, 22, 5
µg/ml; 48 h Topoisomerase ( CdT e), ox. str ess ( CuO), N fkB (Au ) X X X [ 108 ] Au 5, 30 Caco -2 59 µg/ml; 72 h M etabolism, Ener gy , transcr iption, pr ot ein, cell mor phology and transpor t, sig nal trans -duc tion, g ro wth, pr o-lif eration, antio xidant ac tivit y, apopt osis , cell adhesion, c yt osk elet on or ientation X X X X X X [ 59 ] Au 20 MR C-5 1 nM; 72 h Ox. str ess , c yt osk elet on, cell c ycle r egulation, DNA r epair X X X X [ 141 ] Au 20, 100 Lo Vo 10 µg/ml; 24 h 100 nm: P AK , M APK ,
phosphatase 2A path
-wa
y; 20
nm: cell str
ess , pr ot ein car bon ylation X X [ 60 ] C oO
, F
e3 O4
, SiO
2
<
100, 13, 15
RA W264.7 6.25–25 µg/ml; 24 h ER str ess , phagoc yt osis X X [ 101 ] Cu O 30–50 BEAS-2B 0.01 µg/cm
2; 24–72
h M aint enance , pr ot ein synthesis , death/ sur vival
, cell c
ycle , mor phology X X X X [ 72 ] Cu , Cu O 250 RA W264.7 5–10 µg/ml; 24 h Ox. str ess r esponse , GSH synthesis , c yt osk el -et on, mit ochondr ial pr ot eins X X X [ 61 ] C uO
, T
iO2 22, 25 M ur ine macr ophages 5–10, 100 µg/ml; 24 h Ox. str ess r esponse X [ 77 ] Fe 3 O4 10, 100 NRK -52E 1 ng/w ell; 24 h
Cell death r
elat ed , ras-relat ed , GSH-r elat ed , HSP , ser
pin H1,
ER-resident pr ot eins X X X [ 142 ] MW CNT (0.6 × 3.6) * 10E3 HEK 0.4 mg/ml; 24–48 h M
etabolism, cell signaling
, cell str
Table 1 c on tinued Par ticle Siz e (nm) C ell Tech Regula ted pa th w ay(s) St Im De Pr Mo Me Ve Si O Ref er enc es MW CNT (0.1 × 10–20) * 10E3 U937 30 µg/ml; 24 h M etabolism, biosynthe -sis , str ess r esponse , diff er entiation X X X [ 144 ] MW CNT 30 × < 1000 A549 0.3–300 µg/ml , 2–24 h Pr olif eration, o x. str ess , cyt osk elet on X X X [ 62 ] SiO 2 25 A549 100 µg/ml; 24 h Apopt osis , c yt osk elet on, ox. str ess r esponse , pr ot ein synthesis X X X X [ 67 ] SiO 2 15, 30 HaC aT 10 µg/ml; 24 h M etabolism, o x. str ess , c yt osk elet on, molecular chaper ones , apopt osis X X X X X [ 68 ] SW CNT 1–6 × 1000–2000 HepG2 0.1–100 µg/ml; 24 h Redo x r egulation, sig naling , c yt osk elet on for
mation, cell g
ro wth X X X X [ 145 ] SW CNT , (plain, PEG ylat ed) (0.7–1.6 × 0.2–3) * 10E3 PC-12 0.1–100 µg/ml; 24 h Antio xidant r eac tivit y,
nucleic acid metabo
-lism, lipid metabo-lism, mit
ochondr ial func tion X X X [ 63 ] Ti O2 18–80 BEAS-2B 10 µg/ml; 24 h Str ess r esponse ,
metabolism, adhesion, cytosk
elet
on dynam
-ics
, cell g
ro
wth, cell
death, cell sig
naling X X X X X X X [ 146 ] Ti O2 , ( coat ed , plain) 20
Human and rat mac
-rophages 300; 24 h//20 µg/ml; 8–48 h M etabolic homeostasis , cyt osk elet on r emod -eling , o x. Str ess X X X [ 73 , 147 ] Ti O2 24 A549 2.5–50 µg/ml; 2 month
Glucose metabolism, mit
ochondr ial func -tion, pr ot easome ac tivit
y, DNA dam
-age r
esponse
, p53
ac
tivation, cell c
ycle , pr olif eration X X X [ 148 ] ZnO , ZrO 40 J774 10 µg/ml; 24 h M itochondr ial func tion, phagoc yt osis , DNA damage X X [ 100 ] ZnO ( Al-doped) 20–40 A549 20–500 µg/ml; 2–48 h p53 ac tivation, ex tracel -lular sig naling X [ 149 ] C. M etabolomics Ag
10, 30, 69
Table
1
c
on
tinued
Par
ticle
Siz
e (nm)
C
ell
Tech
Regula
ted pa
th
w
ay(s)
St
Im
De
Pr
Mo
Me
Ve
Si
O
Ref
er
enc
es
Al2 O3
64
Human br
onchial epi
-thelial cells
50–500
µg/ml; 24
h
Apopt
osis
, o
x. str
ess
,
mit
ochondr
ial func
tion
X
X
X
[
151
]
Au
2
SH-SY5Y
100
ng/ml; 2–6
h
Ox. str
ess
, immune
response
X
X
[
83
]
Cu
O
28
A549
5–40
µg/ml; 4–24
h
Ox. str
ess
, h
yper
tonic
str
ess
, apopt
osis
X
X
X
[
64
]
Cu
O
<
50
M
ur
ine bone mar
ro
w
MSCs
2–100
µg/ml; 48
h
Ser
ine
, gly
cer
ic acid
,
and succinic acid
,
glutamine
X
[
32
]
Ti
O2
5
L929
100
µg/ml; 48
h
Amino acid le
vel
changes
X
[
152
]
Ti
O2
<
100
L929
100
µg/ml; 48
h
Car
boh
ydrat
e metabo
-lism, ener
gy metabo
-lism, mit
ochondr
ia
X
[
153
]
Exposur
e (Exp) with c
onc
en
tr
ation and c
ollec
tion time af
ter tr
ea
tmen
t with nanopar
ticles is g
iv
en. I
f a r
ange is indica
ted
, sev
er
al c
onc
en
tr
ations or time poin
ts ha
ve been ev
alua
of peptides [20]. Limitations of proteomics are both bio-logical and technical. The preparation is prone to con-tamination, and protein expression varies in response to circadian cycles, age, sex and disease. In addition to that, there are many proteins with partly unknown functions; the sensitivity of MS is still lower than other protein detection techniques (e.g. ELISA or Western blot), and usually only water-soluble proteins in a limited range of mass and isoelectric point are analyzed.
In addition to identification of regulated pathways, proteomics plays a specific role for particle characteri-zation because it has been used to characterize proteins that are absorbed to the surface of NPs. The coverage of surfaces with macromolecules, predominantly proteins, is usually referred to as “protein corona” [21]. The bind-ing of the macromolecules affects dispersion of particles in physiological fluids and consists of a relatively stable “hard” layer, which forms within seconds and a less sta-ble “soft” layer that forms within minutes to hours [22]. The composition of the layer depends on absorption and desorption of macromolecules, where the velocity of des-orption is the inverse of the velocity of absdes-orption. The two corona layers appear to have different roles for the biological response. The hard layer is resistant and still present after cellular uptake by endosomes, while the soft layer is less stable and determines uptake and biological responses. Various groups studied the protein corona composition using proteomics. Influence of material, particle size and surface charge, hydrophobicity/hydro-philicity, incubation time and type of biological fluid has been reported [23–29]. The studies reported qualitative and quantitative differences in the composition of the protein corona but also a common set of bound pro-teins. Cytotoxicity of NPs possessing a protein corona was generally lower than toxic effects of NPs without. It is not clear whether a decreased interaction with plasma membrane and decreased production of reactive oxy-gen species or specific molecules within the layer cause this effect. A link of specific proteins within the protein corona to cytotoxicity has not been identified so far.
Metabolomics
Compared to the transcriptomics and proteomics, which provide information of potential hazards, metabolomics identifies phenotypic changes that occurred in the pres-ence of the toxicant by measuring changes in carbo-hydrate, lipid, and amino acid patterns. Metabolomics differs from the former techniques in the way that it is not organism-specific and does not have a fixed code [30]. Metabolomics profiling assesses changes in the entire metabolome and is performed either as footprint (analysis of extracellular metabolites) or as fingerprint (analysis of the intracellular metabolites). To distinguish
between these two profiles it is important to prevent leakage of metabolites from cells. Washing may not be ideal because it delays sample processing, which is crucial in order to prevent changes of the metabolite profile after the sampling. The basic workflow including separation and enrichment of the analyte proceeds in a similar way as for proteomics. While analysis by Nuclear Magnetic Resonance (NMR) can detect a variety of metabolites in relatively crude preparation with high reliability, the technique is relatively insensitive and only < 100 metab-olites can be detected. MS based techniques are usually preferred because of the higher sensitivity. Separation of the metabolites uses gas chromatography (GC) and liquid chromatography (LC). GC is the ideal method for vola-tile samples; non-volavola-tile samples can be detected after derivatization. LC can easily separate non-polar metabo-lites, while polar metabolites may require derivatization. The identity of the metabolites is established by MS–MS fragmentation and comparison of the resulting fragmen-tation spectra to a reference database. Inter-experiment comparability needs “house-keeping” metabolites or isotope-labeled standards. The relative inexpensiveness of the analysis, the non-invasiveness of the sampling, the low number of metabolites and the good knowledge of the role of most metabolites in the organism make metabolomics particularly suitable for the study of toxi-cology [31]. There are several limitations to this tech-nology too. The metabolites are not organism-specific and the concentration range can span at least six orders of magnitude. This range cannot be easily compensated because amplification of the signal is not possible. Fur-thermore, different detection techniques have to be used because metabolites belong to different classes of mol-ecules [30]. Therefore, many studies do not analyze the entire metabolome but use metabolic target analysis or metabolomics profiling, where the analysis is restricted to metabolites of a specific pathway or to a specific group of molecules (for instances lipids). The number of metab-olites which is usually detected ranges between 2000 and 7000, although 42,000 metabolites have been entered in the Human Metabolome Databank. Metabolomics identified differences in cellular effects induced by NPs and by microparticles. In the free metabolite screening of human bone marrow mesenchymal stem cells treated with CuO particles the increase in glutamine could dis-criminate nano-from microparticles [32].
Omics data in nanotoxicology
Table 2 Char ac teriza tion of in viv o t oxicit y ac cor ding t o changes in mRNA e xpr ession (tr anscript omics), pr ot eome (pr ot eomics), and metabolome (metabo lomics) with c at egories P Siz e Sp A ppl Exp Regula ted pa th w ay(s) St Im De Pr Mo Me Ve Si O Ref er enc es A. T ranscr ipt omics Ag 20 Rat Inhal 381 µg/m
3; 12
w
eeks
Kidne
y: cell c
ycle
,
xenobiotic metabolism, extracellular sig
naling X X [ 154 ] Au 4, 100 M ouse Iv 426 mg/k g; 30 min Liv er : apopt osis
, cell c
ycle
,
inflammation, metabolic process
X X X X [ 155 ] CNT 4 × 67, 0.8 × 11, 3.8 × 49, 5.7 × 49 M ouse It, or oph, inhal , M eta-analysis
Lung: inflammation r
esem -bling diff er ent disease patt er n X [ 51 ] Cu 25 Rat Oral 50–200 µg/k g; 5 da ys Kidne
y: coagulation, cell
sig
naling
, amino acid
metabolism X X [ 84 ] C60, N iO 60, 59 Rat Inhal 0.12 mg/m 3; 3 da ys–4 w eeks
Lung: C60: immune pr
ocess; N iO: o x. str ess , inflammation X X [ 156 ] SiO 2 (C d-doped) 20 Rat It 1 mg/animal; 7–30 da ys Lung: cir cadian r hythm,
inflammation, cell c
ycle X X X [ 157 ] Ti O2 5–6 M ouse Ig 10 mg/k g; 90 da ys O var y: estradiol , pr ogest er -one metabolism X [ 88 ] Ti O2 5–6 M ouse Ig 10 mg/k g; 90 da ys Liv er
: inflammation, apop
-tosis , o x. str ess , metabolic pr ocess
, cell c
ycle , sig nal transduc tion, c yt osk el -et
on, cell diff
er entiation X X X X X X X [ 87 ] Ti O2 5–6 M ouse Oral 2.5–10 µg/k g; 90 da ys
Spleen: inflammation, apopt
osis , o x. str ess , metabolic pr ocesses , ion transpor t, sig nal transduc tion, cell pr olif eration/division, cyt osk elet on X X X X X X [ 89 ] Ti O2
8, 20, 300
M ouse It 18–486 µg/animal; 1–90 da ys
Lung: inflammation, all same patt
er n X [ 85 ] Ti O2
10, 20.6, 38
M ouse It 18–486 µg/animal; 1–28 da ys Lung: inflammation X [ 158 ] Ti O2
10.5, 10, 20.6
M ouse It, or oph, inhal , M eta-analysis
Lung: inflammation r
Table
2
c
on
tinued
P
Siz
e
Sp
A
ppl
Exp
Regula
ted pa
th
w
ay(s)
St
Im
De
Pr
Mo
Me
Ve
Si
O
Ref
er
enc
es
Ti
O2
20.6
M
ouse
Inhal
42
mg/m
3; 1–22
da
ys pn
Liv
er of off
spr
ing: f
emales
retinoid path
wa
y
X
[
90
]
Ti
O2
20.6
M
ouse
It
162
µg/animal; 1–22
da
ys
Lung: inflammation
X
[
86
]
B. P
rot
eomics
Ti
O2
<
25
M
ouse
Ip
100
µg/animal; 7
da
ys
Lung: o
x. str
ess
X
[
159
]
Ti
O2
<
25
M
ouse
Ip
100
µg/animal; 7
da
ys
Liv
er
: inflammation, apop
-tosis
, o
x. str
ess
X
X
X
[
160
]
Ti
O2
<
25
M
ouse
Ip
100
µg/animal; 7
da
ys
Brain: o
x. str
ess
X
[
161
]
Ti
O2
<
25
M
ouse
Ip
100
µg/animal; 7
da
ys
Kidne
y: o
x. str
ess
, sig
nal
transduc
tion
X
X
[
162
]
Ti
O2
25
M
ouse
Id
5
µg/animal; 24
h
Lymph node: inflamma
-tion, lipid metabolism, mRNA pr
ocessing
,
nucleosome assembly
X
X
[
163
]
ZnO
35
Rat
Inhal
12.1
mg/m
3; 24
h
Lung: S100A8, S100A9, inflammation
X
[
164
]
C. M
etabolomics
M
nO
10
Rat
Iv
10
mg/k
g; 6–48
h
Plasma, ur
ine
, tissues: lipid
,
ener
gy metabolism,
amino acid metabolism
X
[
165
]
PS, lipid poly
-mer
ic
50, 40, 143, 160, 165
M
ouse
It
200, 500
µg/animal; 24
h
BAL: inflammation (all
,
hy
dr
ophobic
>
less
hy
dr
ophobic)
X
[
91
]
ZnO
35, 250
Rat
Inhal
1–5
mg/k
g; 24
h
BAL, lung: cell
anti-oxida
-tion, ener
gy metabolism,
DNA damage and mem
-brane stabilit
y
X
X
X
[
166
]
Applica
tion (
Appl) and Exposur
e (Exp) with dose and dur
ation of tr
ea
tmen
t with nanopar
ticles is g
iv
en. I
f a r
ange is indica
ted
, sev
er
al c
onc
en
tr
ations or time poin
ts ha
ve been ev
alua
analysis”, and “miRNomics” were used for searches in PubMed and other search machines. For the overview of the in vitro results, particle (material and surface func-tionalization), particle size, exposure dose and duration, cells used for the studies, and reported regulated path-ways are summarized in Table 1. Table 2 contains indica-tion of particle (material and surface funcindica-tionalizaindica-tion), particle size, animal species, exposure route, exposure dose and duration, and reported regulated pathways reported in animal studies.
In the vast majority of studies NPs had an effect on regulation of genes, proteins or metabolites and only few studies reported no effects of NPs. For instance, gold NPs had no significant effect on gene regulation of human vein endothelial cells [33] and no alterations of the pro-tein expression profile was observed in adipose tissue derived stem cells after exposure to 900 nm superpara-magnetic iron oxide particles [34].
As the reporting of regulated pathways/processes is not standardized, in order to compare regulated pathways between omics techniques and phenotypic assays the fol-lowing groups have been formed. Stress: oxidative stress, stress response, antioxidant reactivity, GSH-related, HSP, ER stress, cell stress, chaperones; immune: inflammation, immune response, phagocytosis; death: apoptosis, cell death; proliferation: mitosis, growth, proliferation, differ-entiation, transcription; morphology: cytoskeleton, adhe-sion, mobility, cytoskeleton organization; metabolism: mitochondria, ATP content, homeostasis, gluconeogene-sis, glycolygluconeogene-sis, protein synthegluconeogene-sis, amino acid levels, energy metabolism; vesicles: membrane trafficking, lysosomes, vesicles; signaling: cell signaling (mitogen-activated pro-tein kinase (MAPK), p53, p38 MAPK), signal transduc-tion, and genotoxicity: DNA damage, DNA repair, nucleic acid metabolism.
Epigenomics
DNA methylation and histone acetylation studies do not provide pathway regulation pattern as output and are, therefore, not included in Table 1. They can, however, be used in toxicological screening and data be linked to phenotypic data obtained by classic genotoxicity assays. DNA hypomethylation has been reported after cellular exposure to SiO2, ZnO, TiO2, CuO, and Ag NPs [35–38] but effects on global DNA methylation in vivo by CuO NPs, Au NPs and SWCNTs are modest [39, 40]. Pro-moter methylation is increased by 60 nm Au NPs and decreased by SWCNTs in blood cells after intratracheal application of the particles [40]. NPs modify histones by binding to SH groups of histone deacetylases, decreasing the enzymatic activity (Au NPs) [41], or inducing histone hypoacetylation in breast cancer cells (cadmium tellurite (CdTe) quantum dots) [42]. The available data suggest
that exposure to NPs may favor cell transformation and tumor development. Conventional phenotypic genotoxic-ity assays for chromosome damage, for instance COMET assay or micronucleus assay, show variable and partially conflicting results. TiO2 particles in sizes < 100 nm showed positive results in COMET assay (17/24), micro-nucleus (12/16), and sister chromatid exchanges (2/2) but predominantly negative results in COMET (3/5) and micronucleus (2/3) in vivo studies [43]. Also ZnO NPs showed genotoxic action in cellular but not in in vivo studies [44], while studies of SiO2 NPs reported weak genotoxic action in vitro and no genotoxicity in animal studies [44]. Lastly, CuO and Ag NPs showed genotox-icity in vitro [45–47] and in vivo [48, 49]. Variation in fibre length, contamination with heavy metals and pre-treatment of the CNTs samples prevent inter-study com-parison. It appears that long CNTs induce genotoxicity, while short CNTs do not induce prominent genotoxicity [50]. Phenotypic assays and epigenetic assays identified more damage in cellular than in animal studies. Pathway regulation of DNA damage and repair and nucleic acid metabolism as indication for genotoxicity was also more frequently reported in in vitro than in in vivo studies. The higher frequency of epigenetic changes than of genotoxic effects indicates that epigenomic changes induced by SiO2 and TiO2 NPs may not result in manifest chromo-some damage because repair mechanisms could prevent it. It is, however, possible that the particles act as a chal-lenge making cells more vulnerable to the action of other genotoxic agents.
Particle effects according to transcriptomics, proteomics and metabolomics studies
(Table 1). Regulation of inflammation according to tran-scriptomics was also frequently reported in the in vivo studies of NP exposure by the pulmonary route (Table 2), while more variable regulation pattern were seen after oral and intravenous application. In miRNomics studies various pathway regulations have been reported but due to the low number of miRNomics studies a preference for specific regulation pattern would not be easy to dis-cern. Proteomics of cells reported oxidative stress, mor-phology, energy metabolism, mitosis and apoptosis as most affected by NP exposure (Table 1). When particles were applied by pulmonary and dermal routes in ani-mals regulation of inflammation was reported (Table 2). Metabolomic studies reported NP effects on oxidative stress, energy metabolism, apoptosis and other pathways in cell exposures (Table 1). In the in vivo studies effects on inflammation were identified (Table 2).
Several studies assessed NPs by omics techniques and phenotypic assays. Usually, only cytotoxicity screening assays was performed to determine the concentration range for the omics studies. This is important because strongly cytotoxic concentrations should be avoided as dead cells provide only limited information on regula-tory mechanisms. If, on the other hand, concentrations far outside the toxic range are used, no changes in regu-lation will be seen. Effects at different particle concentra-tions were recorded in some studies because reaction to low and high particle concentrations may differ. Compari-son with complementary techniques can confirm omics results and support relevance of the reported regulation pattern. Studies combined plate reader analysis of cytokine secretion, mitochodrial activity, cell death, and ROS gen-eration [52–64], flow cytometry for cell cycle analysis and cell death [57, 65–68], microscopy for morphology and immunocytochemical staining [52, 57, 59, 67–73], and genotoxicity assays [74–77] with omics techniques. Other researchers used verification of the regulated pathways by using another omics technique [52, 78, 79]. Influencing the regulated pathway by addition of an antioxidant or study-ing cell recovery after removal of the particle challenge confirmed involvement of oxidative stress [80–83]. Histol-ogy [84–89], analysis of bronchoalveolar lavage fluid [85, 90, 91] and clinical chemistry [84] were performed to sup-port the results of the omics in vivo studies.
The majority of transcriptomic studies evaluated sam-ples up to 24 h, while proteomics studies mainly col-lected sample at ≥ 24 h (Table 1). mRNA is produced in oscillatory manner and the collection time of the sample is not representative for the levels before and after this time [92]. To avoid this bias, most transcriptomics stud-ies analysed samples at different time points. The major-ity of proteomics and metabolomics studies, on the other hand, analysed only one time point.
The comparison with another omics technique showed that endoplasmatic reticulum stress induced by Au NPs could be demonstrated on genetic and protein level [78]. Regulated genes and proteins did not overlap in cells exposed to TiO2 NPs and MWCNTs [93] but regulated pathways were essentially the same. Similarly, gene reg-ulation coincided very well with exoproteome profiles obtained by exposure of A549 cells with 12 nm SiO2 par-ticles [78]. Concordant pathway regulation pattern was also obtained in transcriptomics and proteomics studies of macrophages exposed to Cu, CuO, and TiO2 NPs [61, 77]. The sensitivity of the different omics technologies may however differ. Gioria et al. used proteomics and metabolomics and identified different regulation profiles of 5 and 30 nm Au NPs only by proteomics [59].
not of oxidative stress by transcriptomics [51]. Data inte-gration is a critical and relevant factor for the outcome of omics studies. Most researchers use Ingenuity Pathway Analysis (IPA) that allows handling of transcriptomics, proteomics and metabolomics data. Free software pro-grams (e.g. Integrated Molecular Pathway Level Analysis, IMPaLA) have similar capacities to analyze data obtained by all these techniques [95]. IMPALA and iPEAP (integra-tive Pathway Enrichment Analysis Platform) also allow to identify additional pathways from combined datasets originating from different omics techniques. The common software systems integrate data either based on pathway or biochemical ontology, on biological networks or on analysis of empirical correlations [96]. The analysis pro-grams vary in outcome of the analysis (e.g. identification of additional pathways, functional enrichment analysis, differential correlation analysis, etc.), accepted inputs (e.g. genomic, proteomic, metabolomic, biochemical platform independent), user platform (e.g. software, web-based) and difficulty to use. Empirical correlation analysis is usu-ally based on R package and more difficult to perform than pathway enrichment analysis.
The relatively high number of transcriptomics studies on cellular effects of 20 nm Ag NPs can show to which extent study results using the same technology, parti-cles and cells vary. Different pathway regulation pattern were reported by six groups that evaluated the effect of 20 nm Ag NPs by transcriptomics. All of them analysed samples at various time points and all but one included 24 h as a sampling point. Two studies evaluated human dermal fibroblasts at high concentrations and two oth-ers studies HepG2 hepatocytes at low concentrations. In the fibroblast studies, but not in the HepG2 studies, there was overlap in the reported pathways. Interestingly, both studies on fibroblasts did not report regulation of oxidative stress, which was reported in most of the other studies on Ag NPs. Effects on fibroblasts were verified by phenotypic assays in one study of fibroblast and in one of the studies on HepG2 cells. Taking into consideration that interarray reproducibility may be low [17], disparate results can be due to the use of different array or pathway analysis platforms. In case of identification of additional pathways, as in the fibroblasts study, sensitivity of the cells could be different. Regarding the HepG2 studies, the different sampling times (≤ 24 h vs. ≥ 24 h) and different exposure concentrations may explain the difference. The comparison may indicate that transcriptomics data are particularly sensitive to the exposure conditions.
As particle handling and biological parameters (passage of cells, preparation of particles, exposure, use of expo-sure medium) may influence the results, only studies that included more than one particles or > 1 cell type were ana-lysed to reveal particle- or cell-specific regulation pattern.
Cells differ in their resistance to oxidative stress, in the proliferation rate, in the reaction to inflammatory stimuli and their reaction to NPs, e.g. CNTs [97]. Particularly for particles, the ability of cells for phagocytosis appears to be important. Phagocytes ingest NPs to a higher degree and the particle accumulation may affect the physiology of phagocytes more than that of epithelial cells [98]. The reported regulation patterns, however, do not support this hypothesis as similar patterns were published for macrophages and epithelial cells exposed to ZnO NPs [94, 99]. Phagocytosis also appears not to be regulated by exposure to NPs. Only two proteomics and one tran-scriptomics studies reported regulation of phagocytosis [93, 100, 101], while the majority of transcriptomics (6) and proteomics (5) studies did not report this. The low importance of the cell type in pathway regulation was corroborated by a meta-analysis on regulation in Caco-2, THP-1, and small airway cells by TiO2 and CNTs. The authors concluded that regulation pattern were more particle-specific than cell-specific [93].
that the actions were caused by dissolved Zn2+ ions and not by intact particles.
Influence of particle properties
Biological effects are influenced by a variety of param-eters, mainly by material, size, surface properties, and shape [105]. A particle-specific regulation pattern would not be unexpected but responses to plain particles of dif-ferent material in transcriptomics and proteomics studies (e.g. Fe2O3/SiO2/ZnO; WC/WCCo; SWCNT/MWCNT; TiO2/CuO; ZnO/ZrO) in a given cell line after ≥ 24 h were uniform [53, 77, 100, 101, 106, 107]. Although the proteomics study on the effect of Au, Cu and CdTe NPs in THP-1 cells suggested particle-specific regulation [108], other studies do not give indication for particle-specific regulation in RAW 264.7 macrophages [61, 77, 101]. After pulmonary application, C60 fullerenes and NiO NPs regu-lated particle-specific and common transcriptomic path-ways in mouse lungs [55]. Furthermore, all omics studies of pulmonary application of NPs, irrespective of the mate-rial, reported regulation of immune system and inflam-mation. These results support the hypothesis of a cell-/ organ-specific reaction pattern. It might be possible that the invasive application, in general intratracheal instil-lation, increased the propensity for inflammation. The absence of pulmonary inflammation after inhaled TiO2 NPs versus instilled NPs supports this assumption [109].
When particles in different sizes and surface properties were studied the following can be concluded. Transcrip-tomics studies identified mainly quantitative differences in the regulation by particles of different size. Typically, smaller particles caused an effect, while the larger parti-cles did not (e.g. [80], Table 1). Different pathways (oxi-dative stress vs. cell signaling), by contrast, have been reported for 20 and 100 nm Au NPs in proteomics [60]. Surface qualities did not markedly influence the regula-tion pattern according to transcriptomics and proteomics studies. Cellular effects of differently functionalized Au particles and bare and differently functionalized Fe3O4 particles in transcriptomics as well as action of coated and plain TiO2 and plain and pegylated SWCNTs sup-port the missing effect of surface properties (Table 1). Comparative metabolomics study on intratracheally instilled polystyrene and polymer particles demonstrated a correlation between surface hydrophobicity and extent of the inflammatory reaction. This finding is consistent with results obtained by conventional testing where par-ticles with hydrophobic surface induced higher immune response than those with hydrophilic surface [110].
Studies of spherical and rod-like CuO suggest a small influence of shape on gene regulation, with rod-like NPs showing a stronger pro-inflammatory effect than spheri-cal particles [111]. Also the meta-analysis by Tilton et al.
concluded that exposure to TiO2 rods and CNTs induced a particle-specific regulation pattern [93]. This leads to the hypothesis that particle-specific regulation may occur for non-spherical compared to spherical particles.
In summary, particle parameters caused rather quan-titative than qualitative differences in the regulation pattern.
Correlation to phenotypic assays
For evaluation of the use of omics technologies in toxicity testing of NPs it is important to know the extent to which pathway regulation corresponds to phenotypic changes. The best method for this comparison is the choice of a phenotypic assay platform capable to analyse multiple parameters in the same cell population. Conventional screening comprises a panel of colorimetric, fluorometric and luminescent test methods for the detection of apop-tosis, membrane damage, proliferation, lysosome func-tion, etc. in parallel exposures. Interference of NPs may occur in one or more of these assays [112, 113]. High-content screening systems (HCS) have the advantage that they combine various fluorescent assays with detection of morphological changes by bright field microscopy. This way, several parameters can be analysed in parallel and inconsistency between signal and cell morphology can be discerned.
The suggested assay panel representing the most com-mon targets for a comprehensive analysis of NP toxicity included: (i) cytotoxicity (proliferation, membrane leak-age and integrity, ATP content, mitochondrial potential, metabolic activity, calcium flux, apoptosis), (ii) genotox-icity by DNA cleavage (micronucleus assay), (iii) inflam-mation (interleukin 1, 8 or tumor-necrosis factor alpha, nuclear factor kappa B, or activator protein-1 activation), (iv) oxidative stress (ROS generation or GSH), and (v) fibrotic potential (tumor growth factor-1 beta, collagens 1 and 3 and metalloproteinase activity) [114]. These cat-egories correspond in essence to the pathway regulation classes in Table 1. Differences include the lack of fibrotic potential and genotoxic potential in the table and the addition of proliferation, morphology, vesicles and sign-aling pathways. Another set of targets for the toxicity screening of NPs, namely proliferation, apoptosis, inflam-mation and genotoxicity, has also been suggested [115].
264.7 macrophages. Lack of cell-specific action, on the other hand was reported by other studies. Membrane damage and mitochondrial damage induced by TiO2, CeO2, and ZnO in sizes between 5 and 20 nm was simi-lar in BEAS-2B and macrophages [116–119] and 35 nm Fe3O4 NPs produced the same profile in murine fibro-blasts and simian COS cells [120].
The potential of screening by phenotypic assays is lim-ited in the identification of new modes of action. Except for the cytotoxicity screening assays, they can only detect a specific cellular effect and the characterization of par-ticle effects depends on the selection of the right assays. This can be seen as disadvantage compared to omics techniques in the untargeted form.
Conclusions
Omics platforms could be useful to identify new path-ways and mechanisms in nanotoxicity not visible in con-ventional testing. This is, however, not always the case for NPs. Studies of polystyrene particles identified cor-responding targets by conventional assays and whole genome transcription arrays [53, 105, 121]. Transcrip-tomic analysis, on the other hand, identified adverse cel-lular effects at lower concentrations than conventional cytotoxicity screening based on ATP content, dehydro-genase activity and cell impedance monitoring [78]. The comparison is complicated by the fact that the regula-tion of genes indicates a potential damage but does not prove that cell damage will actually occur. Researchers reported different regulation patterns by similar NPs in the same cells tested with the same technologies. As omics data were confirmed by phenotypic assays, dispa-rate results between research groups may be caused by different exposure conditions. More frequently reported regulation of inflammation in cellular transcriptom-ics than proteomtranscriptom-ics studies, on the other hand, may be linked to the technology. General (technology-independ-ent) problems with in vitro testing of NPs and issues related to omics technologies that limit their application in nanotoxicity testing are listed in Table 3. Different par-ticle exposure conditions have been suspected to be the reason for inter-study differences in phenotypic assays.
In order to avoid this problem, standard operation proce-dures (SOPs) for preparation of particle suspensions, use of cell lines and preparation of cells have been developed (see for instance overview https://www.nanopartikel.
info/nanoinfo/methodik/401-arbeitsanweisung). The
general use of these SOPs by all researchers may decrease variations between studies. The use of confirmatory assays (e.g. another omics technique, phenotypic assays) is important to demonstrate study quality and verify pathway regulation.
Abbreviations
Ag: silver; Au: gold; BAL: bronchoalveolar lavage fluid; CdTe: cadmium tel-lurite; CNT: carbon nanotube; Co: cobalt; Cu: copper; DCs: dendritic cells; Diff.: differentiated; ECM: extracellular matrix; ER: endoplasmic reticulum; ESI: electrospray ionization; Exp.: exposure; FexOy: iron oxide; FGF-2: fibroblast
growth factor 1; FTIR: Fourrier transform ion cyclotron resonance; GC: gas chromatography; GSH: glutathione; HCS: high content screening; HGF: hepatic growth factor; HPLC: high performance liquid chromatography; HSP: heat shock protein; id: intradermal; ig: intragastral; IMPaLA: Integrated Molecular Pathway Level Analysis; inhal: inhalation; ip: intraperitoneal; IPA: Ingenuity Pathway Analysis; iPEAP: integrative Pathway Enrichment Analysis Platform; it: intratracheal instillation; iv: intravenous; LC: liquid chromatography; MALDI: matrix-assisted laser desorption ionization; MAPK: mitogen activated protein kinase; MSCs: mesenchymal stem cells; MS: mass spectrometry; MWCNT: multi-walled carbon nanotube; NfkB: nuclear factor kappa B; NMR: nuclear magnetic resonance; NP: nanoparticle; oroph: oropharyngeal aspiration; ox.: oxidative; PAK: p21 activated kinases; RISC: RNA-induced silencing complex; SDS: sodium dodecyl sulfate; SiO2: silicium oxide; SOP: standard operation
pro-cedures; SWCNT: single-walled carbon nanotube; TFG-β: tumor growth factor beta; Tech: technique; TiO2: titanium dioxide; TOF: time of flight; WC: tungsten
carbide; ZnO: zinc oxide; ZrO: zirconium oxide.
Acknowledgements
Not applicable.
Competing interests
The authors declare that they have no competing interests.
Availability of data and materials
Not applicable.
Consent for publication
Not applicable.
Ethics approval and consent to participate
Not applicable.
Funding
Studies were supported by the Austrian Science Fund Grant P 22576-B18. Independent from the technology Technology linked
Lack of standardization of particle exposure Request for high sample quality (freezing, protection against degradation)
Sample pre-treatment Expertise in bioinformatics needed for data analysis
Cell type used for testing Lack of standardization of sample preparation
Medium composition Predictive value of the omics techniques not entirely clear
Publisher’s Note
Springer Nature remains neutral with regard to jurisdictional claims in pub-lished maps and institutional affiliations.
Received: 5 July 2017 Accepted: 12 November 2017
References
1. Oberdorster G. Pulmonary effects of inhaled ultrafine particles. Int Arch Occup Environ Health. 2000;74:1–8.
2. Walters C, Pool E, Somerset V. Nanotoxicology: a review. In: Soloneski S, Larramendy M, editors. Toxicology—new aspects to this scientific conundrum. Rijeka: inTech; 2016.
3. Hartung T, van Vliet E, Jaworska J, Bonilla L, Skinner N, Thomas R. Sys-tems toxicology. Altex. 2012;29:119–28.
4. Zook JM, Maccuspie RI, Locascio LE, Halter MD, Elliott JT. Stable nano-particle aggregates/agglomerates of different sizes and the effect of their size on hemolytic cytotoxicity. Nanotoxicology. 2011;5:517–30. 5. Fröhlich E. Cellular targets and mechanisms in the cytotoxic action
of non-biodegradable engineered nanoparticles. Curr Drug Metab. 2013;14:976–88.
6. Kim JS, Adamcakova-Dodd A, O’Shaughnessy PT, Grassian VH, Thorne PS. Effects of copper nanoparticle exposure on host defense in a murine pulmonary infection model. Part Fibre Toxicol. 2011;8:29. 7. Fröhlich E. The role of surface charge in cellular uptake and cytotoxicity
of medical nanoparticles. Int J Nanomed. 2012;7:5577–91. 8. Wang W, Shi Q, Mattes WB, Mendrick DL, Yang X. Translating
extracel-lular microRNA into clinical biomarkers for drug-induced toxicity: from high-throughput profiling to validation. Biomark Med. 2015;9:1177–88. 9. Yamamoto M, Singh A, Sava F, Pui M, Tebbutt SJ, Carlsten C. MicroRNA
expression in response to controlled exposure to diesel exhaust: atten-uation by the antioxidant N-acetylcysteine in a randomized crossover study. Environ Health Perspect. 2013;121:670–5.
10. Choudhuri S. Small noncoding RNAs: biogenesis, function, and emerg-ing significance in toxicology. J Biochem Mol Toxicol. 2010;24:195–216. 11. Ehrlich M. DNA hypomethylation in cancer cells. Epigenomics.
2009;1:239–59.
12. Bannister AJ, Kouzarides T. Regulation of chromatin by histone modifi-cations. Cell Res. 2011;21:381–95.
13. Ropero S, Esteller M. The role of histone deacetylases (HDACs) in human cancer. Mol Oncol. 2007;1:19–25.
14. You JS, Jones PA. Cancer genetics and epigenetics: two sides of the same coin? Cancer Cell. 2012;22:9–20.
15. Kurdyukov S, Bullock M. DNA Methylation analysis: choosing the right method. Biology. 2016;5:3.
16. Ezkurdia I, Juan D, Rodriguez JM, Frankish A, Diekhans M, Harrow J, et al. Multiple evidence strands suggest that there may be as few as 19,000 human protein-coding genes. Hum Mol Genet. 2014;23:5866–78. 17. Tarca AL, Romero R, Draghici S. Analysis of microarray experiments of
gene expression profiling. Am J Obstet Gynecol. 2006;195:373–88. 18. Lai ZW, Yan Y, Caruso F, Nice EC. Emerging techniques in proteomics for
probing nano-bio interactions. ACS Nano. 2012;6:10438–48. 19. Zhang Y, Fonslow BR, Shan B, Baek MC, Yates JR 3rd. Protein analysis by
shotgun/bottom-up proteomics. Chem Rev. 2013;113:2343–94. 20. Chen T, Zhao J, Ma J, Zhu Y. Web resources for mass
spectrometry-based proteomics. Genom Proteom Bioinf. 2015;13:36–9.
21. Monopoli MP, Walczyk D, Campbell A, Elia G, Lynch I, Bombelli FB, et al. Physical–chemical aspects of protein corona: relevance to in vitro and in vivo biological impacts of nanoparticles. J Am Chem Soc. 2011;133:2525–34.
22. Rahman M, Laurent S, Tawil N, Yahia L, Mahmoudi M. Nanoparticle and protein corona. In: Rahman M, Laurent S, Tawil N, Yahia L, Mahmoudi M, editors. Protein-nanoparticle interactions, vol. 15., The bio-nano interface springer series in biophysicsBerlin: Springer; 2013. 23. Cai X, Ramalingam R, Wong HS, Cheng J, Ajuh P, Cheng SH, et al.
Char-acterization of carbon nanotube protein corona by using quantitative proteomics. Nanomedicine. 2013;9:583–93.
24. Pisani C, Gaillard JC, Odorico M, Nyalosaso JL, Charnay C, Guari Y, et al. The timeline of corona formation around silica nanocarriers highlights the role of the protein interactome. Nanoscale. 2017;9:1840–51. 25. Schaffler M, Semmler-Behnke M, Sarioglu H, Takenaka S, Wenk A, Schleh
C, et al. Serum protein identification and quantification of the corona of 5, 15 and 80 nm gold nanoparticles. Nanotechnology. 2013;24:265103. 26. Schottler S, Becker G, Winzen S, Steinbach T, Mohr K, Landfester K,
et al. Protein adsorption is required for stealth effect of poly(ethylene glycol)- and poly(phosphoester)-coated nanocarriers. Nat Nanotechnol. 2016;11:372–7.
27. Shannahan JH, Lai X, Ke PC, Podila R, Brown JM, Witzmann FA. Silver nanoparticle protein corona composition in cell culture media. PLoS ONE. 2013;8:e74001.
28. Vogt C, Pernemalm M, Kohonen P, Laurent S, Hultenby K, Vahter M, et al. Proteomics analysis reveals distinct corona composition on magnetic nanoparticles with different surface coatings: implications for interac-tions with primary human macrophages. PLoS ONE. 2015;10:e0129008. 29. Wohlleben W, Driessen MD, Raesch S, Schaefer UF, Schulze C, Vacano
B, et al. Influence of agglomeration and specific lung lining lipid/ protein interaction on short-term inhalation toxicity. Nanotoxicology. 2016;10:970–80.
30. De La Luz-Hdez K. Metabolomics and mammalian cell culture. In: Roessner U, editor. Metabolomics. Rijeka: InTech Europe; 2012. p. 3–18. 31. Ramirez T, Daneshian M, Kamp H, Bois FY, Clench MR, Coen M,
et al. Metabolomics in toxicology and preclinical research. Altex. 2013;30:209–25.
32. Murgia A, Mancuso L, Manis C, Caboni P, Cao G. GC-MS metabolomics analysis of mesenchymal stem cells treated with copper oxide nano-particles. Toxicol Mech Methods. 2016;26:611–9.
33. Esther RJ, Bhattacharya R, Ruan M, Bolander ME, Mukhopadhyay D, Sarkar G, et al. Gold nanoparticles do not affect the global transcrip-tional program of human umbilical vein endothelial cells: a DNA-micro-array analysis. J Biomed Nanotechnol. 2005;1:328–35.
34. Blaber SP, Hill CJ, Webster RA, Say JM, Brown LJ, Wang SC, et al. Effect of labeling with iron oxide particles or nanodiamonds on the functionality of adipose-derived mesenchymal stem cells. PLoS ONE. 2013;8:e52997. 35. Gong C, Tao G, Yang L, Liu J, Liu Q, Zhuang Z. SiO(2) nanoparticles
induce global genomic hypomethylation in HaCaT cells. Biochem Biophys Res Commun. 2010;397:397–400.
36. Lu X, Miousse IR, Pirela SV, Melnyk S, Koturbash I, Demokritou P. Short-term exposure to engineered nanomaterials affects cellular epigenome. Nanotoxicology. 2016;10:140–50.
37. Patil NA, Gade WN, Deobagkar DD. Epigenetic modulation upon exposure of lung fibroblasts to TiO2 and ZnO nanoparticles: alterations
in DNA methylation. Int J Nanomed. 2016;11:4509–19.
38. Qian Y, Zhang J, Hu Q, Xu M, Chen Y, Hu G, et al. Silver nanoparticle-induced hemoglobin decrease involves alteration of histone 3 methyla-tion status. Biomaterials. 2015;70:12–22.
39. Lu X, Miousse IR, Pirela SV, Moore JK, Melnyk S, Koturbash I, et al. In vivo epigenetic effects induced by engineered nanomaterials: a case study of copper oxide and laser printer-emitted engineered nanoparticles. Nanotoxicology. 2016;10:629–39.
40. Tabish AM, Poels K, Byun HM, Luyts K, Baccarelli AA, Martens J, et al. Changes in DNA methylation in mouse lungs after a single intra-tracheal administration of nanomaterials. PLoS ONE. 2017;12:e0169886. 41. Sule N, Singh R, Srivastava DK. Alternative modes of binding of
recom-binant human histone deacetylase 8 to colloidal gold nanoparticles. J Biomed Nanotechnol. 2008;4:463–8.
42. Choi AO, Brown SE, Szyf M, Maysinger D. Quantum dot-induced epige-netic and genotoxic changes in human breast cancer cells. J Mol Med (Berl). 2008;86:291–302.
43. Chen T, Yan J, Li Y. Genotoxicity of titanium dioxide nanoparticles. J Food Drug Anal. 2014;22:95–104.
44. Kwon JY, Koedrith P, Seo YR. Current investigations into the genotoxic-ity of zinc oxide and silica nanoparticles in mammalian models in vitro and in vivo: carcinogenic/genotoxic potential, relevant mechanisms and biomarkers, artifacts, and limitations. Int J Nanomed. 2014;9(Suppl 2):271–86.