MoocViz: A Large Scale, Open Access, Collaborative, Data
Analytics Platform for MOOCs
Franck Dernoncourt
Colin Taylor
Una-May O’Reilly
Kayan Veeramachaneni
Sherwin Wu
MITChuong Do
Coursera[email protected]
Sherif Halawa
Stanford U.[email protected]
ABSTRACT
In this paper we present an open access large scale analytics platform that helps researchers analyze MOOC data from multiple platforms with out the need to share the data. It allows researchers to share scripts/effort, compare results and attempts to engage the community to achieve shared educational science goals. The platform utilizes some well known tools and packages and provides multiple levels of access to address a wide variety of needs around the data. We demonstrate the platforms capability by analyzing data from two MOOCs, one from coursera (offered by Stanford University) and one from edX (offered by MITx). This is the first time two courses from two platforms have been jointly analyzed. The analysis and the platform is made possible due to joint adoption of a data model called MoocDB.
1.
INTRODUCTION
In the current MOOC ecosystem there exist multiple plat-forms, e.g. Coursera and edX, that support content-providers offering extremely rich, evolving and complex learning en-vironments. The data generated in the course of interac-tions between course users, content and platform promises to provide education researchers with invaluable insights about how students respond to the “substance and form” of con-tent at a very fine granularity: every online browsing event is recorded [1, 5]. While this promise is compelling, due to the complexity of each platform (e.g. data is captured from multiple sources) and innate differences among them, conducting MOOC research with one or multiple platforms’ behavioral data, or interacting with the data in even simple ways is an overwhelming challenge. When research goals in-clude understanding learning independent of platforms, de-ciphering the impact of a platform or content delivery style on learning, or drawing insights from multiple courses across platforms, a slew of related technical problems need to be addressed: how can we make it as easy as possible to draw
.
insights across platforms and across courses when the data is so large scale and heterogenous? How is it possible to en-able cross-course, cross-platform, collaborative comparisons without needing to share the data, given access is granted only within an institution?
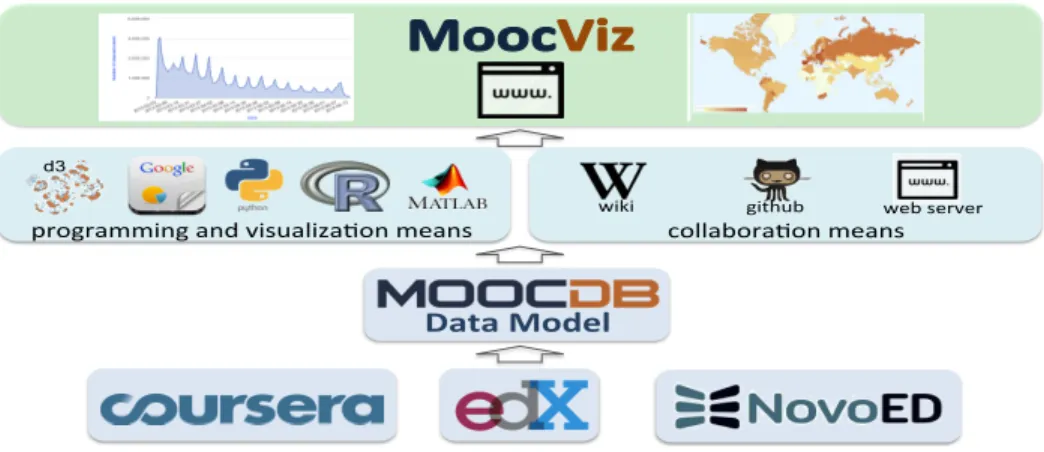
In this paper, we presentMoocViz, see Figure 1, a cross course, cross platform, analytics framework for MOOC ed-ucation research that does not require researchers to share data yet allows them to reuse software and contribute pro-grams for others to use, while generating consistent, rele-vant statistics and insightful visualizations very efficiently.
MoocVizwill always be a work in progress because it of its
community underpinnings.
MoocDB
Data Model
As the first step, we have developed a data model that at-tempts to capture all the nuances of the web based data emanating from MOOC platforms [7]. Creating data mod-els to capture user behavior in an e-learning environment has been tackled by a number of researchers in different contexts, for example [2]. A good review of user model-ing systems is provided in [6]. The MoocDB data model originally organized MITx data generated from the MITx platform that has now transitioned to edX. Now, in recent months, the authors have adapted it to also capture the data subtleties and idiosyncrasies of both edX and Coursera plat-forms. A periodically updated technical report explains the data model, all the fields and how they are assembled for each platform. Complete documentation forMoocDBand its data model will perpetually updated via the wiki site
http://moocdb.csail.mit.edu/wiki. The updated model has allowed the authors, from three different institutions, to collaboratively re-organized the source data from multi-ple MITx and Stanford University courses and populate pri-vate, independent course databases at their respective home institutions. These datasets will be the basis of this paper’s demonstration of MoocViz. The wide adoption and ap-plicability of MoocVizwill depend on the adoption of the
MoocDB data model, see [7], by different platforms.
2.
MOOCVIZ
Means of Development
MoocVizrelies upon collaboration-enabling software, presently
repos-d3
wiki$ github$ web$server$
Data$Model$
collabora2on$means$ programming$and$visualiza2on$means$
Figure 1: The MoocViz collaborative, open access analytics framework. Bottom up: Multiple platforms are har-monized through the MoocDB data model. Analytic programming languages and software packages offer means of visualization and statistical analysis while common tools such as a wiki (for documentation), a repository facility (for code) and web server offer means of collaboration. MoocViz generates visualizations by scripts which generate HTML code that is served then viewed from a web browser.
itory, and a web server. These collectively support shar-ing the documentation, sharshar-ing the code base and provid-ing a backend to serve HTML visualizations. A current private release of the software is athttps://github.com/ organizations/MOOCdb. The Git repository will allow com-munity members to contribute, browse and download open access scripts for general use. The web server is best local-ized when visualizations are part of the research process. For visualizations intended to be accessed publicly, a community
orMoocVizweb server has the responsibility of displaying
them.
MoocVizalso relies upon software packages - both open
source or commercial that function as analytic and visualiza-tion tools as well as analytic programming language support from R, Python and/or Matlab. These facilitate high level problem-specific scripting for visualization and analysis.
These means and the MoocDBmodel have enabled us to develop MoocViz with relative ease in terms of its re-usability and accessibility.
MoocViz
User Types
MoocVizis designed to accommodate the diverse needs of
five types of users: course instructors, education researchers, arms-length observers, the technology-savvy crowd and MOOC providers. These user types will rely upon the diversity of the software offered for analytics and visualization. Each will engageMoocVizwith a different set of purposes. We envision that arms-length observers will investigate the vi-sualization library via theMoocViz website. Members of the crowd could potential aid investigative efforts by voting on the utility of different visualization or contributing soft-ware from other domains that has applicability to MOOC analysis.
MoocViz
Script Process
MoocVizscripts create visualizations from data extractions.
They are written in any programming language, but must adhere to a simple but consistent interface. This ensures that all scripts can be invoked in a standard way. Things such as the credentials of the input database are
standard-ized. We have a generic template, written in Python, for an analytic script in our framework. The template is as follows:
• A database connector is provided at the top.
• User writes an sql script to extract raw data from the database.
• The raw data is then processed into apredocumented data structure.
• An option to download the processed data to a CSV file is provided.
• The data is adapted to a required format forGoogle Charts orD3.js
• The could be formulated to plug into a statistical anal-ysis package
The output file format of every visualization script is HTML. The HTML programmatically describes the plot or anima-tion. Obviously, HTML files are viewable through a web browser. And, when they are specifically deposited in the
MoocVizrepository (by invoking an option to publish them
when a script is executed), theMoocVizwebsite will pro-vide access to them. The website is planned to allow for both private and public result viewing. It will have features which help organize the visualization and browsing of script results to support more interactive analysis. For collecting feedback on a visualization, the website could even will allow viewers to up-vote and down-vote visualizations to provide feedback on their usefulness.
MoocViz
Interactions
Interactions with the framework take place in multiple ways:
• The MOOC platform or content providers format the raw data into the MoocDBmodel. This model will act as be referenced by all scripts.
• A software specialist can develop a visualization script which is intended to run on data organized according to the MoocDB data model. The crowd may con-tribute to (or even write completely) these scripts.
• A researcher can execute any script on the data which s/he controls. All scripts will share a common inter-face in terms of inputs and in terms of generating a visualization represented as HTML code. This HTML code will display web-based graphics in a browser.
• A research can publish his/her visualization to the
MoocVizcommunity repository for others to view.
• Arms-length observers can view visualizations in the community repository through a web interface.
• The visualization script library grows in an open-ended way; researchers and the “crowd” can continuously con-tribute to and refine it.
Remarks
The very first step of the joint collaboration was compos-ing scripts that re-organized Coursera-Stanford source data into the MoocDB data model. Unsurprisingly, since the platforms were independently designed and implemented, this source data did not at all look like MIT’s. However, despite these differences, the updated schema nonetheless unified the differences. This unification is explained by that fact that the data model targets behavioral analysis which fundamentally relies upon elucidation of the path a stu-dent self-navigates as s/he interacts with course material. In fact, both platforms record this fundamental informa-tion, it is simply manifested in different ways. Therefore different scripts between the platforms were required but they could arrive at the same data model. Strong diligence is required however to ensure that re-organization software codes, so called “piping scripts” are functionally consistent across platforms. That is, how a source data concept is transcribed into a model field is the same in both MIT and Coursera-Stanford scripts.
Data-driven education research will rest upon replicability and comparison. This implies it is very important to have consistent variable definitions, modeling methods, statisti-cal tests and even visualizations. Without a common data model, this consistency would rely upon excellent documen-tation and diligence to independently replicate the complete context of a set of results. MoocViz, by way of using the
MoocDB data model, eliminates this level of replication.
From the lowest level, i.e. closest to the original data, up-wards, consistency can be taken for granted, under the as-sumption that the data model level is completely consistent across platforms and courses.
Cross-course or cross-platform comparisons can be like ap-ples to oranges - apparently asymmetric. Consider a 6 week Stanford course on cryptography vs. MITx’s 12-week course on circuits and electronics. If one tried to compare them at the source data levels, the minute and gross differences would be hard to reconcile. However, once two quite dif-ferent courses at source data are both re-organized along a common data model, practical comparisons can be made and the comparison is conceptually easier.
3.
DEMONSTRATION
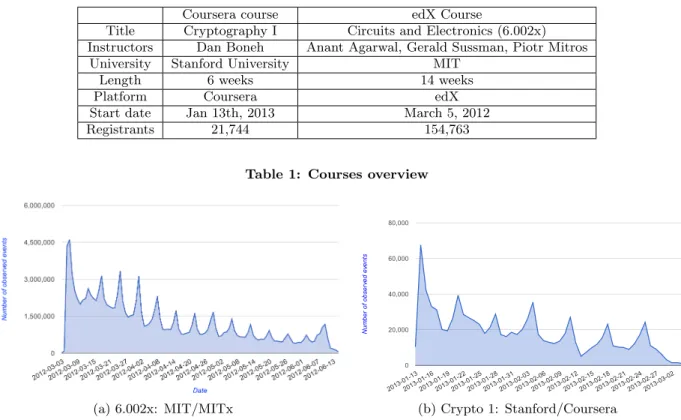
Our teams have converged on the data model and have populated the model with the data from the courses we each have. Table 1 presents details for the two courses that we use in this paper to demonstrate the analytics framework.
Resource id Content Medium
1 Lecture Text
2 Lecture Video
3 Tutorial Text
4 Tutorial Video
5 Informational Any
6 Problems Any
7 Wiki Any
8 Forum Any
9 Profile Any
10 Index Any
11 Book Any
12 Survey Any
13 Home Any
14 Other Any
3.1
Interactive visual analytics
Our first set of analytic scripts derive simple analyses and provide interactive visuals via the google chartsapi[?]. A number of scripts have been released (beta version) for course data analysis and are available in our GitHub. Fig-ure 2 and 3 show the outcomes of two different ones. Both scripts were written at MIT and then downloaded by Stan-ford and applied to their data set, thus demonstrating the shared nature of these analytics. The first figure shows the ratio of number of students who earned certificate to the number of students who registered in the course on a per country basis for both the courses. For both courses, we see what we have typically seen in most MOOCs, spikes just before the submission deadline and a weekly cycle and the fall in the size of the spikes due to students leaving the course. This curve is likely typical of any MOOC that has weekly assignments. The second figure shows the number of observing events as a function of the day.
3.2
Descriptive analysis of resource use
We are interested in the question of how different re-source types are used by different cohorts of students in these courses. Specifically, how much time do students spend on each of the resource type during the entire course? We limit our analysis in this paper to students who earned a certifi-cate, in other words successfully completed the course. For each student we identify the country based on the IP address s/he uses to access the website. We identified the cohorts of students from a subset of the countries. We selected Brazil (BR), China (CN), Germany(DE), India (IN), Poland (PL), Russia (RU), and United States (US).
Resource typesTo analyze resource use across platforms, we had to first come up with common generalizable resource
types across both the platforms. Table 3.2 shows the final resource types that we converged upon for both the plat-forms. We had a total of 14 different types. There were 3,000 number of unique URLs in the edX course and there were 365 number of unique URLs in the Coursera course. Based on mutually agreed resource types these URLs were categorized into 14 different resource types.
Measurement of durationTo measure duration spent on each page, we applied a set of heuristics. First, we assumed the difference between the two timestamps for two consecu-tive browsing events for the same student/user was the dura-tion. This duration was assumed to apply to theU RLwhere the student was. This is arguably a noisy estimate because
6/30/13 francky.me/mit/moocdb/all/user_certifcate_per_country_normalized_cutoff100.html
francky.me/mit/moocdb/all/user_certifcate_per_country_normalized_cutoff100.html 1/1
Percentage of students who got a certificate
(a) 6.002x: MIT/MITx (b) Crypto 1: Stanford/Coursera
Figure 2: Left plot shows, via coloring, the ratio of certificate winners to the number of registrants on a per country basis for 6.002x offered via edX platform. Hungary (16.21%), Spain (14.55%) and Latvia (14.40%) are the highest. Right plot shows, via coloring, the ratio of certificate winners to the number of registrants on a per country basis for the Stanford cryptography course offered via Coursera. Russia (17.24%), Netherlands (16.43%) and Germany (12.95%) are highest.
Coursera course edX Course
Title Cryptography I Circuits and Electronics (6.002x) Instructors Dan Boneh Anant Agarwal, Gerald Sussman, Piotr Mitros
University Stanford University MIT
Length 6 weeks 14 weeks
Platform Coursera edX
Start date Jan 13th, 2013 March 5, 2012
Registrants 21,744 154,763
Table 1: Courses overview
(a) 6.002x: MIT/MITx
10/14/13 observed_events_per_day_date_label.html
file:///C:/Users/francky/Downloads/output (1)/output/observed_events_per_day_date_label.html 1/1
Observed events by date
Observed events by date
Number of observed events
2013-01 -13 2013-01
-16 2013-01
-19 2013-01
-22 2013-01
-25 2013-01
-28 2013-01
-31 2013-02
-03 2013-02
-06 2013-02
-09 2013-02
-12 2013-02
-15 2013-02
-18 2013-02
-21 2013-02
-24 2013-02
-27 2013-03
-02 0
20,000 40,000 60,000 80,000
Date
N
u
m
b
e
r
o
f
o
b
se
rv
e
d
e
ve
n
ts
(b) Crypto 1: Stanford/Coursera
Figure 3: Example of interactive visual analytics showing the number of observing events by day.
this does not necessarily imply that the student’s attention was completely on the webpage given the possibility of other distractions like chat windows, other tabs etc. The problem could not be resolved unless cannot be solved a student’s ac-tivities are more closely tracked (e.g. via cameras). Second, the student might keep a webpage open without physically being present at the computer. To solve this issue we uti-lize two heuristics: (a) we remove all the events that are longer than a certain pre-specified threshold (1 hr) (b) for
every page we evaluate the median time any student spends on the page and replace the duration for events that cross the threshold with this quantity. Roughly only 1% of events cross the specified threshold. We are currently investigating a number of strategies to estimate duration on a webpage.
Having settled on resource types and a method to esti-mate duration for each event, we proceed to attempt to un-derstand whether there is a difference in the amount of time different student cohorts spend on different resource types.
US IN CN RU DE PL BR 0%
10% 20% 30% 40% 50% 60% 70% 80% 90% 100%
lecture tutorial informational problem exam wiki profile book other
(a) 6.002x: MIT/MITx
US IN CN RU DE PL BR 0%
10% 20% 30% 40% 50% 60% 70% 80% 90% 100%
lecture exam wiki forum index home other
(b) Crypto 1: Stanford/Coursera
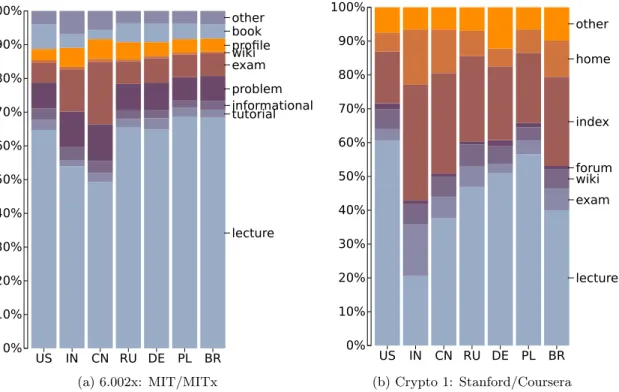
Figure 4: Differences in relative use of resources by students from different countries. A student’s country is derived from the IP address s/he commonly logs in from.
A B C
0% 10% 20% 30% 40% 50% 60% 70% 80% 90% 100%
lecture tutorial informational problem exam wiki profile book other
(a) 6.002x: MIT/MITx
A B C
0% 10% 20% 30% 40% 50% 60% 70% 80% 90% 100%
lecture exam wiki forum index home other
(b) Crypto 1: Stanford/Coursera
Aggregate statistics: We aggregate the duration informa-tion per student per resource in two different ways.
Relative duration for each resource over course: For each stu-dent, we aggregate the total time s/he spent on each of the 14 resource types during the course. Note that only a sub-set of resources are available on each platform for these two courses. Then for every student we normalize the time spent on each resource by the total time spent by the student in the entire course. This measures the relative time s/he spends on each resource and gives equal importance to each stu-dent irrespective of their total time spent in the course. For a given student cohort, we assemble this relative duration for each resource as a vector. The values are in percentages. We then average these numbers by resource type and plot them as bar plots shown in Figure 4 and 5. We show plots for both Stanford course offered through coursera and the MITx course offered through edX. To visually present this information we useD3.js[?].
Absolute duration for each resource over course: For each stu-dent, we simply aggregate the total time s/he spent one each resource. We then assemble these duration vectors on a per student basis. For a particular resource type, and two or more student cohorts we perform one-way ANOVA to ana-lyze the differences. Below we present our analysis on two different cohort types.
3.3
Statistical analysis of student cohorts
Next with the same dataset we analyze the difference be-tween multiple student cohorts via statistical tests. The scripts connect to a statistical package and compare the student resource use by grades and by country under both courses offered by different platforms. Cohorts-by-country
In Figure 4 we present the bar plots on a per country basis. At this aggregate level this allow differences in resource use between students from different countries to be appraised. For example, pronounced difference is apparent in the rel-ative use of time for lectures and exams for students from India and China. The plots also indicate that students spent higher proportion of their time on lectures in the edX course. This may be an artifact of interleaving lecture quizzes with videos in the edX course1. Also, Coursera makes it easy for students to download lecture videos and this activity is not in the data. We present plots as demonstrations of poten-tial analyses rather than as in depth study results. The two courses we chose were different topics, different length and confounding variables would normally have been controlled. Second, we also performed analyses of variance (ANOVA) and multiple testing using the Tukey-Kramer or also known as Tukey’s honestly significant difference (HSD) method on the raw duration aggregates [4]. To do this we aggregated the raw duration per student per resource in the course. We then assembled for each student the aggregate duration vectors and perform 1-way ANOVA [3] as well as Tukey-Kramer tests for all student cohorts.
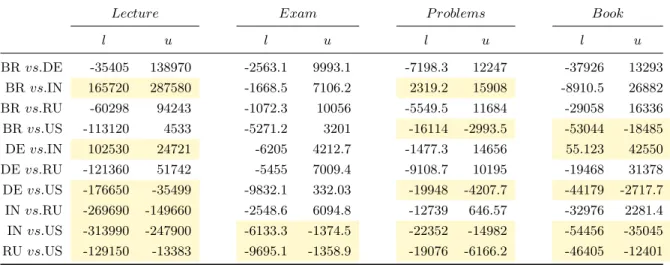
The results are shown in Tables 2 and 3 for EDx and Coursera respectively. In the table, each row presents a test and the two entries [xl, xu] represent the 95% confidence
in-terval between true differences of the mean. Any time the confidence interval does not contain 0 the difference is sig-nificant at α = 0.05. The differences that are significant are shown in highlighted color. We study the resource types
lecture and exam for Coursera, and lecture,exam, problem 1
At this time we do not differentiate the two
and book for edX. We choose Brazil (BR), Germany (DE), Indian (IN), Russia (RU) and United States (US) as a sig-nificant number of students come from these countries, and we want to compare countries with varying levels of English. We can see that India has the most distinctive pattern with respect to the other countries for all resource types.
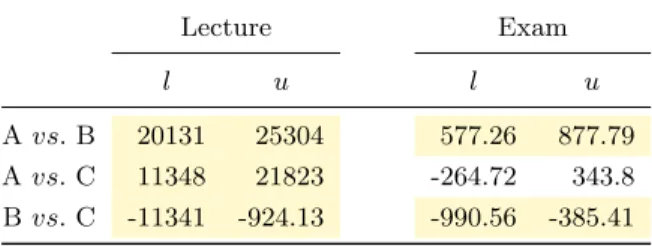
Cohorts-by-grade We performed the same analysis with student cohorts based on grades. Since courses use three let-ter as a final grade, it means we have three student cohorts, each of them corresponding to the letter A, B or C.
Figure 5 presents the duration according to the grade and resource type. Students who received a C tends to spend a higher proportion of their time on exam but less on lecture. This visual intuition is confirmed by the Tukey ˝UKramer method whose results are presented in Tables 4 and 5.
4.
CONCLUSIONS
In this paper, we demonstrated a cross-platform open ac-cess analytics framework. The framework builds upon the joint adoption of a data model. We have developed a number of tools, frameworks to enable an open, large scale analyt-ics framework. We are working with the larger educational science community and releasing the scripts.
To demonstrate the capabilities of the platform, we chose two courses, one from Stanford/Coursera and one from MITx/edX and performed three different types of analytics: simple and interactive, descriptive statistics and comparative statistics.
Acknowledgements
This work was supported by Quanta Research.
5.
REFERENCES
[1] L. Breslow, D. E. Pritchard, J. DeBoer, G. S. Stump, and A. D. Ho. Studying learning in the worldwide classroom: Research into edx’s first mooc.
[2] P. Brusilovsky, S. Sosnovsky, and O. Shcherbinina. User modeling in a distributed e-learning architecture. In
User Modeling 2005, pages 387–391. Springer, 2005. [3] G. V. Glass and K. D. Hopkins.Statistical methods in
education and psychology. Prentice-Hall Englewood Cliffs, NJ, 1970.
[4] Y. Hochberg and A. C. Tamhane.Multiple comparison procedures. John Wiley & Sons, Inc., 1987.
[5] R. F. Kizilcec, C. Piech, and E. Schneider. Deconstructing disengagement: analyzing learner subpopulations in massive open online courses. In
Proceedings of the Third International Conference on Learning Analytics and Knowledge, pages 170–179. ACM, 2013.
[6] A. Kobsa. Generic user modeling systems. InThe adaptive web, pages 136–154. Springer, 2007. [7] K. Veeramachaneni, F. Dernoncourt, C. Taylor,
Z. Pardos, and U.-M. O ˜OReilly. Moocdb: Developing data standards for mooc data science. InAIED 2013 Workshops Proceedings Volume, page 17, 2013.
Lecture Exam P roblems Book
l u l u l u l u
BRvs.DE -35405 138970 -2563.1 9993.1 -7198.3 12247 -37926 13293 BRvs.IN 165720 287580 -1668.5 7106.2 2319.2 15908 -8910.5 26882 BRvs.RU -60298 94243 -1072.3 10056 -5549.5 11684 -29058 16336 BRvs.US -113120 4533 -5271.2 3201 -16114 -2993.5 -53044 -18485 DEvs.IN 102530 24721 -6205 4212.7 -1477.3 14656 55.123 42550 DEvs.RU -121360 51742 -5455 7009.4 -9108.7 10195 -19468 31378 DEvs.US -176650 -35499 -9832.1 332.03 -19948 -4207.7 -44179 -2717.7 INvs.RU -269690 -149660 -2548.6 6094.8 -12739 646.57 -32976 2281.4 INvs.US -313990 -247900 -6133.3 -1374.5 -22352 -14982 -54456 -35045 RUvs.US -129150 -13383 -9695.1 -1358.9 -19076 -6166.2 -46405 -12401
Table 2: Analysis of the duration spent on resource type by country-based student cohorts for the edX course. The value of each cell is the 95% confidence interval given by the Tukey-Kramer method for the true difference of the means of the duration for the two cohorts indicated in the first column, e.g. students BR and DE in the first row. Cells with colored background indicate that the two cohorts have a significant difference in terms of mean of duration, which corresponds to the interval encompassing 0.
Lecture Exam
l u l u
BRvs.DE -28253 -1117.2 -1024.1 592.15 BRvs.IN -461.58 21961 -1335.2 0.2361 BRvs.RU -20329 3236.1 -758.69 644.88 BRvs.US -24271 -2475.1 -685.78 612.37] DEvs.IN 15939 34930 -1017.1 114 DEvs.RU -4025.8 16302 -446.33 764.43 DEvs.US -7811.2 10435 -364.14 722.64 INvs.RU -25998 -12595 211.44 1009.8 INvs.US -29106 -19138 333.96 927.65 RUvs.US -10989 1337 -346.88 387.29
Table 3: Analysis of the duration spent on resource type by country-based student cohorts for the Coursera course. See Table 2’s caption for the explanation on how to read the table.
Lecture Exam Problems Book
l u l u l u l u
Avs.B -16144 22245 -1346 1117.5 -3689.6 315.26 -13797 -3978.9 Avs.C 64383 119560 3935.6 7476.6 8216 13972 -2728.8 11383 Bvs.C 59184 118660 3912 7728.6 9679 15884 5609.6 20820
Table 4: Analysis of the duration spent on resource type by grade-based student cohorts for the edX course. See Table 2’s caption for the explanation on how to read the table.
Lecture Exam
l u l u
Avs.B 20131 25304 577.26 877.79 Avs.C 11348 21823 -264.72 343.8 Bvs.C -11341 -924.13 -990.56 -385.41
Table 5: Analysis of the duration spent on resource type by grade-based student cohorts for the Coursera course. See Table 2’s caption for the explanation on how to read the table.