JTERA (Jurnal Teknologi Rekayasa), Vol. 4, No. 1, Juni 2019, Hal. 99-108 Terakreditasi “Peringkat 3” oleh Kemenristekdikti, Nomor SK: 30/E/KPT/2018
DOI: 10.31544/jtera.v4.i1.2019.99-108
99 e-ISSN 2548-8678
Diterima: 10 April 2019; Direvisi: 6 Mei 2019; Disetujui: 29 Mei 2019 JTERA, Vol. 4, No. 1, Juni 2019
© 2019 JTERA (Jurnal Teknologi Rekayasa), Politeknik Sukabumi
Compact Fluorescence Lamp Based on Power
Electronics Technology: Its Advantages and
Disadvantages
Nana Heryana
1, Handoko Rusiana Iskandar
2, Bambang Widodo
3, Robinson Purba
4 1,3,4Magister Teknik Elektro, Univesitas Kristen Indonesia
Jl. Mayjen Sutoyo No. 2, Cawang, Kramatjati, Jakarta timur, DKI Jakarta, Indonesia
2
Jurusan Teknik Elektro, Fakultas Teknik, Universitas Jenderal Acmad Yani Jl. Terusan Jenderal Sudirman, Cimahi, Jawa Barat 40285, Indonesia
Abstrak
Lampu swabalast berbasis teknologi elektronika daya terbukti dapat menghemat energi listrik dalam sistem pencahayaan. Seperti umumnya peralatan listrik yang berbasis teknologi elektronika daya, rangkaian ekivalen lampu ini merupakan beban non linier, sehingga arus masukannya non sinusoidal dan mengandung harmonik. Makalah ini membahas keuntungan dan kerugian penggunaan lampu swabalast serta mengusulkan pembubuhan label nilai THD terkait regulasi peredaran lampu swabalast. Total Harmonic Distortion (THD) merupakan metode yang digunakan untuk mencari nilai prosentase antara total komponen harmonisa dengan komponen fundamentalnya. Semakin besar prosentase THD ini menyebabkan semakin besarnya risiko kerusakan peralatan akibat harmonisa yang terjadi pada arus maupun tegangan. Hasil pengujian di laboratorium menunjukkan sampel lampu swabalast mempunyai THD arus masukan 67,7% rms. THD arus yang tinggi ini dapat menurunkan kualitas daya listrik dan memungkinkan terjadinya kesalahan pembacaan meter. Beberapa hasil eksperimen disertakan dan dianalisis untuk menunjukkan validitas dari konsep yang dipaparkan.
Kata kunci: elektronika daya, harmonik, lampu swabalat, THD
Abstract
Power-electronics based Compact Fluorescent Lamps (CFLs) have been proven to reduce electrical energy consumption for lighting purpose. As in common power-electronics-based electrical devices, CFLs can be categorized as non-linear loads. Therefore, the input current has a non-sinusoidal waveform and contains harmonics. This paper discusses the advantages and disadvantages of CFL application and proposes the attachment of THD value to the product package in order to improve the marketing policy. Total Harmonic Distortion (THD) is a method used to find the percentage value between the total harmonic components and their fundamental components. The percentage of THD causes a greater risk of damage to equipment due to harmonics that occur in current and voltage. Laboratory testing shows that a CFL sample has THD of the input current as high as 67.7%. This THD is relatively high and may degrade electrical power quality. Moreover, it could lead to the misreading of electrical power and energy meter. Several experiment results are shown and analyzed to confirm the validity of the discussed matter.
Keywords: power electronics, harmonic, CFLs, THD
I.
INTRODUCTION
Increasing energy demand, reduced fossil fuels, and the need to reduce global warming have raised awareness of all parties about the importance of saving and energy efficiency. This topic is a top priority in the community, causing government policies, scientific research, and commercial
industrial programs in all countries of the world to lead to the application of energy conservation [1]. In Indonesia, the issue of energy conservation has received significant attention in the past ten years, including the issuance of government regulations and the Minister of Energy and Mineral Resources of the Republic of Indonesia (EMR RI) regarding conservation and energy management [2], [3].
100
In the field of conservation of electrical energy, power electronics is one of the key technologies to save and improve the efficiency of electrical energy. One study that discussed the potential of power electronics technology in four main application fields, namely in building and lighting systems, power supply systems, smart grids and control systems in the commercial industry, proved that electricity consumption could be reduced by up to 25% [4].
Particularly related to the conservation of electrical energy in lighting systems, currently in Indonesia, almost all residential lighting systems and commercial industries install self-powered lamp based on power electronics technology. CFLs are proven to be energy-saving lamps, but what needs to be understood is that electrical equipment based on power electronics, such as these lamps has input currents that are non-sinusoidal and contain harmonics [5], [6]. When lighting systems in Indonesia use almost all CFLs, it is believed that there are problems with power quality in electric power systems [7].
Government regulations related to affixing energy-saving labels by authorized parties before being circulated by producers are regulated by the Republic of Indonesia Minister of Energy and Mineral Resources Regulation No. 18 of 2014 [8]. In this regulation, self-balancing lamps must be labeled with energy-saving labels and include efficacy values (lumens or watts), but there is no obligation to include Total Harmonic Distortion (THD), which is generally used as a reference parameter to determine the power quality of the electrical equipment used. This parameter is important to include because a high THD will cause a decrease in power quality and allow for meter reading errors.
Several studies have been conducted relating to the harmonic analysis of LED lights and several methods have also been used to detect THD activity. This paper aims to conduct experimental tests in the laboratory and analyze the percentage output of current and voltage THD on CFL lamps according to applicable standards.
This paper discusses the advantages and disadvantages of CFLs and proposes affixing the THD value label related to the regulation of the use of CFLs in Indonesia. Physical forms, replacement circuits, and non-sinusoidal current wave analysis from CFLs are indicated. Some of the advantages and disadvantages of using CFLs are discussed with reference to several references. We also verify through experiments or laboratory tests on samples of lamps tested and analyze harmonic input currents. Finally, we propose the parameters that
need to be considered related to the regulation of the use of CFLs so that the government can make good and firm regulations so that the CFLs circulating in Indonesia are energy-efficient lamps with low THD.
II.
R
ESEARCHM
ETHODThe CFLs is the term energy-saving lamp based on power electronics technology. This requirement is in several government regulations and EMR ministers, related to the circulation and trade of lights in Indonesia [8]. In reference [5]-[7], these lamps are called CFLs, which are energy-saving lamps that are compactly designed and are a connection between lights, power electronic ballasts, drives, and home lights.
A. Equivalent Series of CFL
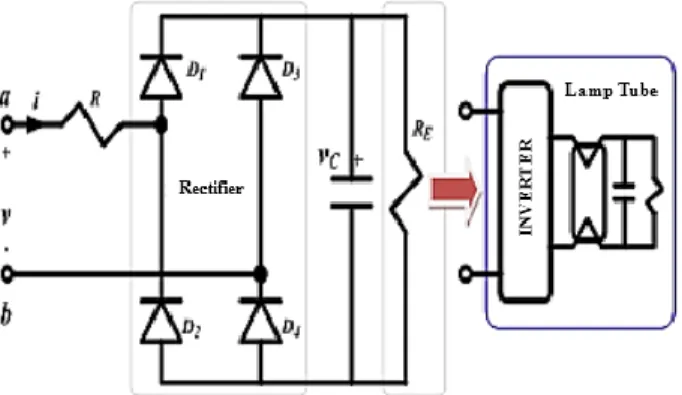
The equivalent circuit of the CFL is generally as shown in Figure 1. In the figure, there is a one-phase rectifier diode bridge circuit which functions to convert the alternating current source (AC) into direct current (DC). On the input side of the rectifier, there is R which shows AC equivalent resistance and the value is very small so it is generally ignored, while capacitor C is used as the dc voltage leveler on the output side. Then the rectifier output is connected to the lamp tube inverter. The lamp tube inverter can be modeled as parallel RE resistance because generally, this inverter works at a frequency of 10 – 40 kHz so it is considered a constant load installed on the dc bus bar [7].
B. Current Analysis of CFL
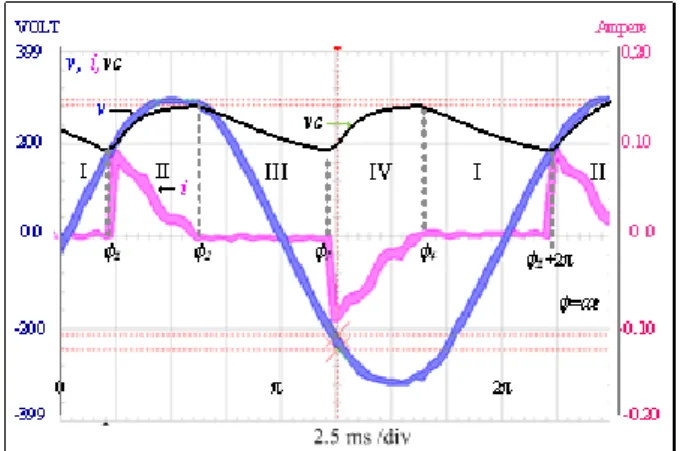
Analysis of the CFL input current is carried out by taking into account Figures 2 and Figure 3. Figure 2 shows the input current i, input voltage v and DC output voltage (voltage capacitor VC). Figure 3 shows the equivalent circuit when the input voltage is in a positive cycle condition (3.a) and a negative cycle (3.b). The analysis is as follows:
101 Figure 2. Voltage wave, input current, and DC output
voltage CFL
Figure 3. The current in the equivalent circuit of the CFL: (a) positive cycle (b) negative cycle 1. Segment I (4<<1+2π): this condition occurs
in negative and positive cycles, VC is more positive than v, all diodes are not conduction, so i = 0, and discharge mode occurs, which capacitor releases charge through RE equivalent resistance (lamp tube inverter).
2. Segment II (1<<2): this condition occurs in a positive cycle, v is more positive than VC, so D1 and D4 conduction, and current i flows to fill the capacitor (charge mode) and gives the power supply to the lamp tube inverter.
3. Segment III (2<<3): this condition occurs in positive and negative cycles, all diodes are not conduction, discharge mode, similar to conditions in the segment I.
4. Segment IV (2<<3): this condition occurs when the cycle is negative, v is more positive compared to VC, D2, and D3 conduction, and current I flows to fill the capacitor (charge mode) and gives the inverter power supply lamp tube.
This section has shown that by analyzing the current per segment, a non-sinusoidal input current wave can be understood as shown in Figure 3. The reason is that in the CFL there is a one-phase rectifier with dc capacitor leveling which has non-linear characteristics. This wave contains harmonics, which can reduce power quality in the power
system [9]. How the results of experiments in the laboratory and harmonic analysis will be presented in section III.
C. The Lighting Efficacy
The advantages and advantages of a lamp compared to other lights, can be seen from several parameters, including the value of lighting efficacy, speed of response to fluctuations in voltage sources, light color quality, flame age and ignition costs [10]. The efficacy shows the efficiency of converting electrical energy into light energy and is expressed in lumen per watt. Power electronics based CFL has an efficacy value of 4-65 lumen/watt, far better than incandescent lamps that have an efficacy value of only 13-20 lumen/watt. A test was carried out on five light units, two incandescent lamps, and three CFLs, as shown in Table 1 [4]. The comparison results show that to get 840 lumens of light, incandescent light requires 60 Watts of electrical power, so it has an efficacy value of 14 lumen/watt while using a CFL on average only requires 13.2-14.7 Watts (57-63 lumen/watt). With the same level of lighting, the CFL requires only 22-24.5% of electricity compared to using incandescent lamps. D.The Response to Voltage Source Fluctuations
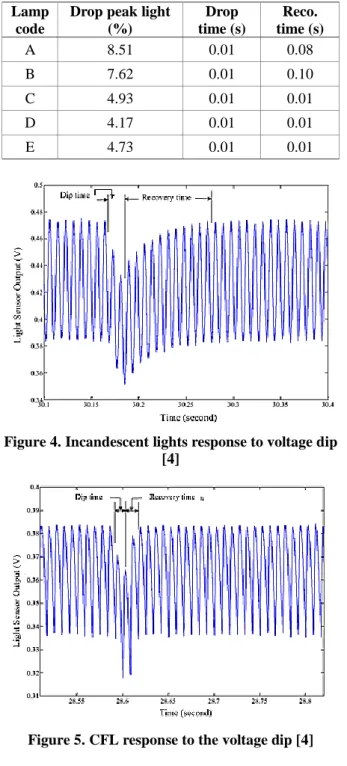
The CFL has a faster recovery response if there are voltage fluctuations. Reference [4] discusses experiments related to lamp response when a voltage dip occurs (voltage drops in a short time). Figure 4 and Figure 5 show the response of incandescent and CFLs to one cycle dip voltage of 4.83%. The recovery time of the CFL is very fast, which only takes 0.01 seconds, while the recovery time of incandescent lamps takes 0.08–0.1 seconds, as shown in Table 2. This can be understood, because the equivalent circuit of the power electronics technology-based CFL has a capacitor on the output side of the rectifier so that the capacitor can maintain the inverter tube input voltage if there is a voltage dip in a short time.
Table 1. Testing the efficacy of lights [4] Lamp
code Lamp type
Power consumption rating (W) Lighting output (Lumen) A Incandescent 60 840 B Incandescent 60 840 C Compact fluorescence 13 825 D Compact fluorescence 14 800 E Compact fluorescence 13 825
102
Table 2. Light response on voltage dip Lamp
code
Drop peak light (%) Drop time (s) Reco. time (s) A 8.51 0.01 0.08 B 7.62 0.01 0.10 C 4.93 0.01 0.01 D 4.17 0.01 0.01 E 4.73 0.01 0.01
Figure 4. Incandescent lights response to voltage dip [4]
Figure 5. CFL response to the voltage dip [4]
Figure 6. The comparison of lighting costs per year [11]
E. Color Quality of Light
The CFL has a Color Rendering Index (CRI) of 70-85. CRI is the level of the lamp's ability to remove the true color of an object. This value is lower than the incandescent lamp which has a CRI of 100. However, at this time the CFL besides the white one also has the color of light such as incandescent lamps, so that the associated color quality of the lamp has many color choices according to its use.
F. Lighting Live and Cost
The CFL has an average T-life of 8000 hours, while the incandescent lamp is only 1000 hours. If the flash time per year is an average of 2000 hours with the purchase price of HL lamps, the lamp power is W and the electric energy price per kWh is HE, then the ignition costs per year are in accordance with
( ) (1) For example, the value of the efficacy of a 15 W self-balancing lamp is equal to an incandescent lamp of 60 W. Assuming the price of a 15W self-sufficient lamp is IDR 40 thousand, the price of a 60W incandescent lamp is IDR 10 thousand, and the price of electric energy amounting to one thousand rupiahs per kWh. Then, by using equation (1) the annual lighting cost for the CFL is IDR 40 thousand while for the incandescent lamp IDR 140 thousand. Figure 6 shows a comparison of annual lighting costs and proves that CFLs are cheaper than incandescent lamps.
III.
R
ESULT ANDD
ISCUSSIONPower electronics-based lamp has disadvantages, among others, the price of procuring lamps which are relatively expensive, containing mercury, output light depreciates with age, start-stop will affect the life span, and distorted input current waves [12]. In this section, all losses will not be discussed as mentioned above, but the discussion will focus on harmonic losses and THD. Initially carried out experiments in the laboratory, then discussed related to the harmonic analysis of input currents, THD, and power analysis of CFLs.
A. Laboratory Experiment
An experiment was carried out in the laboratory to conduct a power consumption test and a self-made lamp THD, with six samples of CFLs, the results of which are shown in Table 3. The room in a residential installation is in Indonesia.
103 The specifications affixed in the LS05-1 lamp
are, 5W, 220 – 240V ~ 50 – 60Hz, the efficacy of 47 lumens per watt, with claims equivalent to 25 Watt incandescent lamps. The experimental sequence is shown in Figure 7 and the experiment in the laboratory in Figure 8. The main measurement tool in this experiment is Power Quality Analyzer (PQA), which is a measuring instrument to determine the quality of electric power, which can measure waveforms, effective values (RMS) and the harmonic spectrum of current and voltage, and can measure power and its power factor. In addition to PQA, a V1 voltmeter is installed, an A1 meter ampere and an analog W1 watt meter are equipped with a current transformer as a comparison meter.
Figure 7. The circuit of experiments of CFLs
Figure 8. Laboratory experiments
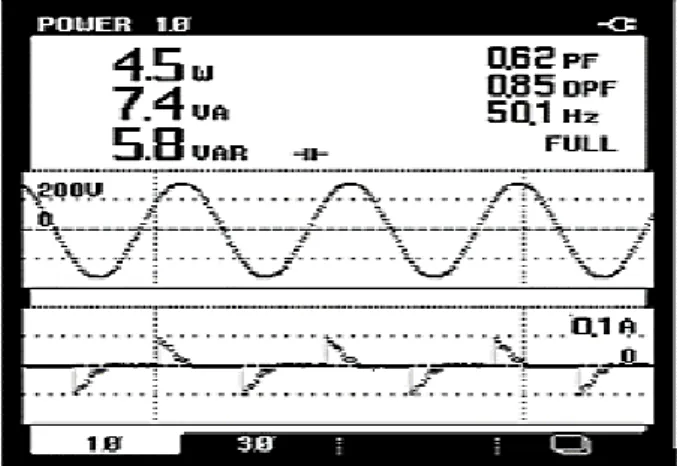
The measurement results using PQA as shown in Table 3, of the six samples, tested, with source voltages available in the laboratory 220-234 volts and voltage THDs of less than 2%, the CFLs have power factor (PF) 0.57-0.76, displacement power factor (DPF) 0.73-0.85, and THD 63.8-72% RMS. Furthermore, the measurement data will be analyzed and several terms contained in the measurement results will be discussed so that the similarity of interpretation can be obtained in understanding the data from the test results of the CFL.
Table 3. The results of CFL experiments
Lamp Code V (volt) A (mA) W (watt) PF DPF THD
(% rms) LS05-1 223.9 32.9 4.5 0.62 0.85 67.7 LS05-2 220.1 36 4.8 0.62 0.75 64.6 LS05-3 221 35 5.4 0.62 0.73 63.8 LS08-1 220.9 56 7.1 0.57 0.77 70.7 LS12-1 220 43 5.8 0.61 0.76 63.9 LS18-1 224 130 22.1 0.76 0.98 72.0
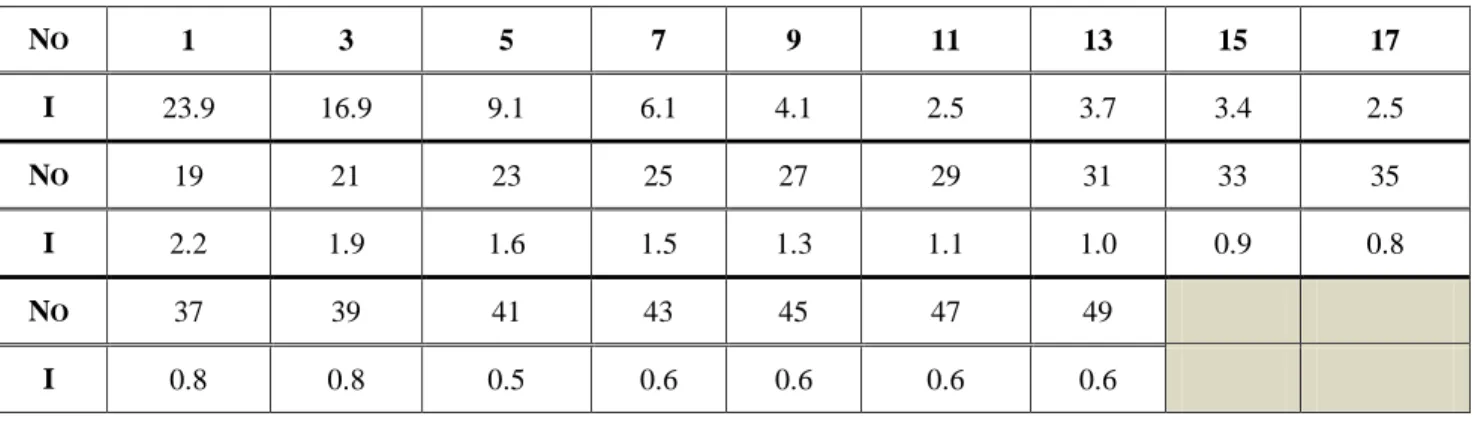
Table 4. The RMS value of individual harmonic LS05-1
NO 1 3 5 7 9 11 13 15 17 I 23.9 16.9 9.1 6.1 4.1 2.5 3.7 3.4 2.5 NO 19 21 23 25 27 29 31 33 35 I 2.2 1.9 1.6 1.5 1.3 1.1 1.0 0.9 0.8 NO 37 39 41 43 45 47 49 I 0.8 0.8 0.5 0.6 0.6 0.6 0.6
104
B. Harmonic Analysis of CFLs
The previous section has explained that the waveform of the CFL current is non-sinusoidal. The reason is that the CFL has a non-linear equivalent circuit because inside there is a one-phase rectifier with a leveling capacitor. Furthermore, this section will be analyzed the harmonic content of the LS05-1 sample CFL. Non-sinusoidal CFL voltages and currents are defined as
√ ( ) (2)
√ ∑ ( ) (3)
√ ( ) (4)
√ ∑ ( ) (5)
which dan represent fundamental components, is the source angular frequency, and H represent harmonic components, 1 and 1 respectively are a fundamental phase and voltage angles, h and h are harmonic voltage and current phase angles, V and I represent the RMS value of voltage and current [13], [14]. The RMS of voltage and current in one T period consist of fundamental RMS and harmonic values, according to √ ∫ ∑ (6)
√ ∫ ∑ (7)
Figure 9 is an experimental result, which shows a current wave that is non-sinusoidal and very distorted, but the voltage wave is only slightly distorted and is close to sinusoidal. In practice, the distortion of the voltage wave is generally only 1-3%, so in this paper, only the current harmonic spectrum LS05-1 is shown as shown in Figure 10, with THD of 67.7% RMS. Furthermore, the individual harmonic RMS spectrum of the current is shown in Figure 11, and odd individual harmonic values are shown in Table 4. In this paper, even harmonic analysis is ignored because the value is very small. PQA which is used is able to measure harmonic currents up to 49th order, so the current RMS value can be calculated by √ (8)
by entering the fundamental value of 23.9 mm and odd individual harmonic values from table 4, to equation (9), the total RMS current of the CFL is 32.4 millimeters, relatively equal to the RMS value shown in Figure 10. PQA used is a measuring instrument labeled true-RMS with a measurement accuracy of 1%, so it can measure the actual RMS value.
Figure 9. Laboratory experiments
Figure 10. Harmonic spectrum and THD (%) input current LS05-1
105 THD shows how much harmonic contribution to
wave distortion. THD is a very important quantity and is widely used to describe the power quality of an electric power system. In some ANSI standards and IEEE THD values based on the comparison of harmonic RMS values to fundamental values I1, according to equation (9), whereas in some IEC standards, THD is based on the comparison of harmonic RMS values to RMS current values according to equation (10). Therefore it is sometimes referred to as "American" and "European" THD. The difference in THD value cannot be ignored if the current wave is very distorted because it has a significant difference in value [4]. √∑ (9) √∑ (10) By entering the value I in Table 4 into equations (9) and (10), the THDiF is 92% and THDiR is 67.6%. These results indicate that the difference in THD calculations is very significant. It is confirmed that PQA used in the experiment is RMS based because the measured value is relatively the same as the calculated value using equation (10). This difference can lead to interpretation in data analysis and harmonic measurement systems. In the Directors Decree No. 563K/DIR/2012 concerning harmonic regulation, flicker and voltage imbalance, SPLN. 004-1: 2012, specifically for the discussion regarding THD, there is a standard sampling inconsistency, which is voltage-based THD RMS while current THD is fundamentally, so allowing differences in interpretation in data analysis in Figure 12.
C. Power Analysis and CFLs Power Factor The power calculation is a complex problem in non-sinusoidal conditions. Harmonic distortion can cause a decrease in power quality and error meter reading. The impact of this error will have implications for the error in the value of the sale and purchase of electrical energy so that one of the parties is harmed, be it the electricity provider or the customer. In an electric power system, there are three known forces, namely the visible power S, the active power P, and the reactive power Q. The relationship between the three powers is defined by equation
√ (11)
(12)
(13)
Figure 12. Visible power based on the IEEE 1459-2000 standard [15]
with , is the phase difference between the fundamental voltage and current. The cosine , called Displacement Power Factor (DPF) is defined by
⁄ ( ) (14) By entering the results of the CFL experiment in Table 3 and the values of V, I and cos (DPF) into equation (12), the lamp power is 6.3 Watts, even though the actual measurement results are 4.5 Watts. This proves that measurements based on DPF can cause miscalculation. In non-sinusoidal conditions, the power equation used to calculate the power factor in the CFL can refer to Figure 12. The visible power S consists of the fundamental visible power and non-fundamental apparent power SN [12], [15], which is defined by
√ (15) with V1 and I1 each is a fundamental RMS voltage and current value. Non-fundamental visibility consists of components of DI current distortion power, DV distortion voltage power and harmonic visible power defined by
√ (16)
(17) so that total visible power is obtained,
( ) (18)
Harmonic power DH distortion is defined as, √ (19) Assuming the voltage is considered to be pure sinusoidal because THDVF is measured in experiments only 1.5%, then the power equation appears to be total CFLs as,
106
The total active power P consists of the fundamental active power P1 and the active harmonic power PH, which is defined by
(21)
(22)
∑ (23)
by ignoring distortion in voltage, the power factor PF is defined as,
( ) ( ⁄ √( ) ( ) ) ( ⁄ ) (24) By substituting equations (9) and (10) to (7), obtained
√ (25)
√ (26) Furthermore, by substituting equations (25) and (26) to (24) there is a relationship between PF, DPF and THDiF and THDiR, as follows:
√ ⁄ (27)
√ (28) Equations (27) and (28) show that the increase in THD will decrease the PF power factor. For example, by entering the THDiF value of LS05-1 lamp by 92%, which has been calculated previously, and the DPF value of 0.85 to equation (27), the PF value of 0.623 is relatively the same as the value shown in Table 3 and Figure 4 But if what is measured by meters is the THDiR value, then it must use equation (28). The correct calculation of the active power of the PLS CFL, have to follow the equations
(29)
The power factor used must use the PF power factor instead of the DPF. By entering the values V, I and PF into equation (29), the active power of 4.5 Watt is obtained, equal to the measured power as shown in Figure 13. Furthermore, differences in the power factor reading will have implications for regulations related to electrical energy transactions. It should be remembered that the PLN policy is related to penalties if certain customers have a power factor below 0.85. However, the power factor in question is not explained whether the DPF or PF,
even though both have a significant difference in value if they have a high THD.
Figure 14 shows the difference in meter reading in the LS18-1 lamp experiment in the laboratory. The experimental results show that analog W1 measuring devices read 200W of power while PQA labeled true RMS reads 221W. There was a difference in the reading of 21W or 9.5% of the actual value. This explanation has proven that high harmonic content (Figure 15) can cause power and power factor errors. This error will cause one of the parties to be harmed or the sale and purchase transaction of electrical energy cannot be accounted for.
D.Proposals Related to Regulation of The CFL The CFLs have been circulating in Indonesia for more than 10 years, and are currently almost used in all residential lighting systems and commercial industries. Regulations related to the circulation of CFLs, such as the Republic of Indonesia Minister of Energy and Mineral Resources Regulation No. 18 of 2014, regarding affixing energy-saving labels still need to be improved. This paper proposes the affixing of THD labels related to the regulation of
Figure 13. Power and power factor LS-5W
Figure 14. The difference in meter reading in LS18-1 test (all watt meter readings 10 x true value)
107 Figure 15. Harmonic spectrum of LED light based on
power electronics
circulating CFLs with several reasons to consider, including:
1. Energy saving for CFL, despite having high THD, 67.7-72%.
2. The results of the analysis show that a high THD is proven to result in a calculation of current, power and power factor errors.
3. The results of experiments in the laboratory indicate that there are differences in the self-consumed lamp power consumption readings. 4. The meter used must be labeled "true RMS", to
measure electrical power in a network dominated by high THD equipment include CFL.
5. In fact, almost all residential customers and some commercial industry customers do not use meters labeled "true RMS", so that payment transactions between customers and electricity providers cannot be justified.
6. From the technical side, a high THD can have an impact on decreasing power quality, including low power factor, increased power losses and meter reading errors which can result in protection system failures.
7. The economic impact of error meter reading due to high THD has implications for the existence of one of the disadvantaged side.
8. High THD causes a significant difference between PF and DPF. This will result in PLN regulations related to penalties for certain customers with a power factor below 0.85 will not be effective. If the meter used can only read the fundamentals, the power factor will be large, so the customer is not penalized.
The concept described is reasonable enough to propose a revised regulation related to affixing energy-saving sign labels for CFLs by entering THD parameters. Furthermore, it is necessary to further regulate the maximum THD value permitted, with the proposed format as follows:
1. All manufacturers have included the THD on CFLs effective in 2016.
2. All manufacturers must meet the THDi value of RMS below 30% in 2018. This target is realistic, because high power factor CFL technology, for the example of active filtering circuit technology, THD can be reduced to 5-10%. 3. If the target CFLs use is not reached until 2020,
should be considered to be replaced with power electronics-based LED lights. The experimental results in Figure 16 show that power electronics-based LEDs have a THD below 20%, but it is necessary to carry out a costly lighting cost assessment that is still relatively expensive. Another policy that the government can do is to make regulations to provide incentives to domestic meter manufacturers to make true RMS meters so that electricity transactions can be accounted for.
IV.
CONCLUSION
The advantages and disadvantages of using CFLs have been described. This lamp is proven to be energy efficient, has a good speed response to voltage fluctuations and low ignition costs. One disadvantage is that the input current is non-sinusoidal and contains harmonics, relatively high THD. The analysis results show a high THD can cause low power factor and electric power calculation error. Verification by experiment proves that high THD can cause meter reading errors, which shows a difference of 9.5% electrical power from both measuring instruments. The economic impact of errors in meter reading due to high THD has implications for the existence of one of the disadvantaged parties in the electrical energy transaction. The concept described has reason to propose a revised regulation regarding affixing energy-saving sign labels for CFLs by including THD, so that in the future CFLs on the Indonesian market are energy-efficient lamps with low THD.
ACKNOWLEDGMENT
To Arwindra Rizqiawan, Nur Adhinugraha Heryanto (ITB-Indonesia), Buyung S Munir, Didik F Dakhlan (PLN Research Institute) and Firman Sasongko (Tokyo Institute of Technology-Japan), I express my gratitude for the positive contribution in this research.
R
EFERENCES[1] J. A. Oliver, T. Harder, A. Cobos, M. Hayes, C. O. Mathuna, S. Member, and E. Prem, “Power
108
Electronics Enabling Efficient Energy Usage : Energy Savings Potential and Technological Challenges,” IEEE Trans. Power Electron., vol. 27, no. 5, pp. 2338–2353, 2012.
[2] Peraturan Pemerintah Nomor 70, “Konversi Energi.” pp. 1–23, 2009.
[3] Peraturan Menteri ESDM 14, “Manajemen Energi.” pp. 1–19, 2012.
[4] C. May, S. Member, E. R. Collins, S. Member, and A. I. Lamps, “Lamps to Voltage Fluctuations,” 2010.
[5] Z. Wei, N. R. Watson, S. Member, and L. P. Frater, “Modelling of Compact Fluorescent Lamps,” pp. 1– 6, 2008.
[6] J. Molina and L. Sainz, “Model of Electronic Ballast Compact Fluorescent Lamps,” IEEE Trans. Power Deliv., vol. 29, no. 3, pp. 1363–1371, 2014. [7] J. Molina and L. Sainz, “Compact Fluorescent
Lamp Modeling for Large- Scale Harmonic Penetration Studies,” IEEE Trans. Power Deliv., vol. 8977, no. c, pp. 1–9, 2014.
[8] Peraturan Menteri ESDM 18, “Pembubuhan Label Tanda Hemat Energi Untuk Lampu Swabalast.” pp. 1–12, 2014.
[9] H. R. Iskandar and N. Heryana, “Analisis Harmonik Lampu Penerangan Jalan Umum Berbasis LED dengan Tegangan Bervariasi dan Daya Konstan,” in Prosiding seminar ilmiah nasional: “membangun
paradigma kehidupan melalui multidisiplin ilmu,” 2017, pp. 89–104.
[10] R. A. Jabbar, A. Muhammad, R. H. Khawaja, M. Akmal, and M. R. Arif, “Impact of Compact Fluorescent Lamp on Power Quality,” pp. 1–5, 2008.
[11] X. Xu, A. J. Collin, S. Djokic, S. Yanchenko, F. Moller, J. Meyer, R. Langella, and A. Testa, “Analysis and Modelling of Power-Dependent Harmonic Characteristics of Modern PE Devices in LV Networks,” IEEE Trans. Power Deliv., vol. 8977, no. c, pp. 1–1, 2016.
[12] M. J. H. Rawa and D. W. P. Thomas, “Experimental Measurements and Computer Simulations of FL and CFL Lamps for Harmonic Studies,” 2014.
[13] H. Dalvand and V. G. Agelidis, “Real-Time Measurement of Power Quantities under Sinusoidal and Non-Sinusoidal Conditions for Single- Phase Systems,” 2010, pp. 428–433.
[14] P. Gill, Electrical Power Equipment Maintenance and Testing, Second Edi. North Carolina: Taylor and Francis Group, LLC, 2008.
[15] IEEE, “IEEE Recommended Practices and Requirements for Harmonic Control in Electrical Power Systems,” in IEEE Std 519-1992, 1993, pp. 1–101.
![Figure 12. Visible power based on the IEEE 1459-2000 standard [15]](https://thumb-us.123doks.com/thumbv2/123dok_us/8697925.2353780/7.893.462.798.93.287/figure-visible-power-based-ieee-standard.webp)