Automated Trading System
Development
Interactive Qualifying Project Report
Submitted to the Faculty of
WORCESTER POLYTECHNIC INSTITUTE
In fulfillment of the requirements for the
Degree of Bachelor of Science
Paolo Colella
Steven Guayaquil
Mauricio Ledesma
Antonio Puzzi
Submitted: April 29, 2013
Advisors:
Hossein Hakim
Michael Radzicki
i
Abstract
Trading is a business that moves trillions of dollars every day, involving individuals and institutions from all around the world. There are many markets to trade and various ways to do it; this report will explore the different kinds of markets and will more in-depth study the foreign exchange market. This report also covers robot trading, the different aspects to consider when developing an automated trading system, and the process of developing a robust strategy. Finally, the report will show the trading performance of each group member and the overall team results in order to give solid examples of how the research and knowledge acquired during the project was applied and executed.
ii
Table of Contents
Abstract ... i
Table of Contents ... ii
Table of Figures ... v
Index of Tables ... vii
1. Introduction ... 1
2. Background Information ... 3
2.1. Details of Various Asset Classes: ... 3
2.1.1. What is a Stock? ... 3
2.1.2. What is a Currency Pair? ... 5
2.2. Sources of Data/Exchanges ... 6
2.2.1. Financial Markets... 6
2.2.2. Functions of the Financial Markets ... 7
2.2.3. Different Financial Markets ... 9
2.2.4. The History of the Forex Market ... 11
2.2.5. Factors that Affect Forex ... 14
2.3. Trading Platforms ... 17
2.3.1. TradeStation ... 18
2.3.2. MetaTrader4 ... 20
2.4. Types of Trading Systems ... 21
2.5. Strategies ... 23
2.5.1. Trend Following ... 23
2.5.2. Volatility Expansion ... 25
2.5.3. Support and Resistance ... 26
2.6. Basic Tools ... 29
2.6.1. Indicators ... 29
2.6.2. Trend Lines ... 65
2.6.3. Candlesticks ... 66
2.6.4. Artificial Intelligence Trading ... 67
2.6.5. Backtesting ... 68
2.6.6. Optimization ... 70
iii
2.6.8. Monte Carlo Analysis ... 71
2.7. Types of Trading Orders ... 72
2.8. Money and Risk Management ... 74
2.8.1. Objectives ... 74
2.8.2. Implementation Costs ... 75
2.8.3. Risk and Reward ... 75
2.8.4. Expectancy ... 75
2.9. System Traits ... 76
2.10. System Components ... 77
2.10.1. Market and Instrument Type ... 77
2.10.2. Instrument Filters ... 77
2.10.3.Setup and Entry ... 77
2.10.4. Position Sizing ... 78
2.10.5. Exit Strategy ... 78
3. Establishing a Trading Company ... 79
3.1. Types of Companies ... 79
3.1.1. Sole Proprietor ... 79
3.1.2. Partnership ... 80
3.1.3. Corporation ... 81
3.1.4. S Corporation ... 81
3.1.5. Limited Liability Company ... 82
3.2. Which Company to Choose? ... 83
3.3. Agencies that Regulate Forex ... 84
3.4. Licenses and Regulations ... 86
3.4.1. Forex Broker License ... 86
4. Methodologies ... 90
4.1. Why Forex? ... 92
5. Trading System Development ... 95
5.1. System’s Objectives and Trading Plan ... 95
5.2. Development of the Strategy ... 97
5.2.1. Step by Step Development of the Final Strategy ... 98
5.2.2. Backtesting Performance of Previous Strategies ... 103
iv
5.3.1. Summary of Strategy Conditions ... 105
5.3.2. Final Strategy Components ... 106
5.4. Individual Trading Projects ... 110
5.4.1. Antonio’s Trading Project... 110
5.4.2. Mauricio’s Trading Project ... 115
5.4.3. Paolo’s Trading Project ... 120
5.4.4. Steven’s Trading Project ... 124
5.5. Walk Forward and Monte Carlo Analysis ... 128
6. Results ... 135
6.1. Antonio’s Trading Results ... 135
6.2. Mauricio’s Trading Results ... 139
6.3. Paolo’s Trading Results ... 143
6.4. Steven’s Trading Results ... 147
6.5. Group Results ... 151
7. Conclusions ... 153
8. Recommendations for Future Projects ... 155
9. References ... 157
Appendix A: List of Trades ... 163
Appendix B: Backtesting Performance Results from Previous Strategies ... 168
Appendix C: EasyLanguage Codes ... 216
v
Table of Figures
Figure 1: Caption of TradeStation 9.1 Platform ... 18
Figure 2: MetaTrader4 screen example ... 21
Figure 3: Volatility expansion gaps44 ... 26
Figure 4: The support in a support and resistance strategy46 ... 27
Figure 5: The resistance in a support and resistance strategy46 ... 28
Figure 6: Three Line Moving Average ... 30
Figure 7: The difference between EMA and SMA ... 32
Figure 8: Linear Regression Curve Indicator ... 34
Figure 9: Volatility Indicator ... 36
Figure 10: Correlation between BAC and DJIA ... 39
Figure 11: Price Oscillator Indicator59 ... 40
Figure 12: Rate of Change Indicator61 ... 41
Figure 13: Volume Rate of Change63 ... 43
Figure 14: Relative Strength Index65 ... 45
Figure 15: DMI Indicator ... 46
Figure 16: Average Directional Index71 ... 48
Figure 17: TRIX Indicator ... 50
Figure 18: Bollinger Bands Indicator77 ... 52
Figure 19: Keltner Channel Indicator ... 53
Figure 20: MACD Indicator82 ... 55
Figure 21: Chaikin Oscillator Indicator84 ... 57
Figure 22: Stochastic Indicator ... 59
Figure 23: Momentum Indicator ... 61
Figure 24: Parabolic SAR Indicator ... 62
Figure 25: Fibonacci Retracement Indicator... 64
Figure 26: A sample of a trend line ... 66
Figure 27: Sample Candlesticks. ... 67
Figure 28: Backtesting settings from TradeStation. ... 69
Figure 29: Rolling Walk-Forward Analysis. ... 71
Figure 30: Example of a wrong crossover ... 99
Figure 31: Example of entry at a Lowest-low ... 100
Figure 32: Example of the length of the bar ... 107
Figure 33: Example of the EMAs ... 108
Figure 34: Summary of strategy settings EUR/JPY ... 112
Figure 35: Backtesting equity curve line for EUR/JPY since 01/31/2012 ... 112
Figure 36: Backtesting monthly accumulative net profit for EUR/JPY since 01/31/2012 ... 113
Figure 37: Backtesting performance report for EUR/JPY since 01/31/2012 ... 114
Figure 38: Summary of strategy settings EUR/USD ... 117
Figure 39: Backtesting equity curve line for EUR/USD since 01/31/2012 ... 117
Figure 40: Backtesting monthly accumulative net profit for EUR/USD since 01/31/2012 ... 118
Figure 41: Backtesting performance report for EUR/USD since 01/31/2012 ... 119
vi
Figure 43: Backtesting equity curve line for AUD/USD since 01/31/2012 ... 122
Figure 44: Backtesting monthly accumulative net profit for AUD/USD since 01/31/2012 ... 122
Figure 45: Backtesting performance report for AUD/USD since 01/31/2012 ... 123
Figure 46: Summary of strategy settings GBP/USD ... 125
Figure 47: Backtesting equity curve line for GBP/USD since 01/31/2012 ... 126
Figure 48: Backtesting monthly accumulative net profit for GBP/USD since 01/31/2012 ... 126
Figure 49: Backtesting performance report for GBP/USD since 01/31/2012 ... 127
Figure 50: Walk Forward Analysis for EUR/JPY... 128
Figure 51: Monte Carlo Analysis for EUR/JPY ... 129
Figure 52: Walk Forward Analysis for EUR/USD. ... 130
Figure 53: Monte Carlo Analysis for EUR/USD. ... 131
Figure 54: Walk Forward Analysis for AUD/USD ... 132
Figure 55: Monte Carlo Analysis for AUD/USD ... 132
Figure 56: Walk Forward Analysis for GBP/USD ... 133
Figure 57: Monte Carlo Analysis for GBP/USD ... 134
Figure 58: Performance Summary EUR/JPY (02/01/2013-04/03-2013) ... 136
Figure 59: Equity curve line (02/01/2013-04/03/2013) ... 137
Figure 60: Example of the sideways trend of the market and losing trades ... 138
Figure 61: Performance Summary EUR/USD (02/01/2013-04/01-2013) ... 140
Figure 62: Equity curve line (02/01/2013-04/01/2013) ... 141
Figure 63: Example of loss due to news release on 02/07/2013 ... 142
Figure 64: Robot malfunction due to internet technical difficulties on 03/22/2013 ... 143
Figure 65: Performance Summary AUD/USD (02/01/2013-04/01-2013) ... 144
Figure 66: Equity curve line (02/01/2013-04/01/2013) ... 145
Figure 67: Example of loss due to incomplete position exit (03/13/2013) ... 146
Figure 68: Example of greater position sizing (03/04/2013-03/13/2013) ... 147
Figure 69: Performance Summary GBP/USD (02/01/2013-04/03/2013) ... 148
Figure 70: Equity curve line (02/1/2013-04/03/2013) ... 149
vii
Index of Tables
Table 1: Comparison between the different types of companies ... 83
Table 2: Backtesting Performance of Strategies for EUR/JPY... 104
Table 3: Backtesting Performance of Strategies for EUR/USD ... 104
Table 4: Backtesting Performance of Strategies for AUD/USD ... 105
Table 5: Backtesting Performance of Strategies for GBP/USD ... 105
1
1.
Introduction
As technology and innovation advance in our modern age, so do the trading platforms and accessibility. Nowadays trading stocks, bonds, foreign exchanges, options, and other securities is easier and more reachable than ever before. Many people can work from home and do a living by investing in these markets with investment capital, research, and dedication. The main focus of this project is how the foreign exchange market can be analyzed with certain tools and techniques to scientifically develop profitable trading systems.
The foreign exchange market, which from this point on will be referred as forex, is a market that trades currencies from different countries. In this market two currencies are traded against each other according to what the market believes to be the relative strength between these two. This market was chosen due to one main reason: it does not require a substantial amount of initial investment capital to be profitable in a practical amount of time, compared to other markets such as the stock or bond market. The expectations for this project were high since the beginning, because after one year of substantial research and practice, this could be applied to manage personal capitals. On the other hand, it is important to take into account that even though the forex market has an advantage in terms of the capital needed compared to other markets, the risks attached to it may be higher as well.
Before starting to trade forex, it is important to acknowledge that the magnitude of analysis needed to understand this market may be considerably greater than other options; forex requires the understanding and analysis of countries’ background, current news, and
2
political and economic situation, plus the influence of the rest of the world’s economic environment. Being involved in the forex market allows one to be informed into the world’s social, political, and economic situations, making people globalized citizens.
While trading any kind of financial security, it is of extreme importance to have discipline and follow a strict system of parameters that fits one’s personality. There are certain important parameters that should be taken into consideration such as position sizing, entry and exit strategies, maximum loss tolerance, return on investment target, and trading time frames. Setting these parameters requires a lot of research, time, and practice to make sure the trader feels comfortable with the procedure and the risk involved.
Trading requires being attentive to a lot of details to make sure one is trading instead of gambling. Investment capital, lots of research, and strong determination are three key elements that allow people to build professional trading strategies that match their personality and have good success potential.
3
2.
Background Information
2.1.
Details of Various Asset Classes:
2.1.1.
What is a Stock?
A stock is a share of the ownership of a company. There are many words people use such as shares, equity, or stocks, but basically they all mean the same thing. A stock represents an amount of ownership in a company’s assets and earnings. So theoretically, every stockholder of a company is one of the multiple owners –the correct term really is shareholders– of the company and has a claim over everything that company owns, as well as a share of that company’s dividends, if any, and any voting rights that are entitled to the stock.
Even though every stockholder is technically one of the owners of the company, there might be many more shareholders that have a considerably larger amount of shares. With this said so, despite the fact that every stockholder may have the right to vote for the board of directors or any other important company decisions, the people who call the shots are stockholders with a large percentage of ownership of the firm. In most cases, one stock entitles to one vote; hence, the more shares someone has, the more powerful the voting impact is.
An attractive aspect of stocks is the limited liability it provides to their owners. This basically means that, in a publicly traded company, shareholders are not personally held accountable for any debt that the company in which they own stock is unable to pay. Even in the extreme case that a company in which one holds stock goes bankrupt, one’s personal assets will not be involved.
4
Stocks are one of the most commonly traded financial instruments. Even though certain companies may not pay out dividends to their stockholders, stocks are still an attractive investment to many people since they believe that the company will increase in value. When someone owns stocks of a company and these stocks gain value, that person makes money whenever he sells his stocks at a higher price than what he bought it.
When a company has needs to raise funds it can either borrow money or sell a part of their company. Publicly selling a part of a company can be referred as “issuing stock”. This is beneficial for a company since it does not involve taking a loan and having to pay back what they borrowed plus interest. As it was previously mentioned, shareholders that buy a company’s stock believe the company will be worth more in the future. The first time a company issues stock is called an Initial Public Offering, often abbreviated as IPO. 1
There are two main kinds of stocks, common stocks and preferred stocks. Common stocks are the most commonly traded ones. This kind of stock entitles owners to vote at shareholder meetings and receive dividends, if any. On the other hand, preferred stockholders usually have no voting rights; however, they receive dividend payments before common stockholders do. In the event that a company goes bankrupt and its assets are liquidated, preferred stockholders have a priority over common stockholders for these assets. 2
The value of a publicly traded company is the number of shares multiplied by the current price of what that company’s stock is being traded at. It is important to take into
1“Stock Basics: What are Stocks?” Investopedia, n.d. Web. 3 Dec. 2012.
<http://www.investopedia.com/university/stocks/stocks1.asp#axzz2E0bh97q5>
2“Stocks.” U.S. Securities and Exchange Commission, n.d. Web. 3 Dec. 2012.
5
consideration that this price may fluctuate considerably over a long or even a short period of time since the price is set to what people speculate and believe the value of one stock is.
2.1.2.
What is a Currency Pair?
Currency trading is commonly known as forex, which is the shortened version of Foreign Exchange. In forex, a pair of currencies is being traded against each other’s relative strength. For example, if on December 3, 2012 EUR/USD is traded at a rate of 1.3072, it means that the market is paying 1.3072 US Dollars for every Euro. In forex trading, the first currency is known as the base currency and the second currency in the exchange pair is known as the counter or quote currency.
The profit or loss in a forex trade is determined by the difference between the price that was paid in the initial exchange of a currency pair, and the price at which it was later on sold. The term “pip” is commonly used standing for “percentage in points”. One pip is the smallest unit of measurement in forex trading. Since currencies have four decimal places for their exchange rates, one pip represents a change of 0.0001 in the market price. The only exception is the Japanese Yen, since it only has two decimal places; one pip in the Japanese Yen is a change of 0.01 in the exchange rate. 3
One big difference between the stock market and the forex market is the liquidity. This can be simply defined as the ability to convert an asset or security into cash. In other words, assets that can be easily bought or sold are known as liquid assets.4 The forex market is the most liquid market in the world; every day, over $1.9 trillion worth of trades take place in
3“Forex- pips, spread, margin, leverage.” Learning to Invest, n.d. Web. 4 Dec. 2012.
<http://www.learning-to-invest.com/Forex---pips-spread-margin-leverage--9.html>
4“Liquidity.” Investopedia, n.d. Web. 5 Dec. 2012.
6
the currency market.5 From a liquidity stand point, forex is a safer alternative than other markets, since most of the time there is more demand and supply for currencies compared to other financial assets.
In finance, leverage defines the ability of traders to buy more securities that what their actual account balance has, similar to using credit. For instance, the leverage in the forex market can allow traders to control more than 50 times the value in currency pairs than what they actually deposited in their accounts. This is certainly one of the most appealing, and riskier factors of the forex market. For instance, in the stock market, the usual leverage is 2:1. However in forex, the leverage may be up to 50:1. If one invests $100 margin in stocks with a 2:1 leverage one can buy up to $200 worth of shares. On the other hand one invests $100 margin in currencies, at 50:1 leverage, one can buy up to $5,000 in forex.6 The term “margin”, also known as minimum security, is the collateral deposit trading providers collect and is intended to cover possible trading losses. It is very important to be aware that while this huge leverage in forex markets may increase potential gains, it may also drastically increase losses.
2.2.
Sources of Data/Exchanges
2.2.1.
Financial Markets
The term “market” has been around for thousands of years, to represent a structured place where people get together to buy, sell, or exchange their goods. Financial markets come from the same definition; these are places where buyers and sellers trade their financial assets, such as financial securities (stocks and bonds) or commodities (precious metals and
5"Forex." Investopedia, n.d. Web. 5 Dec. 2013. <http://www.investopedia.com/terms/f/forex.asp> 6“Forex Overview.” CMSForex, n.d. Web. 5 Dec. 2013.
7
agricultural goods), for low transaction costs and transparent prices. Financial markets can be found in a various places around the world, differing in size, types of assets traded, and liquidity.7
Financial markets have evolved throughout time, the history of these markets dates back to the 13th century. The Antwerp Stock Exchange in Belgium is known as the first stock market to be accommodated in an official building.8 In the United States, the New York Stock Exchange was created in 1792, and it is one of the most important financial markets in the world. It is important to know that technology has influenced the evolution of the financial markets. Formerly, the main way of trading was in the pit; this is where the famous term “out-cry-pit” comes to represent how buyers and sellers made the transactions based on hand signs and shouting.9 Open outcry trading has been slowly disappearing since nowadays most trading is done electronically, making trading more efficient.
2.2.2.
Functions of the Financial Markets
2.2.2.1. Raising of capital
The amount of supply and demand in a financial market is what makes it liquid. These markets are an important tool for many entities to raise capital through the issuing of shares and bonds. For example, when a company has its initial public offering (IPO), it sells
7 "Financial Market." Definition. N.p., n.d. Web. 15 Mar. 2013.
<http://www.investopedia.com/terms/f/financial-market.asp>.
8 "Economy Watch - Follow The Money." Oldest Stock Exchange in the World, Oldest Stock Exchange in the World, Stock Market Information. N.p., n.d. Web. 15 Mar. 2013. <http://www.economywatch.com/stock-markets-in-world/oldest-stock-exchange.html>.
9 "Trading Pit History." Trading Pit History. N.p., n.d. Web. 15 Mar. 2013.
8
a portion of the ownership to the open market in exchange of capital. Going public is a common way for many companies to raise capital needed to grow and expand.10
2.2.2.2. Risk transfer
In financial markets the risk transfer is a very important and effective tool. Investors are able to purchase assets and avoid the risk that owning them entitles by transferring this risk to a specialized entity. These entities are financial intermediaries, such as banks or insurance companies, who are paid periodically for taking responsibility of managing these assets. These tools allow buyers to have confidence in investing, which keeps the market in continuous movement.11
2.2.2.3. International Trade
International trade consists in the exchange of capital, goods, and services across foreign borders. An important part of this market is the foreign exchange market, which allows currencies to be traded in an easier and more efficient ways. International trade also allows resources from all around the world to be traded thanks to supply and demand.12 The price competition within markets becomes stronger thanks to the international trade throughout the world, this way consumers are allowed to find better prices in the market.13
10 "Complete Guide To Corporate Finance." Introduction To Raising Capital –. N.p., n.d. Web. 15 Mar. 2013.
<http://www.investopedia.com/walkthrough/corporate-finance/5/raising-capital/introduction.aspx>.
11 "Transfer Of Risk." Definition. N.p., n.d. Web. 15 Mar. 2013.
<http://www.investopedia.com/terms/t/transferofrisk.asp>.
12 "What Is International Trade?" What Is International Trade? N.p., n.d. Web. 15 Mar. 2013.
<http://www.investopedia.com/articles/03/112503.asp>.
13 "International Trade." What Is? Definition and Meaning. BusinessDictionary.com, n.d. Web. 15 Mar. 2013.
9
2.2.3.
Different Financial Markets
2.2.3.1. Capital Markets
Capital Markets are where financial securities are traded. There are two main types of capital markets: primary markets and secondary markets.
Primary markets or new issue markets are where companies obtain funds through debt by issuing securities. These securities are sold and the cash goes straight to the company for operations for expanding purposes. In primary markets, investment banks set the beginning price for the security and then these are sold directly to investors.
Secondary Markets have the price of securities defined by actual supply and demand instead of by investment banks. In these markets, investors trade assets between each other, rather than purchasing securities issued directly by a company. Secondary markets are where the majority of the trading occurs every day.14
2.2.3.2. Stock Markets
The stock market is the place where investors trade shares of publicly traded companies. These shares fluctuate in price depending on speculations and the performance of the company. As previously mentioned, the stock market can also be divided into the primary and secondary markets.15
2.2.3.3. Bond Markets
Bonds are financial instruments issued by companies and organizations to raise capital. A bond consists in a debt investment in which a company borrows money from investors for
14 "Capital Markets." Enotes.com. Enotes.com, n.d. Web. 15 Mar. 2013.
<http://www.enotes.com/capital-markets-reference/capital-markets-174144>.
15 "Stock Market." Definition. N.p., n.d. Web. 15 Mar. 2013.
10
a defined period of time. Investors lend their money with the purpose of getting it back with interests. Bonds are usually traded in capital markets.16
2.2.3.4. Money Markets
Money markets are a segment of the financial market where financial assets with high liquidity are traded. Several of the assets traded are certificates of deposits, banks acceptances, commercial papers, municipal notes, U.S. Treasury bills, repurchase agreements and federal funds. This market is used to borrow and lend assets in short terms of time; assets can be traded within several days or months, just under a year.17
2.2.3.5. Derivatives Markets
Derivatives are financial tools which value is based on one or more underlying assets, such as stocks or bonds. These are known as a contract between two parties setting conditions such as dates, values of underlying parts, and notional amounts, under which payments are supposed to be made between both parties. 18 There are many different types of financial derivatives, but the most common ones are: options, a contract signed by two parties to buy or sell a financial security19; futures, a contract obligating a party to buy or sell an asset to another party20; swaps, an exchange between securities to modify the maturity21, quality of issues or investment objectives of financial securities.22
16 "Bond Market." Definition. N.p., n.d. Web. 15 Mar. 2013.
<http://www.investopedia.com/terms/b/bondmarket.asp>.
17 "Money Market." Definition. N.p., n.d. Web. 15 Mar. 2013.
<http://www.investopedia.com/terms/m/moneymarket.asp>.
18 "Derivative." Definition. N.p., n.d. Web. 15 Mar. 2013.
<http://www.investopedia.com/terms/d/derivative.asp>.
19 "Option." Definition. N.p., n.d. Web. 15 Mar. 2013. <http://www.investopedia.com/terms/o/option.asp>. 20 "Futures." Definition. N.p., n.d. Web. 15 Mar. 2013. <http://www.investopedia.com/terms/f/futures.asp>. 21 "Swap." Definition. N.p., n.d. Web. 15 Mar. 2013. <http://www.investopedia.com/terms/s/swap.asp>. 22 Smith, Kalen. “What are Financial Derivatives.” Money Crashers, n.d. Web. 22 Mar. 2013.
11
2.2.3.6. Forex Markets and Interbank Markets
Forex is the market place where currencies are traded. It is the most liquid and largest market in the world, moving over $1.9 trillion a day worth of trades. This market is open 24 hours a day, 5 days a week. Through the Internet, any investor can buy and sell currencies in their brokerage accounts. Moreover, the interbank market is the financial system in which banks and financial institutions buy and sell currencies; the interbank market manages around a 50% of the forex market.23 Banks are capable of changing prices in the markets by making large investments from their own accounts when times of low volume in the market.24
2.2.4.
The History of the Forex Market
Since early times in history, mankind has developed different methods to trade goods for other valuables. During the European medieval times, a coinage system was developed where coins were made out of different metals and were exchanged depending on their value. On the other hand, paper money was developed in China during the Tang Dynasty (Sixth Century A.D.)25. These events marked the beginning of the actual currency model, the banknote system, which consists of coins and paper money to represent different values and accumulation of wealth.
2.2.4.1. The Gold Standard
The Gold Standard was a monetary system that changed the concept of money; each country that implemented the system established an exchange rate between their currency
23 "Interbank Market." Definition. N.p., n.d. Web. 15 Mar. 2013.
<http://www.investopedia.com/terms/i/interbankmarket.asp>.
24 "The Foreign Exchange Interbank Market." The Foreign Exchange Interbank Market. N.p., n.d. Web. 15 Mar.
2013. <http://www.investopedia.com/articles/forex/06/interbank.asp>.
25 "Paper Money." Paper Money. N.p., n.d. Web. 15 Mar. 2013.
12
and a certain amount of gold. The purpose of this was for currencies to be backed up by gold.26 This system made commerce between nations more transparent. The Gold Standard worked from 1871 until 1914 when World War I began; eventually the system broke down because the amount of gold reserves each country needed to back up their currencies were extravagant. Germany was forced to drop the Gold Standard to proceed with their military operations. During the War, the expenses were too large to be backed up by the gold reserves possessed each country had. After the war, many countries abandoned the Gold Standard. Franklin D Roosevelt banned the private ownership of gold in 1933.
2.2.4.2. The Bretton Woods Agreement
In 1944, the United Nations Monetary and Fiscal Policy Conference took place in Bretton Woods, New Hampshire. In the middle of World War II, delegates from 44 countries came to the United States for this conference; the purpose was to peg all the currencies to the U.S. dollar in a fixed rate, which was pegged to the gold to the fixed price of $35 per ounce.27 The conference was called the Bretton Woods Agreement; its biggest accomplishment was the creation of the International Monetary Fund. The Bretton Wood Agreement lasted until 1971 when President Nixon ended the gold standard.28
26 "Gold Standard." Definition. N.p., n.d. Web. 15 Mar. 2013.
<http://www.investopedia.com/terms/g/goldstandard.asp>.
27 "The Bretton Woods System." About.com Economics. N.p., n.d. Web. 15 Mar. 2013.
<http://economics.about.com/od/foreigntrade/a/bretton_woods.htm>.
28 “Milestones: 1937-1945.” U.S. Department of State - Office of the Historian. Web. 13 Mae. 2012.
13
2.2.4.3. The Free-Floating System
Following the Bretton Woods System, in 1978 the International Monetary Fund mandated the Free-Floating System29. Currently a free-floating exchange rate is used by most of the world’s governments, adopting any of these three systems:
Dollarization: consists in the adoption of the U.S. dollar as the national coin for any country; for example, Ecuador currently uses this system.29
Pegged Rates: consists in setting a fixed exchange rate between the U.S. dollar and the foreign currency; as adopted by China since 1997 until 2005, when a U.S. dollar was worth 8.28 Yuan.29
Managed Floating Rates: consists in the free-floating value of a country’s currency depending on the variation of supply and demand. Within a country there are different market participants that may intervene to manage the currency’s value.29
2.2.4.4. Market Participants
There are a variety of market participants within economies; among these, the most important ones are governments and central banks, which to some extent control some of the markets by setting interest rates and issuing and buying bonds to stimulate the economy. However, banks also affect the economy in a strong way; besides the individual service they provide to their clients, banks are one of the biggest participants in the forex market. The interbank market is one way in which banks influence the economy; transactions within the banks of the same country influence the value of the currency. Another strong group of participants are speculators; these try to take advantage of the volatility of markets, making money from fluctuating exchange rates. Market participants
29 "Forex Tutorial: Forex History and Market Participants." Investopedia. N.p., n.d. Web. 15 Mar. 2013.
14
are of big influence to the economies, depending on their behavior within the markets, they can move economies in different directions.
Everyone can be part of currency trading, from small individual investors to powerful central banks. This is made possible through banks, broker-dealers, and online trading platforms.
2.2.5.
Factors that Affect Forex
There are certain factors that can change the movement of a currency price in the market. The most common ones are the interest rates, the GDP, the unemployment, and the inflation rate. A good trader should know when the government plans to make announcements about them, since the price of the currency can make violent turns and make the trader’s winning trades turn into losing ones.
2.2.5.1. Interest Rates
Interest rates are controlled by the country’s Central Bank. These determine the rate of interest at which banks can borrow from one another. Usually central banks manipulate the interest rate in order to change inflation or to encourage the flow of money in the economy30.
Changes in any of the eight global central banks can produce a huge movement in the foreign-exchange market. These changes in the interest rates can be an indirect response to the different economic factors that the governments manage, such as unemployment, inflation, etc. Traders who can anticipate a change in the interest rate can use it as an edge in the market, and make profit from it. Usually traders will look for the higher rate of return
30"Interest Rates." Investopedia. n.d. Web. 15 Mar. 2013.
15
since it brings a higher profit. The issue here is that the movement of the different currency pairs makes it more complicated that just trading the ones with higher interests.30
2.2.5.2. Gross Domestic Product (GDP)
“The monetary value of all the finished goods and services produced within a country's borders in a specific time period, though GDP is usually calculated on an annual basis. It includes all of private and public consumption, government outlays, investments and exports less imports that occur within a defined territory.”31
This definition can be summarized with the following equation:
( )
( )31
A nation’s GDP can be interpreted in many ways, but the most common is of thinking of it as the economic health of a country and its productivity. Usually an economy with a raising GDP is an economy that is being productive, although some other factors, like inflation and debt, have to be considered.
2.2.5.3. Unemployment Rate
The unemployment rate is “the percentage of the work force that is unemployed at any given date.”32 A nation with a low unemployment rate usually has a strong economy which offers the countries work force a high amount of jobs. On the other hand, a country with a high unemployment rate usually has a weak economy which does not have the capacity to create enough job opportunities for its work force.
31 "GDP" Investopedia. n.d. Web. 15 Mar. 2013.
<http://www.investopedia.com/terms/g/gdp.asp#axzz2LTx6ks3s >.
32 "Unemployment" Princeton: Wordnetweb. n.d. Web. 15 Mar. 2013.
16
A country which is growing economically usually has a continuously decreasing unemployment rate, since job opportunities should be created as time goes by. A country which is not growing economically, on the other hand, usually presents an increasing unemployment rate. Countries with low unemployment rates are commonly known for having a strong economy and a strong currency, and vice versa.
2.2.5.4. Inflation
Inflation can be defined as “a continuing rise in the general price level usually attributed to an increase in the volume of money and credit relative to available goods and services.”33 When the inflation has a negative value, it is known as deflation. For a country, it is preferable to have inflation rather than deflation since controlling deflation is way more difficult than controlling inflation. A country would also prefer to have a creeping inflation rather than a higher inflation rate.
A country which is economically growing usually has a creeping inflation, since a creeping value of inflation means that the government is investing money into the economy and there is an ongoing money flow.
2.2.5.5. How do News Releases Affect Forex?
When the government releases the monthly, quarterly, or annual reports of the above mentioned factors, there can be an effect on the movement of the currencies in the forex market. Before the government makes the releases, a general expectancy of what the values can be are studied by some institutions which give an expected range in which the value released by the government should be. When the government makes the release and this
33 "Inflation" Merriam-Webster. n.d. Web. 15 Mar. 2013.
17
value falls within the expected range, the effect it has in the market is very low, almost inexistent. On the other hand, when the value released by the government falls outside the expected range, the market gives an unexpected turn, usually catching traders of guard and turning their winning trades into loses.
Many traders think that it is better to stay outside the market when important releases are expected. By doing this, they avoid getting caught by a quick and violent turn of the market. If a trader decides to trade the news, he must be very careful and follow a trading strategy strictly. By following a set of entry and exit rules, he could avoid having a big loss if the market move is in the opposite direction he expects, but he could also make a lot of money by scoring a big win. At the end, it depends on the trader’s strategy and his personality to trade or stay away of the market before a news release, although a vast majority of experts recommend avoiding opening positions and entering the market.
2.3.
Trading Platforms
Trading Platforms are an alternative to the traditionally used physical brokers. The way that trading platforms work is essentially the same as having a physical broker, receiving the calls and making the transactions. This new trading alternative has some advantages such as increased ability for trading to the open public, and a chance to have live information of the markets. Trading platforms make trading much more user friendly and efficient than traditional broker trading.
The two best trading platforms are MetaTrader4 (MT4) and TradeStation. In this project TradeStation is the platform that will be used. MetaTrader4 has been only considered as a comparative reference.
18
2.3.1.
TradeStation
TradeStation’s software has many components that help clients complete their trades in a very efficient way. This software offers a lot of independence to users, since its features and parts are based on the client’s desire or necessity. This platform also allows traders to create their own strategies and indicators based on EasyLanguage coding. TradeStation is very user friendly, where everything is really visual and all the information is updated live so users can make the right decisions at the right time. An example screenshot of TradeStation is shown on figure 1.
Figure 1: Caption of TradeStation 9.1 Platform
EasyLanguage is the coding language created and developed by TradeStation for their software. This language is very similar to C, which gives simplicity to the code; this allows traders without advanced coding experience to easily learn the coding language. The six types of programs that can be done in EasyLanguage are: Indicator, ShowMe, PaintBar, ActivityBar, ProbabilityMap, and Strategy. Indicators are just signals created to provide
19
some particular information about the instrument that is being used, these are most likely plots added to the price charts; many traders base their trading decisions on various different indicators. ShowMe is a type of indicator that “plots a dot on the bars in a chart window based on a true/false condition”34; this indicator could be used as a guide for the trader for when to take decisions about certain trades. PaintBar is similar to ShowMe, it works on true/false statements and paints the bar completely or partially depending on the Boolean conditions that have been stated before. The way ActivityBars work is allowing the trader to see how the prices changed in a specific bar. This gives the user a more detailed description of the activity of the price and how it changed. ProbabilityMaps are just, as the name states, a probabilistic study of how the price is expected to be moving, based on historical information. Finally, Strategies are the instructions given by the trader to the platform to execute a trade; all these decisions may be done automatically by the platform. Traders create their strategies based on different criteria, depending on the trader’s personality, experience and objectives.
Additionally, TradeStation offers some valuable learning material that can be obtained from their website. They have several written publications, videos, and books on their website that are available for their customers. TradeStation has a special program called “University” where traders, especially new members, can go through a learning experience to get familiar with the software and learn about its features and components. Furthermore, one of the biggest supports for customers is the website forum where users can post their questions and get answers from people that have more experience in the
34"EasyLanguage Essentials – Programmers Guide." TradeStation. 2007. Web. 05 Jan 2013.
http://www.tradestation.com/~/media/Files/TradeStation/Education/University/School%20of%20EasyLa nguage/Books/EL_Essentials.ashx.
20
trading field; these people include TradeStation’s analysts and engineers. Finally, TradeStation also has periodic events where they broadcast analysts and important people in the trading business periodically, this to give more help to all the traders using TradeStation.
2.3.2.
MetaTrader4
The MetaTrader4 (MT4) platform is a software based application that assists the trader while performing his job. MetaTrader4 offers a wide variety of applications for the user such as opening and closing trades, creating indicators and automated trading strategies. In order to create all these different applications MetaTrader4 has its own coding language, MetaQuotes Language 4 (MQL4). This language and its structure is based on C, having already some built-in functions that allow the user to combine the trading and financial information with the programming component to create different applications for trading. There are several program applications that can be done in MetaTrader4; these are Expert Advisor, Custom Indicator, Script, Library Included file.35 These programs have different functionalities and are used for different purposes.
MetaTrader4 programs can be run inside of the platform; this feature gives advantage to the user because it is not necessary to import or export any data, and it can be easily run inside within the same software. Another important feature that MetaTrader4 offers is the ability to edit, compile and run in the platform itself. These two features give the user the ability to utilize information and data from the platform, this means prices, indicators,
21
session times, and so on. Having the chance to integrate all this information in one strategy is very useful for the trader.
Figure 2 shows an example of a MetaTrader4 screen.
Figure 2: MetaTrader4 screen example36
2.4.
Types of Trading Systems
Trading systems can be divided into two categories: Manual or automated.
Fundamental or technical.
36 "MetaTrader 5.00 Build 642 / 4.00 Build 419." Softpedia. N.p., n.d. Web. 18 Apr. 2013.
22
A manual trading system is a system where the trader decides when to make an entry or an exit for its trades. Nowadays it is common for traders to use computer programs to study the market or to set indicators and screeners that will provide the trader some analytical information. Even though a computer is used for the research, it is still considered manual trading because the trader is the one deciding whether or not to make the trade.37
An automated trading system is a system where a computer, previously programmed by the trader with a set of rules for entries, exits and position sizing, executes all the trades. These set of rules can be simple or complex, depending on the strategy the trader wants to follow, or the understanding and knowledge of programming the trader has. Traders who prefer an automated trading system typically use a trading platform, such as TradeStation, where they can program and set up their strategy, and just let the platform do the rest.38 Whether to use a manual trading system or an automated trading system depends on the trader itself. Both systems have their pros and cons, and there is not a better one, just one that suits the trader the best. For example, automated systems will carry the set of rules without making mistakes (if programmed correctly), without hesitating. It can also trade for a longer time without getting tired, and it can, at the same time, store and look into more information than a human being. On the other hand, a human being can take into account factors that affect the market, such as natural disasters or wars, and used them to get an edge. A human can also follow his gut and feeling to get into a trade that would generate more profit than an automated one. Finally, a human being can predict that the
37 “Manual Trading.” Investopedia, n.d. Web. 10 Jan. 2013
<http://www.investopedia.com/terms/m/manual-trading.asp#axzz2E7tEUA3P>
38 ” The Pros And Cons Of Automated Trading Systems.” Investopedia, n.d. Web. 10 Jan. 2013
23
market will take an unexpected spin that the computer cannot notice, and pull the trades out.39. These are just some of the many pros and cons that each of the systems has, and it all depends on the personality and goals of the trader to decide which one to use.
Moreover, a technical trading system is one that uses technical indicators and charting techniques for its research. Technical indicators are usually formulas and graphs that help the trader study the movement of prices and some factors like its trend, or floors and ceilings. The trader would then decide whether to enter or exit a trade based on this information. The trader could use a combination of two or more indicators to make a custom and more personalized indicator that would suit the trader’s style.40
A fundamental trading system is the one that bases its research in the release of economic reports and their data. The trader would study these reports and then decide to enter or exit a trade depending on what the trader thinks the effect of the reports will have on the market. Some examples of economic reports are nonfarm payrolls, Federal Open Market Committee (FOMC) minutes, and unemployment rates.40
2.5.
Strategies
2.5.1.
Trend Following
Trend following is a widely used trading strategy for various trading asset classes. Trend following can be summarized in four basic steps. The first step in order is to determine the trend of the trading instrument that will be used. For instance, in the forex market, one would first determine in which way a currency pair is trending. After determining the
39 Tucci, Nathan. “Manual Trading vs. Automated Trading.” Winner’s Edge Trading, 1 June 2012. Web. 10 Jan.
2013. <http://www.winnersedgetrading.com/manual-trading-or-automated-trading/>
40 Russell, John. “Two Types of Trading Systems.” About, n.d. Web. 10 Jan. 2013.
24
trend, the second step is deciding the entry point. Depending on the direction of the trend, the trader will chose to either buy long or sell short. Once the trader has entered a position, the next step of this strategy is waiting. This is one of the most difficult steps for many traders since they have to patiently hold their positions as long as the trend keeps turning their positions into profits. Finally, the last step is exiting the trade. The trader needs to exit the trade when he believes the trend is stopping and changing in direction.41 This final step is challenging for most traders since it is not simple to determine when a trend has changed direction or if it is only going through a temporary drawdown.
If applied correctly and with discipline, trend following can bring profits to many traders; however, a strict set of rules is needed in order to make disciplined trades. Many traders face problems while trading with a trend due to lack of discipline and not sticking to their set of rules. For example, one basic principle of trend following is buying when price is trending up and selling when price is trending down. Even though this principle may seem obvious and simple at first sight, many traders break it on a daily basis. This principle is often broken when traders try to buy at the very bottom and sell at the very top. Winning traders wait until they have confirmed the trend before buying or selling. Another problem traders face due to not following a strict set of rules is predicting. Once traders start to follow a trend, they stop using their set of rules and start predicting how the price is going
41 Goodboy, David. “Forex Trend Following.” Trading Markets, 8 Apr. 2011. Web. 25 Nov. 2012.
<http://www.tradingmarkets.com/forex/commentary/forex-trend-following-a-profitable-strategy-875103.html>
25
to change instead of following what the trend says. This is another commonly made mistake that diminishes the effectiveness of trading with a trend.42
To finalize, it is important to make an emphasis that trend following can be a successful part of a set of trading strategies when used with discipline and following a previously defined set of rules that work for one’s trading personality. It could be said that trend following can be a successful part of a set of trading strategies, since by itself it can be a weak trading system. If trend following is combined with other trading strategies and applied with discipline, it can create a more robust and profitable trading system.
2.5.2.
Volatility Expansion
The volatility expansion trading strategy, as its name suggests, is based on sudden changes of volatility in the price of a trading asset. This strategy usually uses short-term trades. Normally these short-term trades are characterized by a high winning percentage but will provide relatively low profits every trade. Traders that use volatility expansion strategies are out of the market a significant percentage of the time, until they find a rapid change in the volatility.43
Volatility expansion often uses gaps. Gaps are the places where there is no continuity in the price of a tradable asset; in other words, it could be said that where the price of one bar is higher than the high or lower than that low of the previous bar. The concept behind volatility expansion is assuming that if there is a gap, a sudden change in volatility, going
42 Babcock, Bruce. “How to Trade with the Trend.” Reality Based trading Company, 1999. Web. 25 Nov. 2012.
<http://www.rb-trading.com/article9.html>
43 “Trending, Sideways and Volatile Markets.” TradeStation, n.d. Web. 28 Nov. 2012.
26
upwards, the market will continue to go up and if it gaps down the market will continue to go down.44
Figure 3: Volatility expansion gaps44
There are many different ways to apply volatility expansion strategies to a trading system. Depending on the trading personality, the parameters need to be set in order to determine the entry and exit points. In volatility expansion systems, the gaps determine the entry points. The timeframe of the gap periods as well as the exits need to be defined by the trader according to his objectives. Since this strategy has a high percentage of winning trades but the profits are usually low per every trade, this trading strategy can be more profitable when combined with other strategies to obtain a stronger trading system.
2.5.3.
Support and Resistance
This is a widely used strategy for trading various kinds of financial instruments such as currency pairs and stocks. The support and resistance points are defined by the highs and
44 “Markets, Strategies, and Time Frames.” Elite Trader, n.d. Web. 28 Nov. 2012.
27
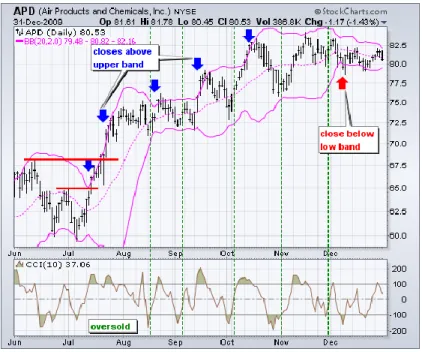
lows of a certain financial instrument over a specific period of time; during this period, the trader can see how the price is bouncing back and forth between these points until the price breaks through either benchmark.45
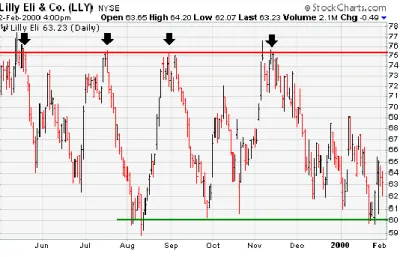
This strategy is also known as floors and ceilings. The floors or the support levels are made of repetitive lows. Support is a price level in which there is a strong enough demand that prevents the price from going down further.46 For instance, in a candlestick chart, the support level would be set when there is a relatively straight line for the lows in which no other low outbreaks the line.
Figure 4: The support in a support and resistance strategy46
On the other hand, there are ceilings or resistance levels. These resistance levels are made of repetitive highs in which no other high outbreaks the price in a certain period of time. The logic behind this is that it is a price level at which there is a strong level of supply that prevents the price from rising.46
45 “Support and Resistance Trading Strategy.” Earn Forex, n.d. Web. 28 Nov. 2012.
<http://www.earnforex.com/forex-strategy/support-resistance-strategy>
46 “Support and Resistance.” Stock Charts, n.d. Web. 28 Nov. 2012.
28
Figure 5: The resistance in a support and resistance strategy46
There is a curious phenomenon that occurs with floors and ceilings in which they switch roles. This means that when a ceiling is breached by the price, that value that used to be ceiling, could eventually turn into a floor. Same with floors that, once breached, they can end up switching their role and acting as ceilings. This phenomenon is something traders could take into account when trading with this strategy.
The support and resistance strategies are based on the principles of demand and supply, which controls the fluctuations of the prices of financial instruments. It is important to take into account that since this is a very commonly used strategy, it is very weak if used by itself to trade. This is due to the fact that many large institutions know that many people use support and resistance and it is very easy for these institutions to manipulate and push prices just a little bit beyond the support or resistance levels to trick people and wipe them out.
29
2.6.
Basic Tools
2.6.1.
Indicators
In the following section, some of the most commonly used indicators will be presented. Even though one’s strategy may not necessarily include all of them, it is important to understand them since they could be used for future strategy development to make a system more robust.
2.6.1.1. Simple Moving Average Indicator
Definition
The simple moving average is one of the most widely used indicators. This is a very basic indicator that basically plots an average of prices according to the number of bars specified in the input length. The three most common moving average indicators are: one line moving average, two lines moving average, and three lines moving average. These three are very similar in the sense that they are all calculating the same arithmetic average using the same formula, what differs is the number of lines they plot and the different time periods they use to calculate the averages.
One line moving average: plots one moving average line. In TradeStation the default length to calculate the average is nine bars.
Two line moving average: plots two moving average lines. Usually one is called the fast average, which has a shorter length, and the slow average, which has a longer length. In TradeStation the default lengths normally are nine bars for the fast line and eighteen bars for the slow line.
30
Three line moving average: plots three moving average lines. Usually one is called the faster average, having the shortest length, the other is called the fast average, having a short length, and the slow average, having the longest length. In TradeStation the default lengths normally are four bars for the fastest, nine bars for the fast, and eighteen bars for the slow moving average. 47
Figure 6: Three Line Moving Average48 Formula
The formula for the one line moving average would be the sum of the number of closing prices that are being analyzed, divided by the same number of closing prices.49 This is the formula for the simple moving average:
∑ ( )
47 “Mov Avg 1 Line (Indicator).” TradeStation Help, n.d. Web. 8 Dec. 2012.
48 “Moving Average Crossovers.” Online Trading Concepts, n.d. Web. 31 Mar. 2013.
<http://www.onlinetradingconcepts.com/TechnicalAnalysis/MASimple2.html >
49“Moving Averages – Simple and Exponential.” n.d. Web. 8 Dec. 2012.
31
Use
This indicator’s main use is to identify a trend in the movement of the price for a given time period. For instance, when the average values are going upward, means that the prices are going above the moving average, and this shows an uptrend. If prices are constantly lower than the average, the moving average indicator would show a down trend.
Possible Application
The moving average indicator is helpful to identify a general trend in the price duration of a certain trading instrument. This could be used to get a broad idea of what is the direction that a certain security is following. However, it is important to be aware that this is a very simple indicator and widely used by many people, so if used by itself it may not be a robust strategy.
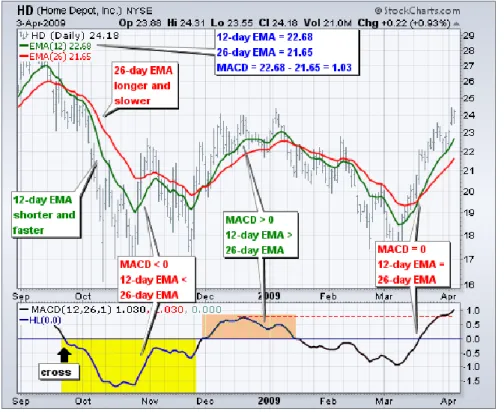
2.6.1.2. Exponential Moving Average Indicator
Definition
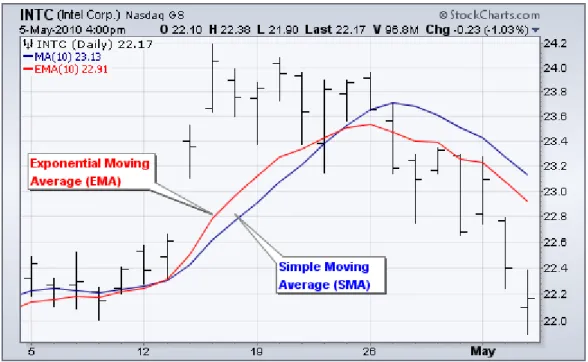
The exponential moving average (EMA) is another very widely used trend indicator similar to the simple moving average (SMA) previously described. The difference from the (SMA) is it gives a greater weight to the market’s most recent prices and a reduced weight to older prices. The exponential moving average values are calculated using the number of bars back specified by the user in the length parameter of the indicator. The default length in TradeStation is nine bars. 50 Figure 7 shows a visual representation of the difference between the EMA and the SMA; as it can be seen, the EMA follow more closely the actual prices.
32
Figure 7: The difference between EMA and SMA51 Formula
In order to calculate the exponential moving average first the simple moving average needs to be calculated –since the EMA needs to starts somewhere and the SMA is used as the first calculation. The second step is calculating the weighting multiplier. Finally, the last step is calculating the exponential moving averages.51
SMA: ∑ ( )
Multiplier: ( ( )
EMA: ( ( )) ( )
Use
This indicator is used to identify the trend of a financial instrument. It can be used to identify long trends or short trends and changes of momentum, according to what the
51“Moving Averages – Simple and Exponential.” n.d. Web. 8 Dec. 2012.
33
trader sets the length to be. Many traders use various EMAs of different lengths in order to be able to track the different price movements and changes of momentum.
Possible Application
This indicator may be used in the same way that the simple moving average indicator, to identify the general trend of a financial asset. Furthermore, another use of this indicator can be to identify changes of momentum. For instance, if using two EMAs, one fast (shorter length) and one slow (longer length), one can see the sudden changes of momentum in a certain instrument when the two EMAs cross. This changes of momentum can help a trader determine when to enter or exit a position.
2.6.1.3. Linear Regression Curve Indicator
Definition
The linear regression curve indicator is a common tool to predict the future values of a trading security relative to its past performance. This indicator plots a curve through price activity. The curve is obtained by plotting a line through each end point of the invisible linear regression trend lines. These invisible trend lines are calculated by plotting the minimal distance between closing prices, using the least squares method, over the number of bars defined in the input length. The default input length in TradeStation is nine bars. 52
34
Figure 8: Linear Regression Curve Indicator53 Formula
The regression line is calculated by using the formula: Ŷ = a + bX. Where a and b are constants, Ŷ is the predicted value of Y, which in this case is price, and X is the number of bars that are moving. Then the least squares function is used to find the invisible linear regression trend lines to plot the minimal distance between closing prices54:
∑( )
Use
Linear regression curves help to predict where the price of the market will be in the near future. When prices are trending up, this indicator tries to determine what the upward bias of the price may be; likewise for when prices are trending down. Some people use this
53 “Linear Regression Curve.” Online Trading Concepts, n.d. Web. 31 Mar. 2013.
<http://www.onlinetradingconcepts.com/TechnicalAnalysis/LinRegCurve.html >
54 Price, Ian. “Least-squares regression line.” n.d. Web. 8 Dec. 2012.
35
indicator to determine if prices are overextended. If they see that prices rise above or fall below the regression curve, they believe that it suggests that the price is overextended and will eventually move back towards the line.
Possible Application
This indicator can be used to monitor a change in price direction. By analyzing the trend of the curves and how are prices moving compared to the curve one can obtain a general idea of overvalued prices that might eventually move back or undervalued prices that might eventually move higher.
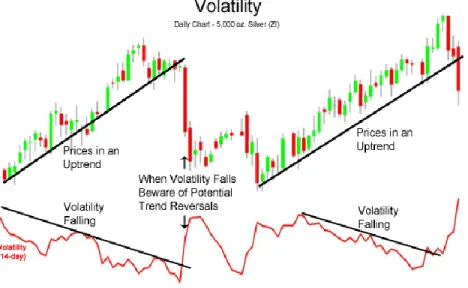
2.6.1.4. Volatility Indicator
Definition
This indicator plots a smoothed average of the “True Range”. This range measures the normal range of a bar, but first checks the previous bar’s closing price to check if it is outside the current bar’s range; if it is outside, the closing price is used instead of the high or low. In this way, the previous close is considered in the current range in order to solve for gaps between bars. 55
36
Figure 9: Volatility Indicator56 Formula
Volatility is basically the standard deviation on the market price studied over a certain period of time. The formula for standard deviation is:
√∑( ̄)
Use
As its name implies, the volatility indicator is used for measuring the market’s volatility based on the price ranges. This indicator helps the analyst to see extreme changes in volatility related to changes in the character and speculation of a given market.
Possible Application
This indicator can help the trader be aware of how volatile a specific market of trading securities is and determine if it fits its trading personality and strategy. Furthermore, the
56 “Volatility.” Online Trading Concepts, n.d. Web. 31 Mar. 2013.
37
volatility indicator is also useful to monitor sudden changes in volatility and to be aware of this fact can be crucial for a successful trading system.
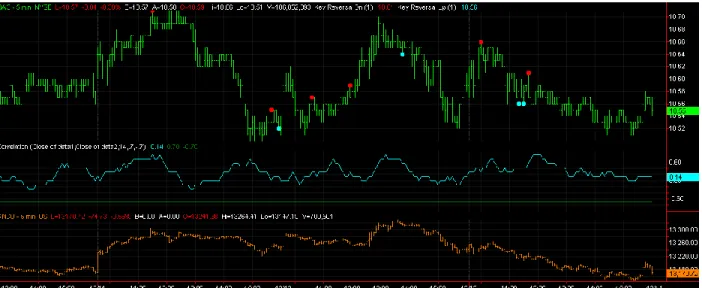
2.6.1.5. Correlation Indicator
Definition
The correlation indicator calculates how frequent the price of two markets moves in the same direction or in an opposite direction during a specified input length, number of bars. These values are plotted as values with a range of -1 to 1. In the end, the correlation indicator, just as its name says, measures the correlation of prices between two markets; better said, their tendency to move in the same direction.
A positive correlation value indicates that the two markets tend to move in the same direction. A negative correlation value indicates a strong tendency for the two markets to move in opposite directions. A correlation value of near zero indicates there is very little correlation between the two markets.
Formula
The formula to calculate the r=correlation coefficient is:
∑ ̄ ( ) ( )
Given a set of observations (x1, y1), (x2,y2),...(xn,yn),
In the formula x would be market 1 and y market 2. s(x) is standard deviation of x and s(y) is standard deviation of y. 57
57 Yale University. “Correlation.” n.d. Web. 9 Dec. 2012.