43
The Effect of Essential Oils on the Bioproductive
Performance of Broilers
Lavinia Stef
1, Eliza Simiz
1, Adela Marcu
1, Ducu Stef
1, Voichita Gherasim
1, Ioan Pet
1,
Silvia Pătruică
1, Mirela Ahmadi
1, Adrian Manciu
1, Calin Julean
11
Banat University of Agricultural Sciences and Veterinary Medicine ”King Michael I of Romania”from Timisoara, Timisoara-300645, Calea Aradului, 119, Romania
Abstract
The purpose of this experiment was to determine the effect of essential oils individually administered in broiler feed on the bio productive performance in each growing period. The broilers were raised according to the ROSS 2014 Growth Guide in three experimental periods, namely: hatching - 10 days, 11 days-21 days, 22-35 days. The chickens were divided into 9 experimental groups, 3 replicates each and 10 chickens per replication. Oils were incorporated into compound feed on a support of sunflower oil. The offspring in the experimental T0 group received unleavened compound feed. Chickens from T1 and T2 were fed with a combined feed in which the incorporated essential oil was oregano 125 or 250 ppm in combined feed, those in T3 and T4 consumed aniseed feed at the same doses, T7 and T8 a feed combined with fennel, and those in T9 and T10 were treated with a feed mixed with Black cumin in the same amount. In the first growth period it was found that the highest body weight was recorded at T2 (259.9 g) and also the smallest feed conversion index was recorded in this group. In the 11-21 day period T2 recorded both the highest body weight (914.80g) and the lowest feed conversion index (1.293). In the period 22-35 days, the highest body weight was recorded at T2 (2159.80) and the lowest conversion index of food at T2 (1.599). In the last growth period, namely 35-42 days, the highest body weight was recorded at T1 (2759.20) and the lowest FCR at T2 (1.948). It can be concluded that the individual administration of essential oils (Aetheroleum Origanum vulgare L.) influences the bio productive performances of the broilers causing an improvement in them.
Keywords: broiler, essential oil, growth promoters
Introduction
Although antibiotics have been prohibited since 2006, many farms specialized in broiler chickens are still using them, especially during the first growth period when chickens are prone to diseases. Much of the research focuses on finding alternatives to the use of antibiotics. Given the increasing concerns regarding the intensive use of antibiotics in animal production, there is an increasing interest in preparing an alternative strategy to fight diseases in order to improve animal health and reduce the use of antibiotics. A
* Corresponding author:Calin Julean
Tel: 0747996005, Email: [email protected]
44
negatively affected by diseases and losses recorded because of these restrictions [4]. During the research regarding the growth promoters as alternatives to antibiotics, many researchers investigated the effects of essential oil components on the growth performance of broiler chickens [5-7]. Essential oils are derived mainly from spices and herbs and their constituents, with antimicrobial effects in vitro [8, 9]. As regards the antimicrobial activity, we can expect thymol and carvacrol to show positive effects on the broiler chickens growth performance [10].
2. Materials and methods
The experiment intended to set the effects of some essential oils on some bio productive indexes in broiler chickens was carried out for a period of six weeks. The biologic material used was broiler chickens from Ross 308 hybrid. The chickens were brought to the age of six weeks only using a combined feed recommended in the aforementioned hybrid breeding guide. Chickens were divided into control group and 8
experimental groups according to the
organizational diagram in Table 1.
Table 1. Organization scheme of the experiment
Treatment No. of chickens Essential oil: Aetheroleum: Dose level (ppm)
T0 30 - -
T1 30
Oregano (Origanum vulgare L.) 125
T2 30 250
T3 30
Anise (Pimpinella anisum) 125
T4 30 250
T7 30
Fennel (Foeniculum vulgare) 125
T8 30 250
T9 30
Black cumin (Nigella sativa) 125
T10 30 250
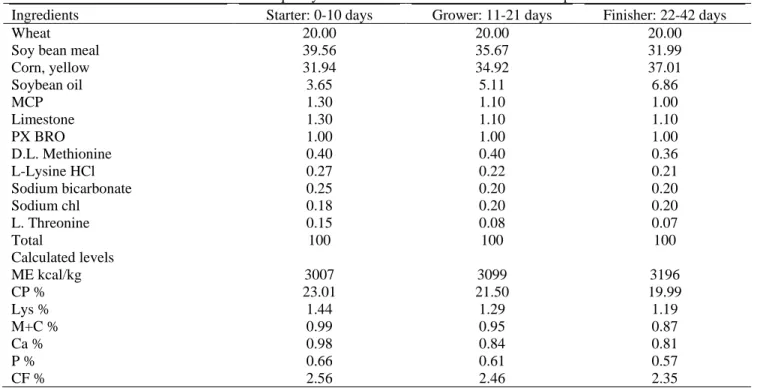
Broiler chickens were bred according to the breeding guide ROSS 2014, on four experimental periods, namely: hatching - 10 days, 11 days - 21
days, 22-35 days, and 36 - slaughter. The combined feeds used for the experiment are indicated in Table 2.
Table 2. Structure and quality conditions of fodders used within the experiment
Ingredients Starter: 0-10 days Grower: 11-21 days Finisher: 22-42 days
Wheat 20.00 20.00 20.00
Soy bean meal 39.56 35.67 31.99
Corn, yellow 31.94 34.92 37.01
Soybean oil 3.65 5.11 6.86
MCP 1.30 1.10 1.00
Limestone 1.30 1.10 1.10
PX BRO 1.00 1.00 1.00
D.L. Methionine 0.40 0.40 0.36
L-Lysine HCl 0.27 0.22 0.21
Sodium bicarbonate 0.25 0.20 0.20
Sodium chl 0.18 0.20 0.20
L. Threonine 0.15 0.08 0.07
Total 100 100 100
Calculated levels
ME kcal/kg 3007 3099 3196
CP % 23.01 21.50 19.99
Lys % 1.44 1.29 1.19
M+C % 0.99 0.95 0.87
Ca % 0.98 0.84 0.81
P % 0.66 0.61 0.57
45 The chickens were divided into 9 experimental groups, 3 replicates each and 10 chickens per replication. Oils were incorporated into compound feed on a support of sunflower oil. The chickens in experimental group T0 received oil free combined feed. The chickens in T1 and T2 received combined feed where oregano essential oil included was 125 ppm, respectively 250 ppm, chickens in T3 and T4 received feed with anise essential oil in the same doses, T7 and, respectively, T8 received combined feed with fennel essential oil and T9, T10 received black cumin essential oil in the same doses (Table 1). Chickens were weighted at 10, 21, 35 and 42 days. Also, the amounts of feed given to the chickens were recorded on a daily basis. At the end of each experimental period, the amount of leftovers was also weighted. The difference between the amount used and the leftovers was used to calculate the amount of feed consumed by the chickens in each replication, respectively experimental variant. By dividing this amount to the number of chickens in each replication, the amount of feed consumed by each chicken was obtained.
The difference between nutritional and bio productive indexes was tested by means of the ANOVA test at experiment level and the
difference between the groups by means of the LSD test.
3. Results and discussion
Period hatching - 10 days
During the period between hatching to 10 days, a first bio productive index monitored was the body weight. From the data present in table 3, we can see that the highest body weight was recorded at T2, a group fed with combined feed with oregano included in a dose of 250 ppm. The lowest body weight was recorded at T8, where fennel was included in the same amount. The remaining experimental groups showed weights between these two groups, T2, respectively T8. The statistical processing of the data resulted in significant differences between T1 vs T8 (P<0.01) and T2 vs T7, T8, T9, T10 (P<0.01). Also, significant differences were recorded between T0 vs T2;T1 vs T7; T2 vs T4 (P<0.05). As compared to the control group, groups T1, T2 and T3 recorded highest body weights, while the remaining groups recorded lower body weights. The same evolution as the body weights was recorded for the weight addition (Table 3).
Table 3. Feed consumption and bio productive indexes in broiler chickens in experimental groups
Item Overall performance (d 1–10) (average±SD1)
BW_10 days(g) Gain (g/bird) FI2 (g/bird) FCR3 (kg:kg)
Treatment
Control T0 239.80±23.41 198.00±9.84 217.56±9.33 1.099±0.028
T1 250.70±15.55 211.85±7.68 225.80±6.00 1.066±0.013
T2 259.90±27.55 221.33±8.08 229.20±8.11 1.035±0.001
T3 242.90±16.60 204.20±12.84 218.67±8.32 1.075±0.111
T4 238.80±17.50 200.00±13.45 214.66±9.07 1.078±0.111
T7 226.40±23.49 187.40±8.91 208.00±7.21 1.110±0.082
T8 224.50±17.35 185.53±9.45 207.50±11.30 1.120±0.114
T9 232.30±19.05 193.50±11.82 209.86±8.35 1.088±0.099
T10 233.50±30.69 194.67±9.45 212.26±11.29 1.093±0.110
P-value ANOVA test4 0.011* 0.009** 0.107 0.970
Significant differences
P<0.001 - T2 vs T8. - -
P<0.01 T1 vs T8; T2 vs T7, T8, T9, T10.
T1 vs T7, T8; T2 vs T7; T9, T10.
-
P<0.05 T0 vs T2; T1 vs T7; T2 vs T4.
T0 vs T2; T1vs T9; T2 vs T4;’ T3 vs T8.
T1 vs T7, T8; T2 vs T7, T8, T9, T10.
-
1
46 As regards the feed intake, we can see that the highest feed intake was also recorded for group T2 and the lowest for T8. Significant differences were recorded between T1 vs T7, T8; T2 vs T7, T8, T9, T10, (p<0.05). Corroborating the feed intake data with the body weight data, we obtained the feed conversion rate (FCR). In this case also, the lowest feed conversion rate was recorded at T2 and the highest at T8. The differences between groups, in terms of FCR, were statistically insignificant. Adding 200 ppm carvacrol in a corn soy grit based diet reduced the weight by 3% between 1-28 days [8, 9].
Period 11-21 days
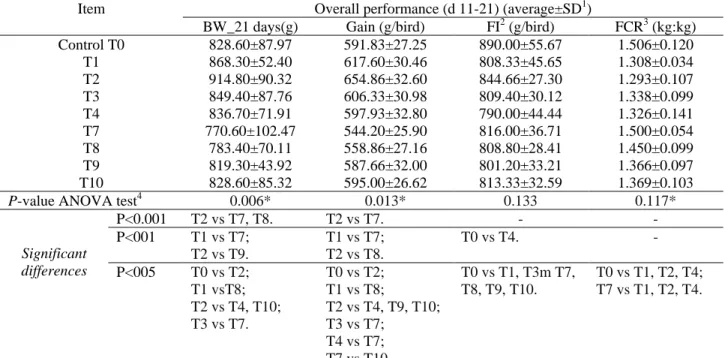
During the period 11-21 days, the highest body weight was recorded by T2 and the lowest by T7 fed with combined feed with fennel in amount of 125 ppm (Table 4). Significant differences were as
follows: T2 vs T7, T8, (P<0.001), T1 vs T7, T2 vs T9 (P<0.01), T0 vs T2; T1 vs T8; T2 vs T4, T10; T3 vs T7, (P<0.05). The differences between the weight additions are similar to those recorded for the body weight, as indicated in Table 3. The lowest feed intake was recorded at T4, respectively chickens fed with combined feed with anise included in amount of 250 ppm. The highest intake was recorded at T2. The significant differences between groups are shown in table 3. Corroborating the feed intake data with the body weight data, we found that the lowest FCR was recorded at chickens in group T2 (1.293) fed with combined feed with oregano (250 ppm in combined feed). This time, the highest FCR was recorded by the control group (1.506). The significant differences between groups are shown in Table 4.
Table 4. Evolution of bio productive indexes and feed consumption in broiler chickens in experimental groups
Item Overall performance (d 11-21) (average±SD1)
BW_21 days(g) Gain (g/bird) FI2 (g/bird) FCR3 (kg:kg)
Control T0 828.60±87.97 591.83±27.25 890.00±55.67 1.506±0.120
T1 868.30±52.40 617.60±30.46 808.33±45.65 1.308±0.034
T2 914.80±90.32 654.86±32.60 844.66±27.30 1.293±0.107
T3 849.40±87.76 606.33±30.98 809.40±30.12 1.338±0.099
T4 836.70±71.91 597.93±32.80 790.00±44.44 1.326±0.141
T7 770.60±102.47 544.20±25.90 816.00±36.71 1.500±0.054
T8 783.40±70.11 558.86±27.16 808.80±28.41 1.450±0.099
T9 819.30±43.92 587.66±32.00 801.20±33.21 1.366±0.097
T10 828.60±85.32 595.00±26.62 813.33±32.59 1.369±0.103
P-value ANOVA test4 0.006* 0.013* 0.133 0.117*
Significant differences
P<0.001 T2 vs T7, T8. T2 vs T7. - -
P<001 T1 vs T7; T2 vs T9.
T1 vs T7; T2 vs T8.
T0 vs T4. -
P<005 T0 vs T2; T1 vsT8; T2 vs T4, T10; T3 vs T7.
T0 vs T2; T1 vs T8;
T2 vs T4, T9, T10; T3 vs T7;
T4 vs T7; T7 vs T10.
T0 vs T1, T3m T7, T8, T9, T10.
T0 vs T1, T2, T4; T7 vs T1, T2, T4.
1
SD=standard deviation; 2FI=feed intake; 3FCR=feed conversion ratio; 4Significance level ANOVA test (P≤0.05) with LSD test; *p<0.05; **p<0.01.
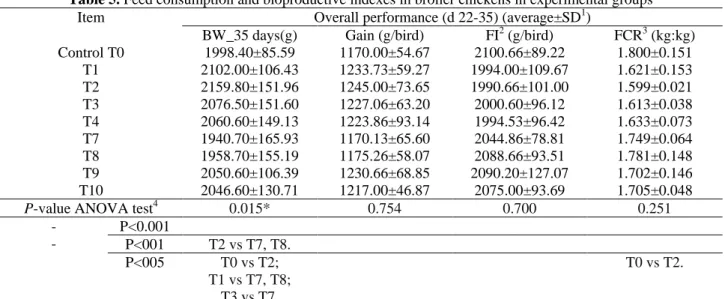
Period 22-35 days
During the 22-35 days period (Table 5), the experimental variant T2 recorded the highest body weight, respectively 2159.80 g, and T the lowest body weight, 1940.70g. The statistical processing resulted in significant differences between groups, as follows: T2 vs T7, T8, (P<0.01), T0 vs T2; T1 vs T7, T8; T3 vs T7, (P<0.05). The weight addition recorded during this period showed as
47 dietary oregano essential oil and anticoccidial supplementation improved the FCR significantly (P<0.05) from 21 to 42 d and 1 to 42 d of age, respectively, compared with the negative control
diet. Birds fed with the oregano oil diet consumed significantly less feed compared with those fed with the negative control diet from 21 to 42 d and from 1 to 42 d of age [11].
Table 5. Feed consumption and bioproductive indexes in broiler chickens in experimental groups
Item Overall performance (d 22-35) (average±SD1)
BW_35 days(g) Gain (g/bird) FI2 (g/bird) FCR3 (kg:kg)
Control T0 1998.40±85.59 1170.00±54.67 2100.66±89.22 1.800±0.151
T1 2102.00±106.43 1233.73±59.27 1994.00±109.67 1.621±0.153
T2 2159.80±151.96 1245.00±73.65 1990.66±101.00 1.599±0.021
T3 2076.50±151.60 1227.06±63.20 2000.60±96.12 1.613±0.038
T4 2060.60±149.13 1223.86±93.14 1994.53±96.42 1.633±0.073
T7 1940.70±165.93 1170.13±65.60 2044.86±78.81 1.749±0.064
T8 1958.70±155.19 1175.26±58.07 2088.66±93.51 1.781±0.148
T9 2050.60±106.39 1230.66±68.85 2090.20±127.07 1.702±0.146
T10 2046.60±130.71 1217.00±46.87 2075.00±93.69 1.705±0.048
P-value ANOVA test4 0.015* 0.754 0.700 0.251
- -
P<0.001
P<001 T2 vs T7, T8.
P<005 T0 vs T2;
T1 vs T7, T8; T3 vs T7.
T0 vs T2.
1
SD=standard deviation; 2FI=feed intake; 3FCR=feed conversion ratio; 4Significance level ANOVA test (P≤0.05) with LSD test; *p<0.05; **p<0.01.
Period 36-42 days
During the last growth period (Table 6), groups T1 recorded the highest body weight (2759.20 g). The lowest body weight was recorded by T7, respectively (2575.80 g). Significant differences were recorded as follows: T7 vs T1, T2, T3, (P<0.05). In this case, also, the weight addition
showed the same evolution as the body weight. The lowest FCR was recorded by chickens in T2 (1.948 g) and the highest by those in the control group (2.208 g). The differences between the groups resulting from the statistical processing are as follows: T0 vs T1, T2; T2 vs T7 (P<0.01),T0 vs T3, T4; T1 vs T7, T8, (P<0.05).T3 vs T7, T8; T4 vs T7.
Table 6. Nutritional and bio productive indexes in broiler chickens in experimental groups (36-42 days)
Item Overall performance (d 36-42) (average±SD1)
BW_42 days(g) Gain (g/bird) FI2 (g/bird) FCR3 (kg:kg)
Control T0 2644.60±177.86 646.20±25.27 1424.66±54.93 2.208±0.161
T1 2759.20±137.70 657.20±25.37 1301.20±49.82 1.981±0.086
T2 2728.40±280.42 668.60±33.92 1300.40±25.68 1.948±0.104
T3 2728.620±172.11 652.13±35.30 1297.80±53.05 1.991±0.055
T4 2710.60±143.64 650.60±13.74 1302.80±54.95 2.005±0.113
T7 2575.80±101.72 635.13±34.92 1368.20±58.13 2.155±0.029
T8 2616.60±128.09 657.86±36.62 1412.66±82.92 2.147±0.042
T9 2717.60±146.78 667.00±28.16 1394.80±81.08 2.090±0.038
T10 2694.20±157.84 648.60±40.35 1360.60±91.89 2.097±0.051
P-value ANOVA test4 0.253 0.942 0.111 0.018*
Significant differences
P<0.001 - -
P<001 - - T0 vs T1, T2;
T2 vs T7.
P<005 T7 vs T1, T2, T3. - T0 vs T1, T2, T3,
T4;
T8 vs T1, T2, T3, T4.
T0 vs T3, T4; T1 vs T7, T8, T3 vs T7, T8; T4 vs T7.
1
48
Lee and col. [12] analyzed the classification and synthesis of essential oils and their biological effects on the chicken growth. These indicated that results contradict the effects of essential oils on the growth performances in chickens
Lee et al. [12] reported that a 200 ppm carvacrol concentration, compared to thymol, in broiler chickens reduced the body weight and the feed consumption, but improved the feed rate: a gain at the age of 4 weeks. Botsoglou et al. [13] indicated that oregano oil did not show any growth promotion effects in broiler chickens when used in amounts of 50 or 100 mg/kg of feed.
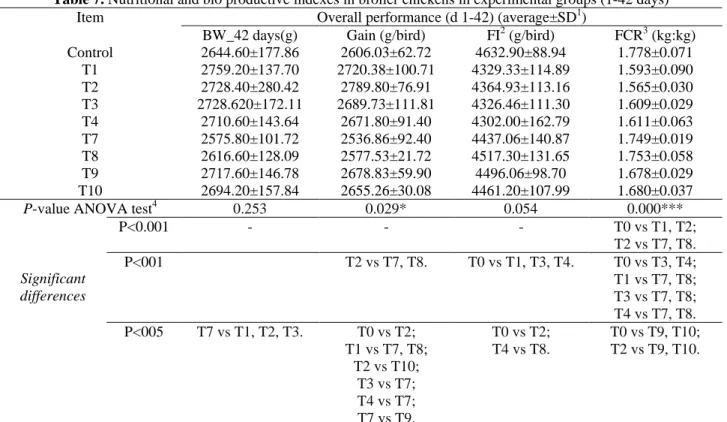
Period hatching -42 days
During the entire growth period, the highest weight addition was recorded by the chickens in T2, respectively those fed with feed with oregano included in amount of 250 ppm (2789.80 g). The
lowest weight addition was recorded by chickens in (2536.86 g). The differences recorded were as follows:T2 vs T7, T8, (P<0.01), T0 vs T2; T1 vs T7, T8; T2 vs T10; T3 vs T7; (P<0.05). As regards the feed intake, we can see that the highest feed intake was recorded by the chickens in the control group (4632.90 g) and the lowest by the chickens in T3 (4326.46 g). The correlation between the feed consumption data and the body weight data results in the FCR. We can see that the lowest FCR was recorded at T2 (1.565) and the highest at the control group (1.778). The statistical processing of the data resulted in significant differences between the experimental groups, as follows: T0 vs T1, T2; T2 vs T7, T8.(P<0.001), T0 vs T3, T4;T1 vs T7, T8; T3 vs T7, T8; T4 vs T7, T8, (P<0.01), T0 vs T9, T10; T2 vs T9, T10. (P<0.05).
Table 7. Nutritional and bio productive indexes in broiler chickens in experimental groups (1-42 days)
Item Overall performance (d 1-42) (average±SD1)
BW_42 days(g) Gain (g/bird) FI2 (g/bird) FCR3 (kg:kg)
Control 2644.60±177.86 2606.03±62.72 4632.90±88.94 1.778±0.071
T1 2759.20±137.70 2720.38±100.71 4329.33±114.89 1.593±0.090
T2 2728.40±280.42 2789.80±76.91 4364.93±113.16 1.565±0.030
T3 2728.620±172.11 2689.73±111.81 4326.46±111.30 1.609±0.029
T4 2710.60±143.64 2671.80±91.40 4302.00±162.79 1.611±0.063
T7 2575.80±101.72 2536.86±92.40 4437.06±140.87 1.749±0.019
T8 2616.60±128.09 2577.53±21.72 4517.30±131.65 1.753±0.058
T9 2717.60±146.78 2678.83±59.90 4496.06±98.70 1.678±0.029
T10 2694.20±157.84 2655.26±30.08 4461.20±107.99 1.680±0.037
P-value ANOVA test4 0.253 0.029* 0.054 0.000***
Significant differences
P<0.001 - - - T0 vs T1, T2;
T2 vs T7, T8.
P<001 T2 vs T7, T8. T0 vs T1, T3, T4. T0 vs T3, T4;
T1 vs T7, T8; T3 vs T7, T8; T4 vs T7, T8.
P<005 T7 vs T1, T2, T3. T0 vs T2;
T1 vs T7, T8; T2 vs T10;
T3 vs T7; T4 vs T7; T7 vs T9.
T0 vs T2; T4 vs T8.
T0 vs T9, T10; T2 vs T9, T10.
1
SD=standard deviation; 2FI=feed intake; 3FCR=feed conversion ratio; 4Significance level ANOVA test (P≤0.05) with LSD test; *p<0.05; **p<0.01
4. Conclusions
1. The inclusion of oregano essential oil in amount of 250 ppm in the combined feed of broiler chickens entails higher body weights and weight additions as compared to chickens fed with other
oils or chickens not fed with fed with essential oils, both at the end of the breeding stage and during the growth stages.
49 oregano essential oil included in amount of 250 ppm.
3. The oregano essential oil leads to the improvement of nutritional and bioproductive indexes in broiler chickens as compared to the use of other essential oils.
References
1. Lee, S. H., Lillehoj, H. S., Jang, S., Kim, D. K., Ionescu, C. and Bravo, D., Effect of dietary curcuma, capsicum, and lentinus on enhancing local immunity against Eimeria acervulina infection, 2010, 47, 89-95. 2. Lillehoj, H. S., Kim, D. K., Bravo, D. M. and Lee, S. H., Effects of dietary plant-derived phytonutrients on the genome-wide profiles and coccidiosis resistance in the broiler chickens, International Symposium on Animal Genomics for Animal Health. Paris, France, 31 May–2 June, 2010.
3. Schuff, S., Journal says antibiotic use needs restricting, Feedstuffs, 2001, 73(44), 5.
4. Karimi, A., Yan, F., Coto, C., Park, J. H., Min, Y., Lu, C., Gidden, J. A., Lay Jr, J. O. and Waldroup, P. W., Effects of level and source of oregano leaf in starter diets for broiler chicks, 2010, 19, 137-145. 5. Lee, K. W., Everts, H. Kappert H. J., Frehner M., Losa, R. and Beynen A. C., Effects of dietary essential oil components on growth performance, digestive enzymes and lipid metabolism in female broiler chickens, Br. Poult. Sci., 2003a, 44, 450-457.
6. Lee, K. W., Everts, H., Kappert, H. J., Yeom, K. H. and Beynen, A. C., Dietary carvacrol lowers body
weight gain but improves feed conversion in female broiler chickens, J. Appl. Poult. Res., 2003b, 12, 394-399.
7. Lee, K. W., Everts, H., Lankhorst, Ae., Kappert, H. J. and Beynen, A. C., Addition of beta-ionone to the diet fails to affect growth performance in female broiler chickens, Anim. Feed Sci. Tec., 2003c, 106, 219-223. 8. Deans, S. G., and Ritchie, G., Antibacterial properties of plant essential oils, Int. J. Food Microbiol., 1997, 5, 165–180.
9. Hammer, K. A., Carson, C. F. and Riley, T. V., Antimicrobial activity of essential oils and other plant extracts, J. Appl. Microbiol., 1999, 86, 985-990. 10. Wenk, C., Recent advances in animal feed additives such as metabolic modifiers, antimicrobial agents, probiotics, and enzymes and highly available minerals, Review. Asian-Aus, J. Anim. Sci., 2000, 13, 86-95. 11. Al, M., Midilli, M., Kocabağ, N., Yılmaz, H., Turan, N., Gargıl, A., and Acar, N., The effects of dietary oregano essential oil on live performance, carcass yield, serum immunoglobulin G level, and oocyst count in broilers, J. Appl. Poult. Res., 2012, 21, 630–636.
12. Lee, K. W., Everts, H. and Beynen, A. C., Essential oils in broiler nutrition, Int. J. Poult. Sci., 2004, 3, 738-752.