http://www.sciencepublishinggroup.com/j/mlr doi: 10.11648/j.mlr.20170202.12
Data Mining of Access to Tetanus Toxoid Immunization
Among Women of Childbearing Age in Ethiopia
Kedir Hussein Abegaz
1, *, Emiru Merdassa Atomssa
21
Biostatistics and Health Informatics, Public Health Department, College of Health Sciences, Madda Walabu University, Bale Goba, Ethiopia 2
Biostatistics and Health Informatics, West Wollega Zonal Health Department, Gimbi, Oromia, Ethiopia
Email address:
kedir6300@gmail.com (K. H. Abegaz) *
Corresponding author
To cite this article:
Kedir Hussein Abegaz, Emiru Merdassa Atomssa. Data Mining of Access to Tetanus Toxoid Immunization Among Women of Childbearing Age in Ethiopia. Machine Learning Research. Vol. 2, No. 2, 2017, pp. 54-60. doi: 10.11648/j.mlr.20170202.12
Received: February 7, 2017; Accepted: February 21, 2017; Published: March 9, 2017
Abstract:
Tetanus toxoid (TT) vaccine is given to women of childbearing age to prevent neonatal tetanus and maternal mortality attributed to tetanus. Globally, tetanus is responsible for 5% of maternal deaths and 14% of neonatal deaths annually. Data mining is the process of discovering interesting patterns and knowledge from large amounts of data. Thus, the aim of this study was to identify the best classifier, and to predict the pattern from the TT data set using the data mining algorithms technique. The data for this study were the Tetanus Toxoid data set from the Ethiopian Demographic and Health Survey (EDHS) 2011, and analyzed using the Knowledge discovery process of Selection, Processing, Transforming, mining, and interpretation. The WEKA 3.6.1 tool was used for classification, clustering, association and attribute selection. The accuracy rate of the classifiers on training data is relatively higher than on test data and the multilayer perceptron is the best classifier in our data set on Tetanus toxoid. In the cross-validation with 10 folds, correctly classified best are by naïve Bayesian 63.30% and the least accurate were by k-nearest neighbor 60.52%. Single data instance test using Naïve Bayesian was done by creating test 1, test 2, test 3, and test 4 data test instance, three of them are correctly predicted but one of them incorrectly classified. The maximum confidence attained in the general association is 0.98. But, in the class attribute, it is 0.72. The literacy status of the mother has high information gain with the value 0.046. As a conclusion, the best algorithm based on the TT vaccination data is multilayer perceptron classifier with an accuracy of 67.28% and the total time taken to build the model is at 0.01 seconds. Multilayer perceptron classifier has the lowest average error at 32.72% compared to others. These results suggest that among the machine learning algorithm tested, multilayer perceptron classifier has the potential to significantly improve the conventional classification methods for use in EDHS data of Tetanus toxoid.Keywords:
Data Mining, WEKA, Classification, Clustering, Tetanus Toxoid (TT), EDHS1. Introduction
Tetanus toxoid (TT) vaccine is given to women of childbearing age to prevent neonatal tetanus and maternal mortality attributed to tetanus. And the major cause of early infant deaths in many developing countries is often due to failure to observe hygienic procedures during delivery. Thus, women receive doses of tetanus toxoid to protect their birth against neonatal tetanus [1]. Tetanus is caused by a toxin produced during the anaerobic growth of Clostridium tetani. Infection is acquired through environmental exposure of any broken skin or dead tissue such as a wound or when the umbilical cord is cut to the spores of the bacteria. WHO
estimates that only 5% of Neonatal Tetanus (NNT) cases are reported, even from countries with well-developed surveillance systems [2].
of deliveries taking place at home in unsanitary conditions. In Ethiopia in 1999 WHO has estimated about 17,875 neonatal tetanus cases and 13406 NNT deaths which made the country to contribute to 4.6% of the global NNT deaths [3].
Ethiopia’s Expanded Program on Immunization (EPI) started in 1980 and remains the single most important component of primary health care supported by the Ministry of Health. The vaccine to prevent Maternal Neonatal Tetanus (MNT) introduced as part of routine immunization programs in over 100 countries by the end of 2011. Vaccination coverage with at least two doses of tetanus toxoid vaccine estimated at 70% in 2011 and an estimated 82% of newborns protected against neonatal tetanus through immunization [3]. However, until now maternal and neonatal tetanus persist as public health problems in 36 countries, mainly in Africa and Asia.
The TT vaccination schedule in Ethiopia for childbearing women follows the schedule recommended by WHO for developing countries [6]. Immunizing the mother prior to childbirth with TT protects both her and her newborn against tetanus and antenatal care is the main programmatic entry point for routine TT immunization. A pregnant woman should receive at least two doses while pregnant unless she already has immunity from previous TT vaccinations. Five doses of TT can ensure protection throughout the reproductive years and even longer.
Data mining is the process of discovering interesting patterns and knowledge from large amounts of data. It is a young and fast-growing field also known as knowledge discovery from data (KDD) and used for discovering interesting patterns from data in various applications [7].
The health care industry is one of the world’s largest and fastest growing industries having a huge amount of healthcare data. This health care data include relevant information about Client, their treatment, and resource management data. The information is rich and massive. Hidden relationships and trends in healthcare data can be discovered from the application of data mining techniques. Data mining techniques are more effective that has used in healthcare research. In this study, we have used several data mining techniques; classification, clustering, association and outlier detection techniques over the nominated Tetanus Toxoid immunization dataset of the EDHS 11.
The main objective of this project was to identify the best classifier, and to predict the pattern from the TT data set using the data mining algorithms and tools for tetanus toxoid vaccination and to connect the technical field public health and medical field to serve the community. The rationale for selecting this as a study is that in Ethiopia, the health workers are not using the accumulated medical data for prediction purpose. This problem caused the loss of time and effort in the healthcare system environment and spending lots of efforts and costs without having evidence-based information for planning and intervention.
2. Knowledge Discovery Process
In this study, we use different data mining techniques that
have been tested on TT dataset. The standards used are a percentage of accuracy and error rate of every classification techniques used. The technique which is suitable for a particular dataset is chosen based on highest classification accuracy rate and less error rate.
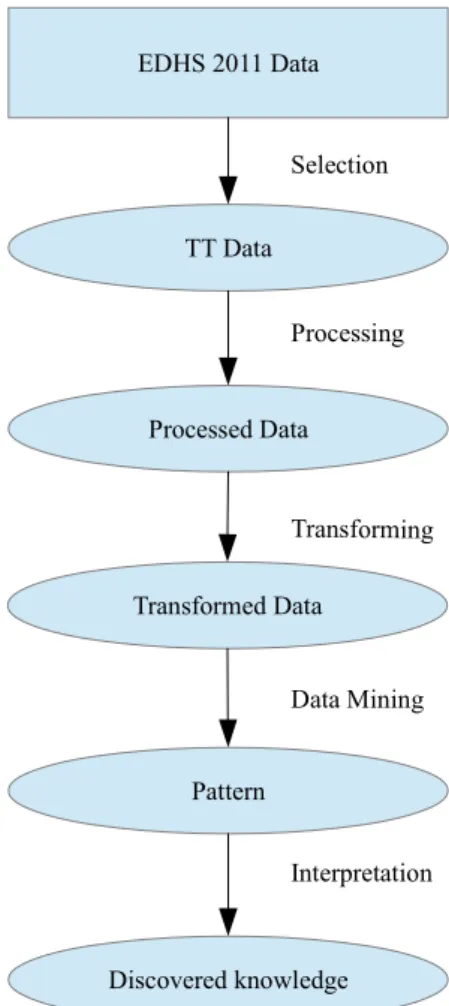
Applying data mining, used for the discovery of hidden but useful knowledge from EDHS 2011 dataset. This process must have a model to control its execution steps. Knowledge discovery from data for prediction of the tetanus toxoid immunization among the women of childbearing age in Ethiopia following the standard process, guiding us in the analysis process, and exposing those aspects that could otherwise be neglected. The Figure 1(Adapted from [7]) shows, the basic phases of the knowledge discovery from data, we have undergone. Selection phase generates the target data set from the whole data set of EDHS 2011. Preprocessing solves issues about noise, incomplete and inconsistent data. The next phase is the transformation of the preprocessed data into a suitable form for performing the desired data mining task. In the data mining phase, a procedure is run that executes the desired task and generates a set of patterns.
Figure 1. TheKDD process for the TT Data of EDHS 11.
However, not all of the patterns are useful. The goal of interpreting and evaluating all the patterns discovered is to keep only those patterns that are interesting and useful to the user and discard the rest. Those patterns that remain represent the discovered knowledge.
TT Data EDHS 2011 Data
Selection
Processing
Transforming
Data Mining Processed Data
Transformed Data
Pattern
3. Methodology
The methodology of this study was the practical research method applied on the Tetanus Toxoid data of the Ethiopian DHS 2011.
3.1. Data Understanding
The EDHS 2011 was conducted by the Central Statistical Agency (CSA) in collaboration with Measure DHS and ICF International under the auspices of the Ethiopian Ministry of Health (EMoH). For this particular study, the dataset was requested and accessed from DHS website https://dhsprogram.com after formal online registration and submission of project title and detail project description.
3.2. Data Preprocessing
The EDHS of 2011 dataset was used as a source for this study and WEKA 3.6.1 machine learning tools are used. In this tool we have been applied different classification algorithms, clustering and predict a useful result that will be very helpful for the health care planner, new users, and new researchers. The data used in this investigation are the TT immunization data. It has a dimension of 7033 rows and 12 columns. This data processed and arranged for the purposes of training and testing. Only 80% of the overall data is used for
training and the rest 20% was used for testing the accuracy of the classification of the selected classification methods.
Data values and attributes were modified, added and/or deleted, filtered, recorded, dropped the missing values, transformed and attributes are integrated in order to be used by the machine learning techniques in the analysis step for the study. Finally, data have been saved in “. csv” file formats and stored as an “. arff” file format.
3.3. Classification
Classification is one of the data mining techniques and it is used to group the instances which belong to same class [8]. Classification also extracts models describing important data classes. Such models, called classifiers, predict categorical class labels (nominal, ordinal). The classification has numerous applications, including fraud detection, target marketing, performance prediction, manufacturing, and medical diagnosis. How does this classification work? Data classification has two steps; Firstly, consisting of a learning step that is, where a classification model is constructed. And the classification step that is, where the model is used to predict class labels for given data [7]. The classification methods used in this study is to classify data according to their classes putting the data in a single group that belongs to a common class. The approaches are;
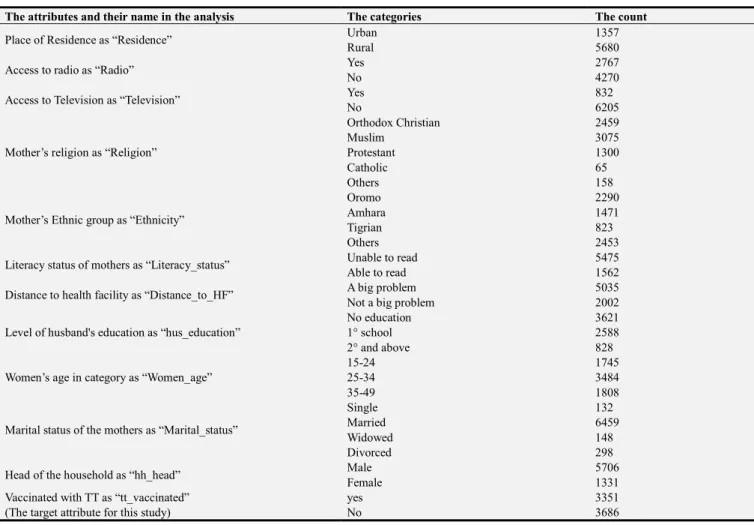
Table 1. The list of attributes, their naming in the EDHS 2011.
The attributes and their name in the analysis The categories The count
Place of Residence as “Residence” Urban 1357
Rural 5680
Access to radio as “Radio” Yes 2767
No 4270
Access to Television as “Television” Yes 832
No 6205
Mother’s religion as “Religion”
Orthodox Christian 2459
Muslim 3075
Protestant 1300
Catholic 65
Others 158
Mother’s Ethnic group as “Ethnicity”
Oromo 2290
Amhara 1471
Tigrian 823
Others 2453
Literacy status of mothers as “Literacy_status” Unable to read 5475
Able to read 1562
Distance to health facility as “Distance_to_HF” A big problem 5035
Not a big problem 2002
Level of husband's education as “hus_education”
No education 3621
1° school 2588
2° and above 828
Women’s age in category as “Women_age”
15-24 1745
25-34 3484
35-49 1808
Marital status of the mothers as “Marital_status”
Single 132
Married 6459
Widowed 148
Divorced 298
Head of the household as “hh_head” Male 5706
Female 1331
Vaccinated with TT as “tt_vaccinated” (The target attribute for this study)
yes 3351
(a). Decision tree (J48) approach
It is a flowchart-like a tree structure. Where each branch represents an outcome of the test, each internal node denotes a test on an attribute, and each leaf node holds a class label. And the topmost node in a tree is the root node. This approach uses divide and conquers algorithm to split a root node into a subset of two partitions till leaf node that occurs in a tree. [8, 9]
(b). K-Nearest Neighbor Classifiers
K-Nearest Neighbor is one of the simplest classifier which discovers the unidentified data point using the previously known data points, that is, nearest neighbor [10]. It is labor intensive when given large training sets and it has been widely used in the area of pattern recognition. This method of classifiers is based on learning by analogy, by comparing a given test tuple with training tuples that are similar to it. The training tuples are described by m attributes. Each of the tuples represents a point in an m-dimensional space. In this way, all the training tuples are stored in an m-dimensional pattern space. When given an unknown tuple, a k-nearest-neighbor classifier searches the pattern space for the k training tuples that are closest to the unknown tuple. These k training tuples are the k “nearest neighbors” of the unknown tuple [7, 10].
(c). Bayes Classification Methods
Bayes classifiers are statistical classifiers based on Bayes’ theorem, which is probabilistic learning method. They can predict class membership probabilities like, the probability that a given tuple belongs to a particular class [10, 11]. Bayesian classifiers have also exhibited high accuracy and speed when applied to large databases. Naïve Bayesian classifiers assume that the effect of an attribute value on a given class is independent of the values of the other attributes. This assumption is called class conditional independence. It is made to simplify the computations involved and, in this sense, is considered “Naïve” [7].
(d). Multilayer preceptor
Multilayer preceptor is a simple two-layer neural network classifier with no hidden layers.
3.4. Evaluating Classifier Performance
This is for assessing how “accurate” your classifier is at predicting the class label of tuples. We will consider the case of where the class tuples are more or less evenly distributed, as well as the case where classes are unbalanced.
Confusion matrix; is used in this study, include accuracy, sensitivity, specificity, and precision. There are four additional terms we need to know that are the “building blocks” used in computing many evaluation measures. Understanding them will make it easy to grasp the meaning of the various measures.
True positives (TP): These refer to the positive tuples that were correctly labeled by the classifier. TP is the number of true positives. True negatives (TN): These are the negative tuples that were correctly labeled by the classifier. TN is the number of true negatives. False positives (FP): These are the negative tuples that were incorrectly labeled as positive. FP is
the number of false positives. False negatives (FN): These are the positive tuples that were mislabeled as negative. FN is the number of false negatives.
Table 2. The confusion matrix for TT data of EDHS 2011.
Actual class of TT
Predicted Class of TT Total
Yes No P
Yes TP FN N
No FP TN P
Total P’ N’ P+N
3.5. Cross-Validation
In K-fold cross-validation, the initial data are randomly partitioned into k mutually exclusive folds, D1, D2 … DK, each of approximately equal size. Training and testing are performed k times. In general, stratified 10-fold cross-validation is used for estimating accuracy, even if computation power allows using more folds due to its relatively low bias and variance.
3.6. Clustering
Most of the clustering algorithms require the users to input the number of clusters they desire [12]. Thus, in this study, we have used five clusters. To discover acceptable classes using Simple K-Means based on the principle of maximizing the similarity between objects in the same class i.e., intra-class similarity and minimizing the similarity between objects of different classes i.e., inter-class similarity [7]. “How does the k-means ( ) algorithm work?” The k-means algorithm defines the centroid of a cluster as the mean value of the points within the cluster. First, it randomly selects k of the objects in D, each of them initially represents a cluster mean or simply center. For each of the rest objects, an object is assigned to the cluster to which it is the most similar, based on the Euclidean distance between the object and the cluster mean. The k-means algorithm then iteratively boost the within-cluster variation. For each cluster, it computes the new center using the objects assigned to the cluster in the previous iteration. All the objects are then re-assigned using the updated center as the new cluster centers. The iterations continue until the task is stable, that is, the clusters formed in the current round are the same as those formed in the previous round.
3.7. Association
The association rules that contain a single predicate are referred to as single-dimensional association rules. This is to identify the frequency of the selected attribute occurring together with access to Tetanus toxoid vaccination, based on a threshold called support, identifies the frequent attribute sets. Another threshold is Confidence, which is the conditional probability than an attribute appears in a transaction using the Apriori algorithm.
3.8. Attribute Selection
4. Results and Discussion
From the selected 7037 mothers, 3351 of mothers received TT Immunizations. The 5680 of mothers were from rural Ethiopia, and more of them (3484) were in the age range from 25-34. (Table 1)
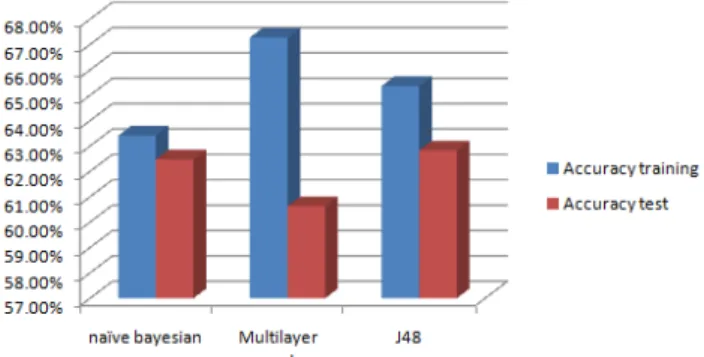
As can be seen in Figure 2, the accuracy rate of the classifiers on training data is relatively high. This shows that the results of the accuracy and performance of learning machines on the tetanus toxoid vaccination data set are hence reliable and can be used as good indicators of the ability of the classifier for detection. A multilayer perceptron is the best classifier in our data set.
Figure 2. The performance of the selected learning algorithm on training and test data.
Using evaluation with cross-validation (10 folds) correctly classified best are by naïve Bayesian 63.30% and the least accurate were by K-nearest neighbor 60.52%. (Table 3)
Simple K-Means preferred the method of clustering for this project we have adjusted the attributes of our cluster algorithm by clicking Simple K-Means. The only attribute of the algorithm we are interested in adjusting here is the “Num clusters field”, which tells us how many clusters into five based on the instruction given. Briefly described as follows:
Cluster 0-This group have 1534 (27%) instances of which consist of mothers who live in the rural, no access to radio, no access to TV, orthodox in religion, Oromo in ethnic, literacy status unable to read mothers, mothers think the distance from a health facility is a big problem, husband's education no education, women age 15-24, mother marital status married, hh_head male, tt-vaccinated yes.
Cluster 1-This group consists of 1004 (18%) instances of which mothers who live in the rural, no access to radio, access to TV yes, orthodox in religion, Oromo in ethnic, literacy status unable to read mothers, mothers think the distance from a health facility is a big problem, husband's education no education, women age 15-24, mother marital status married, head of household male, tt-vaccinated yes.
Cluster 2- This group consists of 2063 (37%) instances of which mothers who live in the rural, no access to radio, no access to TV, Protestant in religion, others in ethnic, mother's literacy status unable to read, mothers think the distance from a health facility is a big problem, husband's education primary, women age 25-34, mother marital status married, hh_head male, tt-vaccinated No.
Cluster 3- This group consists of 633 (11%) instances of which mothers who live in the rural, access to radio yes, no access to TV, Protestant in religion, others in ethnic, mother's literacy status unable to read, mothers think the distance from a health facility is a big problem, husband's education primary, women age 25-34, mother marital status married, hh_head male, tt-vaccinated yes.
Cluster 4- This group consists of 633 (11%) instances of which mothers who live in the rural, access to radio yes, no access to TV, orthodox in religion, Amhara in ethnic, mother's literacy status unable to read, mothers think the distance from a health facility is a big problem, husband's education no education, women age 35-49, mother marital status married, hh_head Female, tt-vaccinated yes.
As explained in the table 3 decision-tree J48 predicts the classification correctly as the actual classification is 1363 and 2317 are classified actually and predicted by the algorithm. The 1320 mothers are classified as vaccinated [yes] and predicted as not vaccinated [No] and the 630 are classified actually not vaccinated but predicted as vaccinated by the J48 algorithm. For naïve and multilayer perceptron see (Table 3 and 4) above. Single data instance test using naïve Bayesian was done by creating test 1, test 2, test 3, and test 4 data test instance, out of this, three of them are correctly predicted and one of them incorrectly classified.
Table 3. The correctly and incorrectly classified, and loading time by classifier algorithms using cross-validation ten folds, EDHS 2011.
The Classifiers Correctly classified
Incorrectly
classified Time Taken
Decision Tree (J48) 62.59% 37.41% 0.87Sec
K-nearest neighbors 60.52% 39.48% 0.00Sec
Naïve Bayesian 63.30% 36.70% 0.01Sec
Multilayer perceptron 60.94% 39.06% 46.12Sec
The maximum confidence attained in the general association is 0.98 with the association of
residence=Rural marital_status=married 4132 ==> television=No 4064 conf:(0.98)”
The maximum confidence attained in the class attributes is 0.72 with the association of
residence=Urban marital_status=married 959 ==> tt_vaccinated=yes 689 conf:(0.72)”
Five best rules found at the confidence of 70.5%:
1.residence=Urban marital_status=married 959 ==> tt_vaccinated=yes 689; conf:(0.72)
2.Residence=Urban 1099 ==> tt_vaccinated=yes 787 conf: (0.72)
3.literacy_status=able to read marital_status=married 1107 ==> tt_vaccinated=yes 787 conf: (0.71)
4.literacy_status=able to read 1244 ==> tt_vaccinated=yes 884 conf: (0.71)
Figure 3. The information gain by the “Rank + InfoGainAttributeEval” algorithm, EDHS 2011.
Table 4. The detailed accuracy of the selected algorithm, EDHS 2011.
Algorithm Types CCI ICI TT vaccinated TP Rate FP Rate Precision
Decision tree (J48)
Training 65.36% 34.64% Yes 0.508 0.214 0.684
Test 62.83% 37.17% No 0.786 0.492 0.637
Bayesian naïve
Training 63.41% 36.59% Yes 0.47 0.216 0.664
Test 62.47% 37.53% No 0.784 0.53 0.619
Multilayer perceptron
Training 67.28% 32.72% Yes 0.41 0.088 0.809
Test 60.63% 39.37% No 0.912 0.59 0.629
The literacy status of the mother has high information gain (0.046) and followed by the literacy status of the mother (0.041) and the least information gained was head of household (0.00000147). (Figure 3)
5. Conclusion and Recommendation
In this study, the data mining tool and algorithm like (J48, k-nearest, and Bayes) is used for selecting the training and test data, for classification, and K-means approach for clustering, single-dimension association rule to identify the best association. The specific approaches of mining tools, learning are characterized, we developed the WEKA method is based on choosing the file and selecting attributes to convert “. csv” file and features were described using WEKA performance. Our work extends to utilize the implementation of the dataset for data mining tool present in all sections to achieve a better rate of accuracy and improve the efficiency when analyzing the large dataset.
As a conclusion, the best algorithm based on the TT vaccination data is multilayer perceptron classifier with an accuracy of 67.28% and the total time taken to build the model is at 0.01 seconds. Multilayer perceptron classifier has the lowest average error at 32.72% compared to others. These results suggest that among the machine learning algorithm tested, multilayer perceptron classifier has the potential to significantly improve the conventional classification methods for use in medical data.
References
[1] Central Statistical Agency (CSA) [Ethiopia] and ICF, Ethiopia Demographic and Health Survey 2016: Key Indicators Report.
2016: Addis Ababa, Ethiopia, and Rockville, Maryland, USA, CSA, and ICF.
[2] WHO, Maternal immunization against tetanus: Standards for Maternal and Neonatal Care. 2006, Department of making pregnancy safer.
[3] Central Statistical Agency (CSA) [Ethiopia] and ICF, Ethiopia Demographic and Health Survey 2011: Key Indicators Report. 2012: Addis Ababa, Ethiopia, and Rockville, Maryland, USA, CSA, and ICF.
[4] Validation of neonatal tetanus elimination in Andhra Pradesh Weekly Epidemiological Record, 2004. 79: p. 292-297.
[5] Fauveau V et al., Maternal tetanus: magnitude, epidemiology, and potential control measures. International Journal of Gynecology and Obstetrics, 1993. 40: p. 3-12.
[6] WHO, Standards for maternal and Neonatal care: Integrated management of pregnancy and chield birth. 2007,Department of making pregnancy safer.
[7] Han, J., M. Kamber, and J. Pei, eds. Data mining concepts and techniques. Third ed. 2013, Morgan Kaufmann Publishers: Waltham, Mass.
[9] Ian H. Witten and Eibe Frank, eds. Data Mining: Practical Machine Learning Tools and Techniques. Second edition. 2005, Morgan Kaufmann publications.
[10] Parvez Ahmad, Saqib Qamar, and Syed Qasim Afser Rizvi,
Techniques of Data Mining In Healthcare: A Review.
International Journal of Computer Applications, 2015. 120 (15).
[11] P. L. Geenen, et al., Constructing naive Bayesian classifiers for veterinary medicine: A case study in the clinical diagnosis of classical swine fever. Research in Veterinary Science, 2010. 91: p. 64-70.