http://www.sciencepublishinggroup.com/j/mlr doi: 10.11648/j.mlr.20200502.11
ISSN: 2637-5672 (Print); ISSN: 2637-5680 (Online)
Feature Selection and Classification of Leukemia Cancer
Using Machine Learning Techniques
Md. Alamgir Sarder, Md. Maniruzzaman, Benojir Ahammed
*Statistics Discipline, Khulna University, Khulna, Bangladesh
Email address:
*
Corresponding author
To cite this article:
Md. Alamgir Sarder, Md. Maniruzzaman, Benojir Ahammed. Feature Selection and Classification of Leukemia Cancer Using Machine Learning Techniques. Machine Learning Research. Vol. 5, No. 2, 2020, pp. 18-27. doi: 10.11648/j.mlr.20200502.11
Received: February 26, 2020; Accepted: June 12, 2020; Published: July 4, 2020
Abstract:
Leukemia cancer is one of the most leading detrimental cancer diseases in worldwide. A huge number of genes are responsible for cancer diseases. Therefore, it is necessary to identify the most informative genes of Leukemia cancer. The main objectives of this study are to: (i) identify the most informative genes using five feature selection techniques (FST) and (ii) adopt six classifiers to classify the cancer disease and compare them. Leukemia cancer data has been taken from Kent ridge biomedical data repository, USA. There are 7129 genes and 72 patients. Among them, 47 patients are cancer and 25 are control. We have used five FST as t-test; Wilcoxon sign rank sum (WCSRS) test, random forest (RF), Boruta and least absolute shrinkage and selection operator (LASSO). We have also used six classifiers as Adaboost (AB), classification and regression tree (CART), artificial neural network (ANN), random forest (RF), linear discriminant analysis (LDA) and naive Bayes (NB). The performances of these classifiers are evaluated by accuracy (ACC), sensitivity (SE), specificity (SP), positive predictive value (PPV), negative predictive value (NPV), and F-measure (FM). We used simulated dataset to check the validity of proposed method. The results indicate that the combination of LASSO based FST and NB classifier gives the highest classification accuracy of 99.95%. On the basis of the results, we can conclude that the combination of LASSO based FST and NB classifier predicts the leukemia cancer more accurately compare to any other combination of FST and classifiers utilized in this study.Keywords:
Leukemia, Cancer, Feature Selection, Machine Learning, Classification1. Introduction
In recent world cancer is a most important health burden. It is caused when the divisions of cells are uncontrolled [1]. According to World health organizations (WHO), there were about 18.10 million new cases and 9.6 million deaths due to cancer in 2018 in worldwide [2]. Leukemia is one of the most leading detrimental cancer diseases which is a group of blood cancer. It begins in bone marrow and spreading via blood cell [3]. In 2015, about 2.3 million people were suffering from leukemia cancer and 3,53,500 deaths due to leukemia cancer [4]. So, the cure of cancer is must for surviving the mankind. Nowadays cancer research is one of the egregious areas in medical combat. For providing better treatment to patient, it is important to precisely predict different types of cancer. Clinical and morphological based prediction was provided to detect the
increased by removing a huge number of irrelevant genes [12].
Previously a lot of studies had been conducted for feature selection techniques (FST) for microarray gene selection data [13, 14]. But a combination of large number of FST has not been well studied and Boruta and LASSO feature selection techniques has not used yet for gene expression data. Machine learning (ML) techniques are enabled to find the best classification accuracy by selecting the most informative genes. ML-based systems such as Adaboost (AB), classification and regression tree (CART) and artificial neural network (ANN). Principle component analysis (PCA) was used as a FST for different gene expression cancer datasets and showed that quartile discriminant analysis classifier provided the highest classification accuracy of 97.40% [15]. Partial least square (PLS) method was also used to extract the most significant genes on blue cell dataset while linear discriminant analysis (LDA) was regarded as classifier. The combination yields 98.50% classification accuracy [16]. There was a problem among previous studies that no one could not give a satisfactory result on cancer classification because 1% of misclassification can be occurred a serious issue. The hypothesis belongs to our research is which combination of FST and classifier provides the highest classification accuracy.
This research stands on two-stage system which is the fundamental assumptions. Firstly, identify the most significant genes using five FST’s namely: t-test, Wilcoxon sign rank sum (WCSRS) test, random forest (RF), Boruta package and least absolute shrinkage and selection operator (LASSO). The two statistical tests along with the p-value are used to identify the cancerous genes. RF, Boruta and LASSO used mean decrease error (MDE); maximum Z score among shadow attributes (MZSA) and tuning parameter for identification of cancer relevant genes, respectively. Secondly, ML foot step picks the most suitable classifier for best result and which includes six classifiers namely: AdaBoost (AB), classification and regression tree (CART), artificial neural network (ANN), random forest (RF), linear discriminant analysis (LDA) and Naive Bayes (NB). Performances of these techniques are evaluated using accuracy (ACC), sensitivity (SE), specificity (SP), positive predictive value (PPV), negative predictive value (NPV) and F-measure. As a part of validation of our best classification, we have used simulated dataset.
2. Materials and Methods
2.1. Data Sources
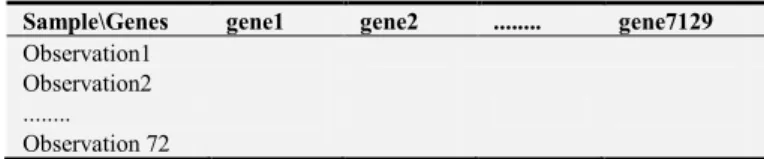
In this study we have used leukemia cancer gene expression dataset which is provided by Kent ridge biomedical data repository, USA and is publicly available [17]. The dataset contains 72 patients and 7129 genes. Among the total patients, 25 patients are control and 47 are cancer. The data matrix of the gene expression data was presented in Table 1.
Table 1. Data matrix for leukemia cancer dataset.
Sample\Genes gene1 gene2 ... gene7129
Observation1 Observation2 ... Observation 72
2.2. Overview of the Proposed Computational Method The first step is to normalize the leukemia cancer data; in the second phase we extract the most informative genes using five FST’s as t-test, WCSRS test, RF, Boruta, and LASSO. The next step is to divide the dataset into two groups as training set (70%) and test set (30%). Then six classifiers as AB, CART, ANN, RF, LDA, and NB are adopted to classify the patients as cancer vs. control. We estimate the training parameters from training set using the different classifiers. Then these parameter (s) are used in test set to predict the leukemia cancer. To get better and reliable results we repeat this process 1000 times for each classifier and then use mean values of the final results. The overview of this study was presented in Figure 1.
Figure 1. Overview of proposed computational method.
2.3. Data Normalization
Data normalization is needed to avoid the biasness of gene expression data [18]. In this study, we have normalized leukemia cancer dataset using the standardized equation as below:
Z X μ
σ
where, X is the variable to be normalized, µ and σ is the mean and standard deviation of that variable and Z is the normalized variable that values lies between 0 and 1.
2.4. Feature Selection Techniques
2.4.1. T-test
The t-test is a very simple and standard statistical approach of variable selection. The t-test has been extensively studies in field of machine learning and bioinformatics to measure the differences in means between two groups (cancer vs. control) [19]. The mathematical form of the t-test is written as follows:
t X − X
+
Where, X and X are the means of cancer and control respectively. Also s and s are the variances and n and
n are the total number of cancer and control class, respectively. The t-statistic follows t-distribution with (n +
n − 2) degrees of freedom. In this study, we have used three cutoffs of point of p-values as 0.01, 0.001, and 0.0001 for selecting the most significant genes.
2.4.2. Wilcoxon Sign Rank Sum Test
Wilcoxon signed rank sum test (WCSRS) is a nonparametric approach that can be used as a feature selection technique [20]. It is noted that it is a powerful technique in gene selection [21, 22]. It is used to compare two matching samples. Let x1i and x2i (i=1, 2,..., 7129) be the two set of measurements. Firstly, we have calculated the absolute difference between two measurements. We should omit the pairs |x1i − x2i| whose absolute difference between two measurements are zero. Then we need to rank (Ri) the absolute differences and calculate the sign|x − x |. The test statistic can be written as:
W = sign|x − x |R
The value of WCSRS test statistic (W) is compared to p-value. We have used three different p-values (<0.01, <0.001, <0.0001) for selecting the significant genes.
2.4.3. Random Forest
Random forest (RF) is one of the most popular techniques for feature selection [23]. Permutation importance or Mean Decrease in Accuracy (MDA) is evaluated for each feature by omitting the association between that features and the target [24]. This is achieved by randomly permuting the values of the feature and measuring the resulting increase in error. The influence of the correlated features is also removed.
2.4.4. Boruta Package
Wrapper approach is used for developing Boruta package and build around RF was introduced Boruta package algorithm to determine relevance factors/features by comparing the relevance of the real features to that of the random probes [23, 25]. Using Boruta algorithm, we cannot use only Z-score to measure the importance. So, for each attribute we create a corresponding ’shadow’ attribute, whose values are obtained by shuffling values of the original
attribute across objects. Then we compute the importance of all attributes and finally select the variables based on the importance.
2.4.5. Least Absolute Shrinkage and Selection Operator Least absolute shrinkage and selection operator (LASSO) was first introduced by Tibshirani [26]. LASSO is a powerful method that performs two main tasks as regularization and feature selection. LASSO setup a linear regression model and penalize the regression coefficients with L1 distance [26]. Most of the coefficients are reduced to zero and the remaining inputs are selected using LASSO. Shrinking and removing the coefficients using LASSO can reduce the variance without a significant increase of the bias [27]. So, LASSO method can provide very good prediction accuracy and this is especially useful when a dataset has a small number of observations and a large number of features.
2.5. Classification Techniques
In this study, six most important and available classifiers are adapted due to their simplicity and popularity as: AdaBoost (AB), classification and regression tree (CART), artificial neural network (ANN), random forest (RF), linear discernment analysis (LDA) and Naive Bayes (NB).
2.5.1. AdaBoost
AdaBoost (AB) is the short for Adaptive Boosting. AB is one of the most widely used algorithms to construct a strong classifier in machine learning and it is developed for binary classification [28]. Short decision tree is used for AB. The performance of the tree on each training instance is used after creating the first tree. Further using it we should follow the next tree. Generally, AB uses the weighted average of the weak classifiers to predict [29].
2.5.2. Classification and Regression Tree
Classification and regression tree (CART) is a non-parametric decision tree learning technique which was proposed by Breiman for constructing binary tree [30]. Binary refers to a node in a decision tree which can only be split into two groups. Numerical or categorical values or missing attribute values are handled by CART. It is widely used both regression and classification in machine learning [31].
2.5.3. Artificial Neural Network
determining the activity of each hidden unit. Finally, output layer measures the behavior of the output that depends on the activity of the hidden units.
2.5.4. Random Forest
Like as feature selection, random forest (RF) model can be used for machine learning techniques. RF is a tree-based regression and classification techniques and it is suitable for both parametric and nonparametric cases [23, 34]. Using the random subspace method, the first algorithm for random decision forests was created by Ho et al. (1995) [35]. For either randomly selected features or a combination of features at each node to grow a tree, RF classifier is used. Gini ratio criteria [36] and Gini index [37] are used as attribute selection measure in decision tree. Gini index is used as an attribute selection in RF-based model to measure the impurity of an attribute with respect to the class.
2.5.5. Linear Discriminant Analysis
Linear discriminant analysis (LDA) is used for eliminating the drawback of logistic regression classifier [38]. By considering the data is Gaussian and each attribute has the same variance. LDA estimates mean and variance for dataset. LDA makes predictions by estimating the probability that a new set of inputs belongs to each class.
2.5.6. Naive Bayes
Naive Bayes (NB) is a simple technique for constructing
classifiers. Since the 1960s, NB has been studied extensively. NB classifiers are highly scalable and in a learning problem. It requires a number of parameters linear in the number of variables [39]. The most common assumption for NB is the value of a particular feature is independent of the value of any other feature, given the class variable [40].
2.6. Statistical Performance Evaluation
Accuracy (ACC), sensitivity (SE), specificity (SE), positive predictive value (PPV), negative predictive value (NPV), F-measure were used to measures the performance of the different classifiers. These measurements are calculated based on true positive (TP), true negative (TN), false positive (FN) and false negative (FN). The detail of these measurements was described by Maniruzzaman et al. [19].
3. Results
3.1. Identify Best Feature Selection and Classification Technique
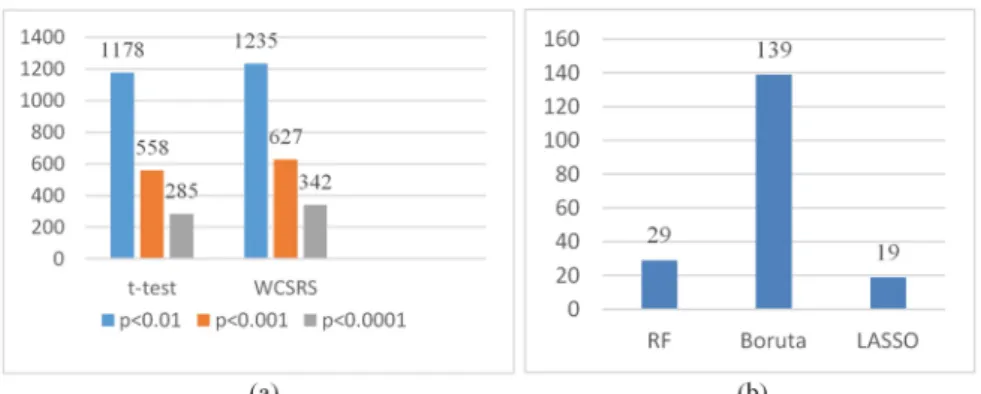
One of our main objectives of this experiment was to find the most significant genes for leukemia cancer. Figure 2 indicates a cluster bar diagram where the vertical axis presents the number of significant genes and the horizontal axis for different FST’s.
Figure 2. (a) Gene selection using t-test and WCSRS test; (b) Gene selection using RF, Boruta and LASSO.
The t-test provide 1178 (p<0.01), 558 (p<0.001), and 285 (p<0.0001) significant genes whereas, WCSRS provides 1235 (p<0.01), 627 (p<0.001), and 342 (p<0.0001) significant genes [Figure 2 (a)]. Other FST such as RF,
Boruta and LASSO provides 29, 139, and 19 significant genes, respectively [Figure 2 (a)]. Further, it is noted that as the p values decreases, the number of significant genes were also decreases for t-test and WCSRS test [Figure 2 (a)].
Table 2. Comparisons of classification accuracy of the combination of five FST’s and six classifiers.
FST p-values #of genes AB CART ANN RF LDA NB∗
t-test
0.01 1178 93.27 87.41 95.45 98.14 98.00 98.46
0.001 558 94.68 87.23 95.09 96.77 97.77 98.82
0.0001 285 96.14 86.73 95.05 97.59 97.18 99.50
WCSRS
0.01 1235 93.59 87.86 95.05 98.05 97.86 98.77
0.001 627 93.82 87.73 96.09 97.84 97.95 98.85
0.0001 342 94.45 86.91 95.32 97.09 97.27 98.91
RF MDA 29 96.68 87.82 96.32 97.82 89.77 98.50
Boruta MZS 139 94.45 86.50 96.09 97.91 97.18 98.82
LASSO Tuning 19 94.23 90.95 90.00 97.45 99.77 99.95
Table 2 shows that the comparison of classification accuracy of six classifiers and five FST’s for leukemia cancer. It is observed that the combination of LASSO based feature selection technique and NB classifiers gives the highest classification accuracy of 99.95%, while LASSO selects only 19 genes. On the other hand, the combination of t-test based feature selection technique AB classifiers gives the lowest accuracy of 93.27%. The other statistical performance evaluation parameters like SP, SE, PPV, NPV and FM are described in appendix (Appendix 1: Table A1) for leukemia cancer dataset.
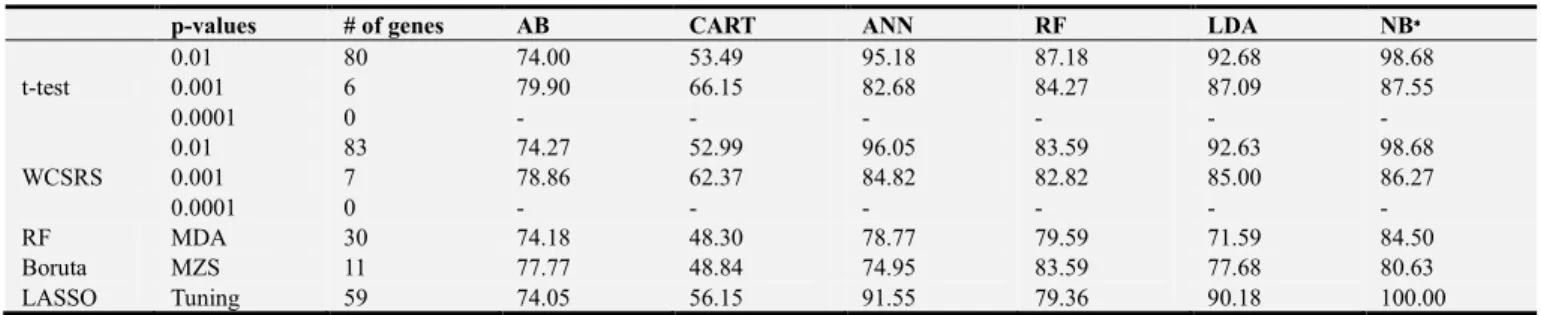
3.2. Validation of Proposed Method
For the validation of the proposed method, we generate 72
observations for 7129 genes from the normal distribution using the mean and variance of corresponding 7129 genes of leukemia dataset. Among them 47 patents are cancer and 25 are controls. The validation of the proposed computational method is discussed in Table 3. The results show that the LASSO selects only fifty-nine genes and NB gives the classification accuracy of 100%. While, CART provides the lowest classification accuracy (48.30%) compared to NB. Therefore, the combination of LASSO FST with NB-based classifier gives the highest classification accuracy. The other statistical performance evaluation parameters like SP, SE, PPV, NPV and FM are described in appendix (Appendix 2: Table A2) for simulated dataset.
Table 3. Validations of the proposed computation method for simulated data.
p-values # of genes AB CART ANN RF LDA NB∗
t-test
0.01 80 74.00 53.49 95.18 87.18 92.68 98.68
0.001 6 79.90 66.15 82.68 84.27 87.09 87.55
0.0001 0 - - - -
WCSRS
0.01 83 74.27 52.99 96.05 83.59 92.63 98.68
0.001 7 78.86 62.37 84.82 82.82 85.00 86.27
0.0001 0 - - - -
RF MDA 30 74.18 48.30 78.77 79.59 71.59 84.50
Boruta MZS 11 77.77 48.84 74.95 83.59 77.68 80.63
LASSO Tuning 59 74.05 56.15 91.55 79.36 90.18 100.00
* Bold and shaded value indicates the highest values.
4. Discussion
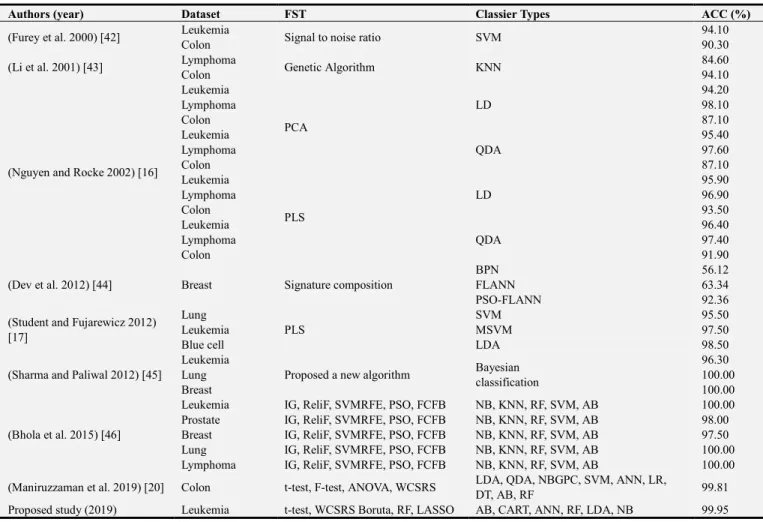
A total of ninety combination system had been designed by the cross combination of five FST (t-test, WCSRS test, RF, Boruta and LASSO) and six classifiers (AB, CART, ANN, RF, LDA and NB). Classification accuracy was evaluated using each combination of FST and classifier. In the first stage, we selected the most informative genes with two statistical tests (t-test and WCSRS test) when p-values are less than 0.01, 0.001 and 0.0001. Then others R software built up FST (RF, Boruta and LASSO) were applied to get the most significant genes. Accuracy for each classifier with FST was evaluated for leukemia cancer. Other performance of all classifiers was compared on the basis of SE, SP, PPV, NPV and FM. From the results, using the performance of different FST’s and classification techniques we can propose a unique decision that LASSO based FST and NB based classifier was perform better than all other techniques. A benchmarking of the proposed system against the previous work was also explored which is presented in Table 4. The layout the proposed system against the previous work represents the key differences between our current study and previously published studies.
Comparison Between Our Current Study Against Previous Study.
A novel method was developed to analyze gene expression data of cancer tissue and signal to noise ratio was used to extract the most important genes whose expression levels were highly differentiated with others tissue types [41]. In
another study support vector machine (SVM) was used to classify the leukemia and colon cancer patients. Finally, the result outputted that SVM gave 94.10% accuracy for leukemia cancer and 90.30% accuracy for colon cancer dataset [42]. They proposed a genetic algorithm to identify the subset of the predictive genes. A novel research procedure for predicting gene samples based on microarray gene expression was developed by Nguyen and Rocke (2002) [15]. They used two FST as PLS and PCA along with two classifiers as logistic discriminant (LD) and QDA for reducing dimension of tumor genes. The results showed that the combination of PLS and LD gave the highest classification accuracy (94.20%).
using selected important genes.
Table 4. Comparison between our current studies against previous published paper.
Authors (year) Dataset FST Classier Types ACC (%)
(Furey et al. 2000) [42] Leukemia Signal to noise ratio SVM 94.10
Colon 90.30
(Li et al. 2001) [43] Lymphoma Genetic Algorithm KNN 84.60
Colon 94.10
(Nguyen and Rocke 2002) [16]
Leukemia
PCA
LD
94.20
Lymphoma 98.10
Colon 87.10
Leukemia
QDA
95.40
Lymphoma 97.60
Colon 87.10
Leukemia
PLS
LD
95.90
Lymphoma 96.90
Colon 93.50
Leukemia
QDA
96.40
Lymphoma 97.40
Colon 91.90
(Dev et al. 2012) [44] Breast Signature composition
BPN 56.12
FLANN 63.34
PSO-FLANN 92.36
(Student and Fujarewicz 2012) [17]
Lung
PLS
SVM 95.50
Leukemia MSVM 97.50
Blue cell LDA 98.50
(Sharma and Paliwal 2012) [45]
Leukemia
Proposed a new algorithm Bayesian
classification
96.30
Lung 100.00
Breast 100.00
(Bhola et al. 2015) [46]
Leukemia IG, ReliF, SVMRFE, PSO, FCFB NB, KNN, RF, SVM, AB 100.00
Prostate IG, ReliF, SVMRFE, PSO, FCFB NB, KNN, RF, SVM, AB 98.00
Breast IG, ReliF, SVMRFE, PSO, FCFB NB, KNN, RF, SVM, AB 97.50
Lung IG, ReliF, SVMRFE, PSO, FCFB NB, KNN, RF, SVM, AB 100.00
Lymphoma IG, ReliF, SVMRFE, PSO, FCFB NB, KNN, RF, SVM, AB 100.00
(Maniruzzaman et al. 2019) [20] Colon t-test, F-test, ANOVA, WCSRS LDA, QDA, NBGPC, SVM, ANN, LR,
DT, AB, RF 99.81
Proposed study (2019) Leukemia t-test, WCSRS Boruta, RF, LASSO AB, CART, ANN, RF, LDA, NB 99.95
* Bold and shaded values indicate the best performance of FST and classifier.
Lung and breast cancer dataset gave 100% accuracy, on the contrary leukemia cancer dataset served only 96.30% accuracy. Several gene selection and classification methods were applied by Bhola and Tiwari (2015), on different types of cancer datasets [45]. The study found that AB classifier gave 98% accuracy for prostate cancer using FCFB gene selection method [45]. A recent study on colon cancer classification using four gene selection methods and ten classifiers was conducted by Maniruzzaman et al. (2019), resulted that WCSRS test based RF classifier provided highest 99.81% classification accuracy [19]. In this study initially 7129 genes of leukemia cancer dataset are used for extracting important genes. Next, using six classifiers, we have evaluated the degree of accuracy for classification. LASSO based FST is the best for accuracy when naive Bayesian classifier applied. So, this research will discover a new insight in the field of microarray gene expression leukemia cancer dataset.
One of our main objectives was to compare the performance for both leukemia and simulation dataset of combination five FST with six classifiers. Simulated dataset is also supported our evaluation for leukemia cancer dataset. Table 2 and Table 3 show the mean accuracy of all FST for
both leukemia and simulated dataset respectively. The classifier NB gives the highest accuracy for both original (99.95%) and simulated data (100.00%) when the feature variables drive from LASSO methods. Among all statistical tests and feature selection methods, the best performance was obtained by LASSO method followed by t-test, WCSRS test, RF and Boruta package. Finally, we may conclude our research with the prediction that the combination of LASSO and NB-based classifier perform better results compared to others which validation is checking with the same prediction for both leukemia and simulated dataset.
5. Strength and Extension of the Study
6. Conclusion
This study showed a plenary evaluation of classification of leukemia cancer gene expression with the two major criteria. Firstly, the high-risk differential genes were identified using different FST’s. Then different classifiers were used to find the best classifier to predict the leukemia cancer. Five FST namely: t-test, WCSRS test, RF, Boruta package and LASSO were used to identify the high-risk differential genes. Further, six classification method such as: AB, CART, ANN, RF, LDA and NB were designed to predict the degree of accuracy. The study provided the highest classification accuracy of 99.95% was obtained by the combination of LASSO FST and NB-based classifier. So, LASSO based FST and NB classifier showed the best performer for leukemia
cancer classification.
Appendix
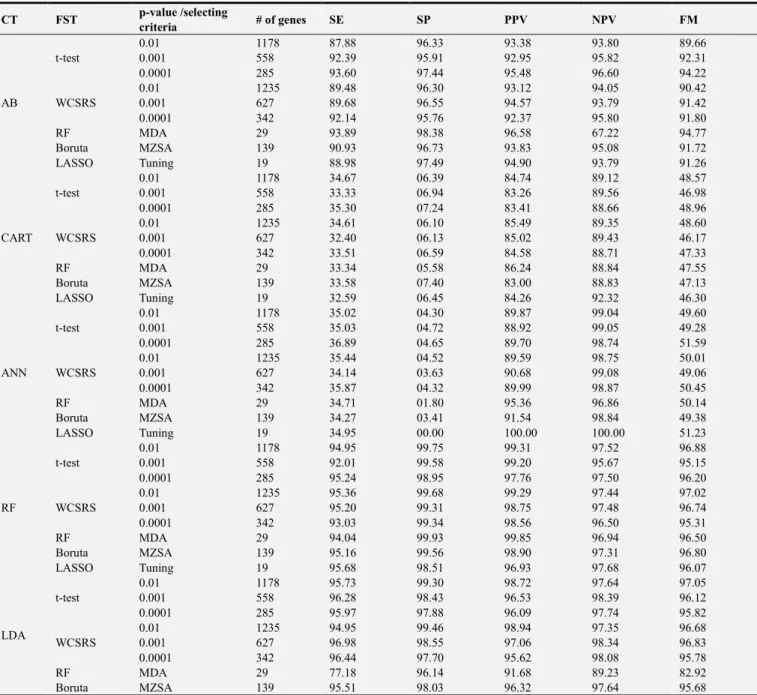
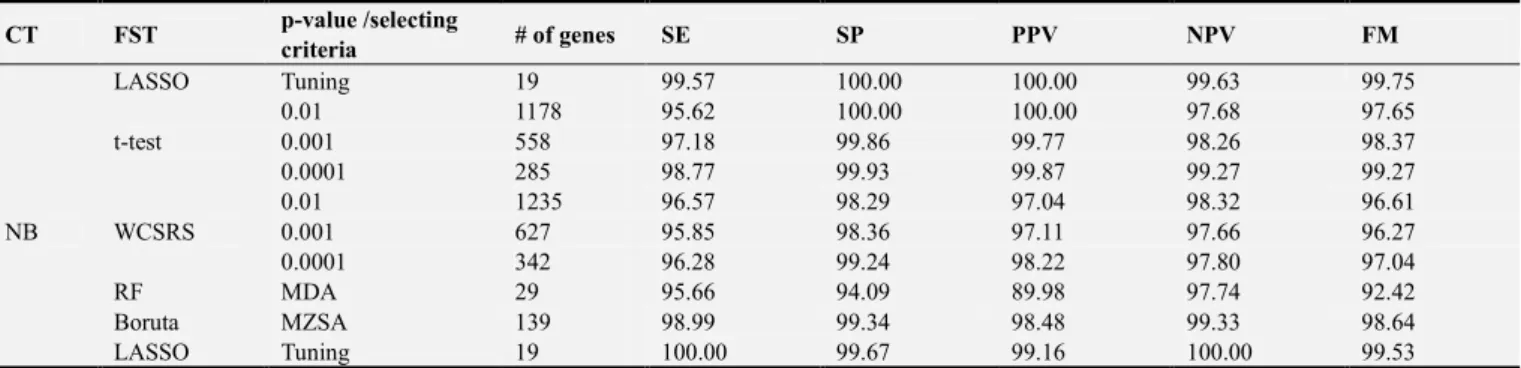
This Appendix 1 and Appendix 2 demonstrates the statistical performance against six classifiers while changing features selection techniques (t-test, WCSRS, RF, Boruta and LASSO) for both leukemia and simulated dataset. Six classifiers were Adaboost (AB), classification and regression tree (CART), artificial neural network (ANN), random forest (RF), linear discriminant analysis (LDA) and Naïve Bayes (NB). The performances of these classifiers are evaluated using sensitivity (SE), specificity (SP), positive predictive value (PPV), negative predictive value (NPV) and F-measure (FM).
Appendix 1: Leukemia Dataset
Table A1. Changes in mean SE, SP, PPV, NPV and FM of all classifiers against feature selection techniques of leukemia dataset.
CT FST p-value /selecting
criteria # of genes SE SP PPV NPV FM
AB
t-test
0.01 1178 87.88 96.33 93.38 93.80 89.66
0.001 558 92.39 95.91 92.95 95.82 92.31
0.0001 285 93.60 97.44 95.48 96.60 94.22
WCSRS
0.01 1235 89.48 96.30 93.12 94.05 90.42
0.001 627 89.68 96.55 94.57 93.79 91.42
0.0001 342 92.14 95.76 92.37 95.80 91.80
RF MDA 29 93.89 98.38 96.58 67.22 94.77
Boruta MZSA 139 90.93 96.73 93.83 95.08 91.72
LASSO Tuning 19 88.98 97.49 94.90 93.79 91.26
CART t-test
0.01 1178 34.67 06.39 84.74 89.12 48.57
0.001 558 33.33 06.94 83.26 89.56 46.98
0.0001 285 35.30 07.24 83.41 88.66 48.96
WCSRS
0.01 1235 34.61 06.10 85.49 89.35 48.60
0.001 627 32.40 06.13 85.02 89.43 46.17
0.0001 342 33.51 06.59 84.58 88.71 47.33
RF MDA 29 33.34 05.58 86.24 88.84 47.55
Boruta MZSA 139 33.58 07.40 83.00 88.83 47.13
LASSO Tuning 19 32.59 06.45 84.26 92.32 46.30
ANN
t-test
0.01 1178 35.02 04.30 89.87 99.04 49.60
0.001 558 35.03 04.72 88.92 99.05 49.28
0.0001 285 36.89 04.65 89.70 98.74 51.59
WCSRS
0.01 1235 35.44 04.52 89.59 98.75 50.01
0.001 627 34.14 03.63 90.68 99.08 49.06
0.0001 342 35.87 04.32 89.99 98.87 50.45
RF MDA 29 34.71 01.80 95.36 96.86 50.14
Boruta MZSA 139 34.27 03.41 91.54 98.84 49.38
LASSO Tuning 19 34.95 00.00 100.00 100.00 51.23
RF
t-test
0.01 1178 94.95 99.75 99.31 97.52 96.88
0.001 558 92.01 99.58 99.20 95.67 95.15
0.0001 285 95.24 98.95 97.76 97.50 96.20
WCSRS
0.01 1235 95.36 99.68 99.29 97.44 97.02
0.001 627 95.20 99.31 98.75 97.48 96.74
0.0001 342 93.03 99.34 98.56 96.50 95.31
RF MDA 29 94.04 99.93 99.85 96.94 96.50
Boruta MZSA 139 95.16 99.56 98.90 97.31 96.80
LASSO Tuning 19 95.68 98.51 96.93 97.68 96.07
LDA
t-test
0.01 1178 95.73 99.30 98.72 97.64 97.05
0.001 558 96.28 98.43 96.53 98.39 96.12
0.0001 285 95.97 97.88 96.09 97.74 95.82
WCSRS
0.01 1235 94.95 99.46 98.94 97.35 96.68
0.001 627 96.98 98.55 97.06 98.34 96.83
0.0001 342 96.44 97.70 95.62 98.08 95.78
RF MDA 29 77.18 96.14 91.68 89.23 82.92
CT FST p-value /selecting
criteria # of genes SE SP PPV NPV FM
LASSO Tuning 19 99.57 100.00 100.00 99.63 99.75
NB
t-test
0.01 1178 95.62 100.00 100.00 97.68 97.65
0.001 558 97.18 99.86 99.77 98.26 98.37
0.0001 285 98.77 99.93 99.87 99.27 99.27
WCSRS
0.01 1235 96.57 98.29 97.04 98.32 96.61
0.001 627 95.85 98.36 97.11 97.66 96.27
0.0001 342 96.28 99.24 98.22 97.80 97.04
RF MDA 29 95.66 94.09 89.98 97.74 92.42
Boruta MZSA 139 98.99 99.34 98.48 99.33 98.64
LASSO Tuning 19 100.00 99.67 99.16 100.00 99.53
Appendix 2: Simulated Dataset
Table A2. Changes in mean SE, SP, PPV, NPV and FM of all classifiers against feature selection techniques of simulated dataset.
CT FST p-value/ selecting
criteria # of genes SE SP PPV NPV FM
AB
t-test
0.01 80 52.60 87.56 70.53 77.32 56.08
0.001 6 67.77 86.42 72.69 83.74 68.50
0.0001 - - - -
WCSRS
0.01 83 54.50 86.02 68.55 78.19 58.12
0.001 7 67.01 86.53 73.43 82.51 67.72
0.0001 - - - -
RF MDA 30 50.48 87.95 69.17 77.03 55.41
Boruta MZSA 11 58.26 89.93 77.47 79.25 63.98
LASSO Tuning 59 54.34 85.58 67.11 77.69 57.85
CART t-test
0.01 80 36.47 44.74 49.44 56.56 44.31
0.001 6 47.47 23.21 69.46 64.14 56.01
0.0001 - - - -
WCSRS
0.01 83 35.51 45.90 51.21 56.48 41.56
0.001 7 44.08 34.85 59.83 63.25 47.79
0.0001 - - - -
RF MDA 30 35.40 67.49 39.31 55.17 37.04
Boruta MZSA 11 39.89 67.92 42.49 51.76 39.72
LASSO Tuning 59 37.59 43.31 55.37 57.45 45.87
ANN
t-test
0.01 80 38.03 05.20 88.57 99.86 52.58
0.001 6 34.94 15.87 71.18 91.92 45.93
0.0001 - - - -
WCSRS
0.01 83 35.13 04.34 89.75 100.00 49.96
0.001 7 36.65 11.89 77.11 90.78 48.87
0.0001 - - - -
RF MDA 30 36.24 17.40 67.96 86.43 46.62
Boruta MZSA 11 29.31 18.49 63.07 82.18 39.12
LASSO Tuning 59 36.19 07.41 84.15 96.96 49.89
RF
t-test
0.01 80 65.44 99.87 99.66 84.09 77.17
0.001 6 72.51 92.30 84.06 85.61 75.42
0.0001 - - - -
WCSRS
0.01 83 58.89 100.00 100.00 80.25 71.04
0.001 7 65.46 93.54 86.16 82.38 72.66
0.0001 - - - -
RF MDA 30 47.75 90.44 84.24 77.06 61.42
Boruta MZSA 11 63.27 87.31 68.05 82.55 62.12
LASSO Tuning 59 50.31 96.01 88.01 78.35 61.12
LDA
t-test
0.01 80 91.88 93.03 88.32 95.71 89.52
0.001 6 84.98 88.00 79.60 91.91 81.24
0.0001 - - - -
WCSRS
0.01 83 89.54 94.58 90.49 94.05 89.28
0.001 7 80.60 87.92 78.55 89.48 78.00
0.0001 - - - -
CT FST p-value/ selecting
criteria # of genes SE SP PPV NPV FM
Boruta MZSA 11 64.73 85.20 71.37 81.49 66.05
LASSO Tuning 59 90.56 90.37 83.34 84.44 85.92
NB
t-test
0.01 80 97.12 99.94 99.87 98.19 98.14
0.001 6 87.70 92.98 86.61 92.28 80.94
0.0001 - - - -
WCSRS
0.01 83 96.52 100.00 100.00 98.01 98.10
0.001 7 81.16 94.82 87.36 91.14 77.06
0.0001 - - - -
RF MDA 30 71.79 92.15 85.91 85.54 75.56
Boruta MZSA 11 71.33 86.23 72.56 85.38 69.99
LASSO Tuning 59 91.39 94.50 88.92 88.05 86.00
Ethics Approval
No ethical approval is required for this dataset.
Funding
No fund received for this project.
Conflict of Interest
The authors confirm that this article content has no conflicts of interest.
References
[1] Dasari, Subramanyam, RajendraWudayagiri, and LokanathaValluru. "Cervical cancer: Biomarkers for diagnosis and treatment." Clinicachimicaacta 445 (2015): 7-11.
[2] Bray F, Ferlay J, Soerjomataram I, Siegel RL, Torre LA, Jemal A (2018) Global cancer statistics 2018: GLOBOCAN estimates of incidence and mortality worldwide for 36 cancers in 185 countries. CA: a cancer journal for clinicians 68 (6): 394-424. [3] Hüsemann, Yves, Jochen B. Geigl, Falk Schubert,
PieroMusiani, Manfred Meyer, ElkeBurghart, Guido Forni et al. "Systemic spread is an early step in breast cancer." Cancer cell 13, no. 1 (2008): 58-68.
[4] Vos T, Allen C, Arora M, Barber RM, Bhutta ZA, Brown A, Carter A, Casey DC, Charlson FJ, Chen AZ, Coggeshall M (2015) Global, regional, and national incidence, prevalence, and years lived with disability for 310 diseases and injuries, 1990–2015: a systematic analysis for the Global Burden of Disease Study 2015. The Lancet 388 (10053): 1545-602. [5] Azuaje F (2000) Interpretation of genome expression patterns:
computational challenges and opportunities. IEEE engineering in medicine and biology magazine: the quarterly magazine of the Engineering in Medicine & Biology Society 19 (6): 119. [6] Golub TR, Slonim DK, Tamayo P, Huard C, Gaasenbeek M,
Mesirov JP, Coller H, Loh ML, Downing JR, Caligiuri MA, Bloomfield CD (1999) Molecular classification of cancer: class discovery and class prediction by gene expression monitoring. Science 286 (5439): 531-7.
[7] Nguyen DV, Rocke DM (2002) Classification of acute leukemia based on DNA microarray gene expressions using
partial least squares. InMethods of Microarray Data Analysis (pp. 109-124). Springer, Boston, MA.
[8] Slonim DK, Tamayo P, Mesirov JP, Golub TR, Lander ES (2000) Class prediction and discovery using gene expression data. InProceedings of the fourth annual international conference on Computational molecular biology (pp. 263-272). [9] Harrington CA, Rosenow C, Retief J (2000) Monitoring gene
expression using DNAmicroarrays. Current opinion in Microbiology 3 (3): 285-91.
[10] Lu Y, Han J (2003) Cancer classification using gene expression data. Information Systems 28 (4): 243-68.
[11] Díaz-Uriarte R, De Andres SA (2006) Gene selection and classification of microarray data using random forest. BMC bioinformatics. 2006 Dec 1; 7 (1): 3.
[12] Ruiz R, Riquelme JC, Aguilar-Ruiz JS (2006) Incremental wrapper-based gene selection from microarray data for cancer classification. Pattern Recognition 39 (12): 2383-92.
[13] Pirooznia M, Yang JY, Yang MQ, Deng Y (2008) A comparative study of different machine learning methods on microarray gene expression data. BMC genomics 9 (S1): S13. [14] Xi M, Sun J, Liu L, Fan F, Wu X (2016) Cancer feature
selection and classification using a binary quantum-behaved particle swarm optimization and support vector machine. Computational and mathematical Methods in Medicine. [15] Nguyen DV, Rocke DM (2002) Tumor classification by
partial least squares using microarray gene expression data. Bioinformatics 18 (1): 39-50.
[16] Student S, Fujarewicz K (2012) Stable feature selection and classification algorithms for multiclass microarray data. Biology direct 7 (1): 33.
[17] Zhu Z, Ong YS, Dash M (2007) Markov blanket-embedded genetic algorithm for gene selection. Pattern Recognition 40 (11): 3236-48.
[18] Alon U, Barkai N, Notterman DA, Gish K, Ybarra S, Mack D, Levine AJ (1999) Broad patterns of gene expression revealed by clustering analysis of tumor and normal colon tissues probed by oligonucleotide arrays. Proceedings of the National Academy of Sciences 96 (12): 6745-50.
[20] Wilcoxon F (1992) Individual comparisons by ranking methods. InBreakthroughs in statistics (pp. 196-202). Springer, New York, NY.
[21] Guan Z, Zhao H (2005) Asemiparametric approach for marker gene selection based on gene expression data. Bioinformatics 21 (4): 529-36.
[22] Li S, Wu X, Hu X (2008) Gene selection using genetic algorithm and support vectors machines. Soft computing 12 (7): 693-8.
[23] Breiman L (2001) Random Forests. Machine Learning, vol. 45. [24] Soemedi R, Cygan KJ, Rhine CL, Wang J, Bulacan C, Yang J,
Bayrak-Toydemir P, McDonald J, Fairbrother WG (2017) Pathogenic variants that alter protein code often disrupt splicing. Nature genetics 49 (6): 848.
[25] Stoppiglia H, Dreyfus G, Dubois R, Oussar Y (2003) Ranking a random feature for variable and feature selection. Journal of machine learning research 3 (Mar): 1399-414.
[26] Tibshirani R (1996) Regression shrinkage and selection via the lasso. Journal of the Royal Statistical Society: Series B (Methodological) 58 (1): 267-88.
[27] Fonti V, Belitser E (2017) Feature selection using lasso. VU Amsterdam Research Paper in Business Analytics 1-25. [28] Bauer E, Kohavi R (1999) An empirical comparison of voting
classification algorithms: Bagging, boosting, and variants. Machine learning 36 (1-2): 105-39.
[29] Solomatine DP, Shrestha DL (2004) AdaBoost. RT: a boosting algorithm for regression problems. In 2004 IEEE International Joint Conference on Neural Networks (IEEE Cat. No. 04CH37541) (Vol. 2, pp. 1163-1168). IEEE.
[30] Breiman L (1999) Random forests. UC Berkeley TR567. [31] Razi MA, Athappilly K (2005) A comparative predictive
analysis of neural networks (NNs), nonlinear regression and classification and regression tree (CART) models. Expert Systems with Applications 29 (1): 65-74.
[32] Markram, H. (2012) ‘The human brain projects’, Scientific American, Vol. 306, No. 6, pp. 50-55.
[33] Markram H (2012) The human brain project. Scientific American 306 (6): 50-5.
[34] Ahammed B, Abedin M (2018) Predicting wine types with different classification techniques. Model Assisted Statistics and Applications 13 (1): 85-93.
[35] Ho TK (1995) Random decision forests. In Proceedings of 3rd international conference on document analysis and recognition (Vol. 1, pp. 278-282). IEEE.
[36] Quinlan JR. Bagging, boosting, and C4. 5. In AAAI/IAAI, Vol. 1 1996 Aug 4 (pp. 725-730).
[37] Strobl C, Boulesteix AL, Augustin T (2007) Unbiased split selection for classification trees based on the Gini index. Computational Statistics & Data Analysis 52 (1): 483-501. [38] Manel S, Dias JM, Ormerod SJ (1999) Comparing
discriminant analysis, neural networks and logistic regression for predicting species distributions: a case study with a Himalayan river bird. Ecological modelling 120 (2-3): 337-47. [39] Schütze H, Manning CD, Raghavan P (2008) Introduction to information retrieval. Cambridge: Cambridge University Press. [40] Rish I (2001) An empirical study of the naive Bayes classifier.
InIJCAI 2001 workshop on empirical methods in artificial intelligence (Vol. 3, No. 22, pp. 41-46).
[41] Furey TS, Cristianini N, Duffy N, Bednarski DW, Schummer M, Haussler D (2000) Support vector machine classification and validation of cancer tissue samples using microarray expression data. Bioinformatics 16 (10): 906-14.
[42] Li L, Weinberg CR, Darden TA, Pedersen LG (2001) Gene selection for sample classification based on gene expression data: study of sensitivity to choice of parameters of the GA/KNN method. Bioinformatics 17 (12): 1131-42.
[43] Dev J, Dash SK, Dash S, Swain M (2012) A classification technique for microarray gene expression data using PSO-FLANN. International Journal on Computer Science and Engineering 4 (9): 1534.
[44] Sharma A, Paliwal KK (2012) A gene selection algorithm using Bayesian classification approach. American Journal of Applied Sciences 9 (1): 127-31.