http://www.sciencepublishinggroup.com/j/mlr doi: 10.11648/j.mlr.20180303.11
ISSN: 2637-5672 (Print); ISSN: 2637-5680 (Online)
Analysis on Leg Bone Fracture Detection and
Classification Using X-ray Images
Wint Wah Myint, Khin Sandar Tun, Hla Myo Tun
Department of Electronic Engineering, Yangon Technological University, Yangon, Myanmar
Email address:
To cite this article:
Wint Wah Myint, Khin Sandar Tun, Hla Myo Tun. Analysis on Leg Bone Fracture Detection and Classification Using X-ray Images.
Machine Learning Research. Vol. 3, No. 3, 2018, pp. 49-59. doi: 10.11648/j.mlr.20180303.11 Received: August 19, 2018; Accepted: September 6, 2018; Published: October 10, 2018
Abstract:
Nowadays, computer aided diagnosis (CAD) system become popular because it improves the interpretation of the medical images compared to the early diagnosis of the various diseases for the doctors and the medical expert specialists. Similarly, bone fracture is a common problem due to pressure, accident and osteoporosis. Moreover, bone is rigid portion and supports the whole body. Therefore, the bone fracture is taken account of the important problem in recent year. Bone fracture detection using computer vision is getting more and more important in CAD system because it can help to reduce workload of the doctor by screening out the easy case. In this paper, lower leg bone (Tibia) fracture types recognition is developed using various image processing techniques. The purpose of this work is to detect fracture or non-fracture and classify type of fracture of the lower leg bone (tibia) in x-ray image. The tibia bone fracture detection system is developed with three main steps. They are preprocessing, feature extraction and classification to classify types of fracture and locate fracture locations. In preprocessing, Unshrap Masking (USM), which is the sharpening technique, is applied to enhance the image and highlight the edges in the image. The sharpened image is then processed by Harris corner detection algorithm to extract corner feature points for feature extraction. And then, two classification approaches are chosen to detect fracture or non-fracture and classify fracture types. For fracture or not classification, simple Decision Tree (DT) is employed and K-Nearest Neighbour (KNN) is used for classifying fracture types. In this work, Normal, Transverse, Oblique and Comminute are defined as the four fracture types. Moreover, fracture locations are pointed out by the produced Harris corner points. Finally, the outputs of the system are evaluated by two performance assessment methods. The first one is performance evaluation for fracture or non-fracture (normal) conditions using four possible outcomes such as TP, TN, FP and FN. The second one is to analysis for accuracy of each fracture type within error conditions using the Kappa assessment method. The programming software used to implement the system is MATLAB with wide range of image processing tools environment. The system produces 82% accuracy for classification fracture types.Keywords:
Leg Bone Fracture Detection, Classification, X-ray Images, MATLAB, Biomedical Engineering, Machine Learning1. Introduction
Today, medical image processing is a field of science that is gaining wide acceptance in healthcare industry due to its technological advances and software breakthroughs. It plays a vital role in disease diagnosis and improved patient care and helps medical practitioners during decision making with regard to the type of treatment. Among the various diseases, bone fracture detection and treatment, which affects many people of all ages, is growing important in modern society. Bone fracture is common problem even in most developed
alarm the doctors. Depending on the experts alone for such a critical matter has caused intolerable errors and hence, the idea of automatic diagnosis procedure has always been an appealing one. San Myint,et al. presented Leg Bone Fracture Detection in x-ray image with preprocessing, segmentation, fracture detection and classification algorithm. It contains information about canny edge detector produces perfect information from the bone image for segmentation. In feature extraction, Hough transform technique is used for line detection [1]. Mallikarjunaswamy M. S. and Raman. R concentrated on developing an image processing based efficient system for a quick and accurate classification of bone fractures based on the information gained from the x-ray/CT images. The authors adopted as image processing techniques like pre-processing, segmentation, edge detection and feature extraction methods. This system could classify into fractured and non-fracture bone and compare the accuracy of different methods using MATLAB 7.8.0 as the programming tool. They described the accuracy of the bone fracture detection system with 85% and performance with some limitations [2]. Visala Deepila Vegi, Sai Lakshmi Patibandla, Sankalp Sai Kavikondala and CMAK Zeelan Basha examined x-ray images to detect the fracture in bones. They discussed computerizing fracture detection in bone from x-ray images. Sections of this paper were loading image into the system, pre-processing, segmentation and finally fracture detection of bones. In order to improve the effectiveness and usage of this system, the author used a Graphical User Interface (GUI) design [3]. M. AL-AYYOUB and D. AL-ZGHOOL had done determining the type of long bone fracture in X-ray images. The authors considered problem of determining fracture types with different classification algorithms to detect existence of fracture along with its type. The authors carried out the system by the following procedure. The first work is to address the problem and distinguishing features are extracted after preprocessing. Different classification algorithms were used to detect the existence of fracture [4]. Mahendran. S. K. and Santhosh Baboo. S studied to improve tibia fracture detection using image processing tools and also used fusion classification techniques in X-ray images. They proposed the system with four steps, namely, preprocessing, segmentation, feature extraction and bone detection. In bone detection phase, three classifiers, such as Feed Forward Back Propagation Neural Network (BPNN), Support Vector Machine Classifier (SVN) and Naïve Bayes (NB) were used during fusion classification. They discussed the result with significant improvement in terms of detection rate and speed of classification [5].
Martin, D. and Greg, K. had developed a method of automatically detecting fractures in long bones. There are two procedures in that analysis. Firstly, bone edge was extracted from X-ray image using a non-linear anisotropic diffusion method. Secondly, modified Hough transform with automatic peak detection and magnitude and direction of the gradient was created using the calculate line parameter. This method consistently detected mid-shaft long bone fractures
[6]. Mahendran S. K. and Santhosh Baboo. S concentrated automatic fracture detection using fusion-based classifiers. Contract, Homogeneity, Energy, Entropy, Mean, Variance, Markov Random Field (MRF) and intensity gradient direction (IGD) were extracted from fracture X-ray images as features. Using these features, train and test the classifiers for detecting fractures in X-ray images. Three classifiers, BPNN, SVM and NB were used. Using these features and classifiers, three single classifiers and four multiple classifiers were developed. The performance metrics used were sensitivity, specificity, positive predictive value, negative predictive value, accuracy and execution time. They also described that usage of fusion classifiers could enhance the detection capacity and the combination SVM and BPNN could produce the best result [7]. Zheng Wei and Sun Huissheng presented fracture classification and feature extraction of X-ray fracture image. They firstly discussed marker-controlled watershed transform based on gradient and homotopy modification to segment X-ray fracture images. Then, marker processing and regionprops function were used to extract region number, region area, region centroid and protuberant polygon of fracture image and Hough transform was be applied to detect and extract lies in the protuberant polygon of X-ray fracture image. Finally compute the angle between fracture line and perpendicular line of centerline [8]. Ismail Hmeidi and Mahmoud Al-Ayyoub implemented the system with the ability to provide a highly accurate diagnosis in hand bone fractures in X-ray images. Some discriminative features were extracted from the images after processing them for noise removal and enhancement. They also described system’s performance with more 86% accuracy [9]. Hum Yan Chai, Lan Khin Wee, Tan Tian Swee, Sh-Hussain Salleh, Ariff. A. K and Kamarulafizam have approached a fracture detection CAD system based on GLCM recognition which improves current manual inspection of x-ray images. Feature of Homogeneity, Contrast, Energy and Correlation were calculated according to GLCM to classify the fractured bone and non-fractured bone. They had tested 30 images of femur fractures and the result had shown accuracy obtained from the system with 86.67%. However they also pointed out that the performance of this system could be further improved using multiple features of GLCM and future works could be done on classifying the bone into different degree of fracture specifically [10].
2. Design of the System
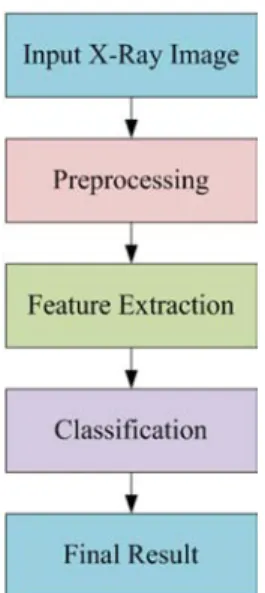
fractures are oblique, compound, comminuted, spiral, greenstick and transvers. Among them, transverse, oblique and comminuted fracture will be classified in this system. In the first step, applying preprocessing techniques such as RGB to grayscale conversion and enhance them by using sharpening technique to sharp the bone region in the images. USM (Unsharp Mask Filter), image sharpening technique, is used to increase either sharpness or (local) contrast because of differences values between original images and blur image. By using the mask, edge enhancement image can be created. After preprocessing, it converts each image into a set of features by suing feature extraction technique as if Harris corner detection algorithm to find edge points or break points as features. Then, the classification algorithm based on extracted features. In this step, decision tree classier and KNN classifier were conducted to classify fracture, non-fracture and types of non-fractures. The general block diagram of the proposed system is illustrated in Figure 1 and the following subsections are discussed these steps in detail.
Figure 1. Block Diagram of the Proposed System.
2.1. Input X-ray Image
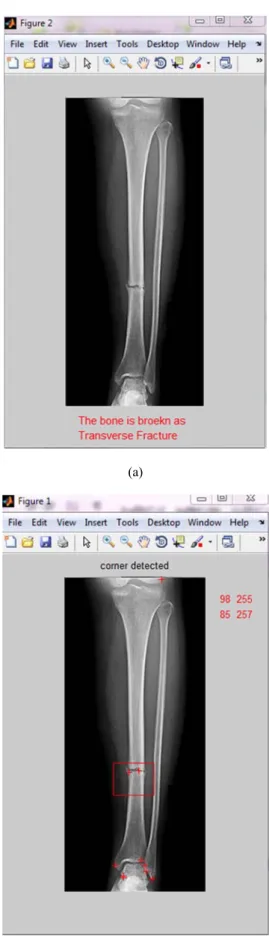
Input X-ray image or image acquisition is the very first step of the proposed system. Therefore, this work depends on X-ray images to diagnose long bone fractures. The initial step is the image acquisition to get the data in the form of digital X-ray images that are required in this research. Image acquisition can be broadly into the action of retrieving an image from some hardware source. JPG format is used for input X-ray images in this research work because this is ease to process in image processing algorithms. Moreover, modern X-ray imaging machine can support the JPG format as well as DICOM format. So, there is no need processing step to convert JPG format from DICOM format. After this step, image preprocessing step is required because there is need to enhance the input X-ray image by removing noise or
sharpening image edges and get soft focus (blurring) effect for next further processes. Figure 2 shows the scanning X-ray image of lower leg bone.
Figure 2. Scanning X-ray Image of Lower Leg Bone.
2.2. Image Preprocessing
Pre-processing is an essential stage since it controls the suitability of the results for the successive stages. Image enhancement technique can be used as preprocess or postprocess portion. Image sharpening refers to any enhancement technique that highlights edges and fine details in an image. The basic concept of Unsharp masking (USM) is to blur the original image first, then subtract the blurred image from the original image itself. As the final stage add the difference result to the original image. Sharpened image can be achieved by the equation (1).
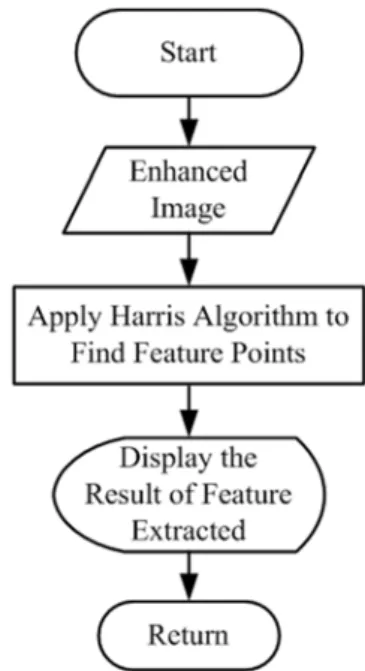
Figure 3. Flowchart for Image Preprocessing Algorithm.
2.3. Feature Extraction
A feature is an image characteristic that can capture certain visual property of image. Since, sharpened image can increase the contrast between bright and dark region, feature extraction step can directly conduct to bring out features. Corner detection is a technique to extract certain kind of features. Different corner detectors belong to Kanade-Lucas-Tomasi (KLT) operator and Harris operator which is simple, efficient and reliable have been proposed by researchers for capturing the corners from the image. Harris algorithm is used for extracting feature and to find the edge points as features. This algorithm can be detected corner more equality distributing and most informative. Harris corner detection algorithm can analyze liner edge, flat and corner belong to X-derivative and Y-X-derivative. It finds energy (gradient values) to get two eigenvalues by the mathematical calculation is
E=
∑
w(x,y) [I(x+u,y+v)-I(x,y)]2 (2) E is the gradient difference between the original and the moved window. The Harris detector uses the correlation matrix as the basis of its corner decisions, this matrix can be represented as follow:M=
∑
) , (
)
,
(
y x
y
x
w
2 2
y y x
y x x
I
I
I
I
I
I
(3)
where, M is 2x2 matrix from image derivative. The eigenvalues
(
λ
1,
λ
2)
from the matrix M can help determinethe suitability of a window. Harris defines the response function (R) which decides the point is corner or not with R= det M – k(trace M)2 and R is calculated for each window. R depends only on eigenvalues (λ λ ) of matrix (M). In feature extraction step, the enhanced image is applied by Harris corner algorithm to extract broken points as corner feature
points. The Harris is set to produce maximum ten corner points. And then, two threshold values are used to remove knee and ankle portion which is the undesired part. Therefore, the specific diaphysis shape of leg bone which is the region of interest for fracture detection can be achieved after feature extraction step. Feature Extraction is main step in various images processing to perform the classification work. Harris corner detection algorithm is a kind of effective feature point algorithm. When bones were broken, bone pieces will appear in the form of corner points between the bright and dark region in the X-ray image. Therefore, Harris corner detection algorithm is accompanied in this research work because the working algorithm is directly effective to fulfill the requirement. The flowchart of the feature process is shown in Figure 4.
Figure 4. Flowchart of the Feature Extraction Algorithm.
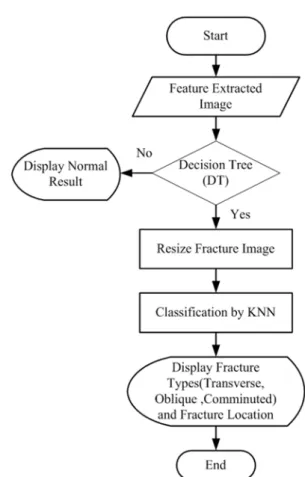
2.4. Classification
processing time for large neural network. SVM classification can avoid under-fitting and over-fitting, however, it will give poor performance when the number of features is very much greater than the number of samples. Among them, Decision Tree (DT) and KNN classifier are applied in this work. DT is a very efficient model and it can produce accurate and easy to understand model in short time. A decision tree or a classification tree is a tree in which each internal (non-leaf) node is labeled with an input feature. They are used in many different disciplines including diagnosis, cognitive science, artificial intelligence, game theory, engineering and data mining. In this work, the system needs to make simple decision whether fracture bone condition or normal bone condition. Therefore, the DT is applied for these two conditions. The feature or break points (nb) are produced by the Harris algorithm designed to capture the ten broken point after feature extraction. Using these corner points, DT classifier makes the decision that is if there is one or more corner point, it is a fracture bone condition whereas there is no corner point, this condition is normal bone. K-Nearest Neighbor can have excellent performance for arbitrary class conditional but it can be slow for real-time prediction. KNN is a large number of training examples and it is not robust to noisy data. However, X-ray input image is firstly enhanced in preprocessing step for most image processing algorithm. Therefore, noisy data in X-ray image can easily handle when KNN classifier is used. The training phase of the algorithm consists only of storing the feature vectors and class labels of the training samples. In the classification phase, k is the number of nearest neighbors used in the classification. If k = 1(default), the case is simply assigned to the class of its nearest to the query point. A commonly used distance metric for continuous variables is Euclidean distance.
In this research, KNN classification is used to classify the types of fracture with training and testing process. In each phase, there are four main steps: image acquisition, image preprocessing feature extraction and classification. In both training and training phase, after the input X-ray image is processed with four steps, bone broken region is cut out from the resulted X-ray image. Then, cutting image is applied by range filter and global image threshold using Otsu’s method. Moreover, this image is converted to black and white image and small object is removed by ‘bwareaopen’ instruction from BW image to produce new enhanced BW image. Finally, the enhanced BW image is resized to be 100x100 sizes by ‘imresize’ function in order to normalize all cutting bone broken region. The normalized image are saved as the train dataset image in the form of .mat file. The three types of fracture is saved as a group of classification by .mat format. Transverse, Oblique, Comminuted are three classes of fracture required for this experiment. In KNN classification, pattern features of testing X-ray image is compared with the pattern training feature of the three fracture classes according to the Euclidean distance. If the nearest distance is distance between query pattern feature and transverse pattern feature, KNN will classify the test X-ray image as transverse fracture types. The flowchart for the fracture classification and
fracture location is shown in Figure 5.
Figure 5. Flowchart for Fracture Classification and Fracture Location.
3. Experiment and Simulation Result
The system produces the output results with two portions to aid the radiologists and orthopedic doctors. The first portion is whether fracture or non-fracture. The second one is classification of three type of fracture and localization of fracture. Fracture type is very important to treatment of the bone injuries. MATLAB environment supports the contribute techniques in research with the large number (and diversity) of the image processing tools to achieve the output results.
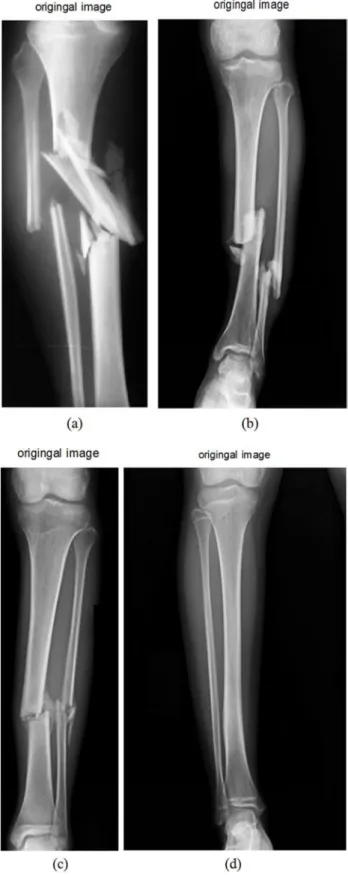
3.1. Acquisition of Input X-ray Image
Figure 6. Original Input X-ray Images.
3.2. Preprocessing
In this portion, the input X-ray image is firstly convert gray scale image because input image is RGB image which causes more computation time. ‘rgb2gray’ instruction in MATLAB accomplishes the converting from RGB image to gray scale image. Consequently, the gray image is then
processed by image sharpening using unsharp masking (USM) tool to emphasize or enhance the high-frequency information in the image because of bone boundary region in X-ray image composes with high frequency intensity. To complete this action, ‘imsharpen’ is employed for this step. The results of the image sharpening are shown in Figure 7.
Result images can be seen with sharped bone boundary region. Unsharp masking especially supports sharpening at the edge. As blurring effect already contains in Unsharp masking algorithm, noise in input images can remove in sharpening process. USM is effective not only filtering but also edge detection so it is chosen for the preprocessing.
3.3. Feature Extraction
Bone region in the x-ray image appear bright and air region look dark. So, when bones were broken, bone pieces will appear in the form of corner points between the bright and dark region in the X-ray image. Broken bone piece come intersection of two edges, abruptly alternation in image brightness. A corner can also be defined as the junction of two edges. So, Harris corner detection algorithm is chosen to
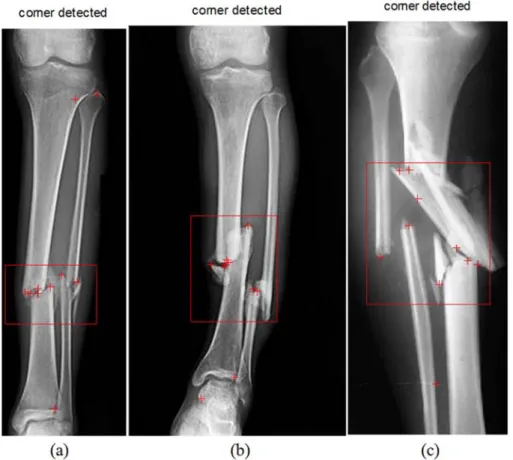
catch the break points of the leg bone in X-ray images. Harris is adjusted to produce ten maximum corner points due to the proposed system wants to get significant broken bone points. The result of corner detection can be seen in Figure 8.
According to the Figure 8 (a), since bone was broken, Harris has detected seven corner points. In Figure 8 (b), it can be seen eight corner points by Harris due to the broken composition of the bone. In next Figure 8(c), Harris produces nine feature points from pieces of bone broken. However, if there is no break point in bone image, Harris will not produce the corner points. In next step, classification, using the feature extracted image, normal bone, and fracture bone including fracture types such as Transverse, Oblique, Comminuted and fracture locations.
Figure 8. Result of Harris Corner Detection (a) Bone with Seven Corner Points, (b) Bone with eight corner points, and (c) Bone with Nine Corner Points.
3.4. Classification
In classification part of leg bone fracture detection system, two classification models are conducted for two main purposes. To decide bone fracture or non-fracture, sample Decision Tree (DT) is used and to classify type of fracture, KNN is implemented. In DT, the number of feature points from feature extraction are attribute of root rand fracture bone and normal bone are class labeled of the tree. In KNN classifier, it compares the train feature and test feature with respect to Euclidean distance and then classifies the test feature to the respective specified classes. Therefore, training
Figure 9. Training Normalized Feature Patterns.
Figure 10. Testing Normalized Feature Patterns.
In this experiments, forty leg bone X-ray images such as ten Normal images, ten Transverse fracture, ten Oblique fracture and ten Comminuted fracture image respectively is used as training images. And then twelve leg bone X-ray images such as three Normal images, three Transverse fracture, three Oblique fracture and three Transverse fracture images.
Finally, after this procedure, the type of fracture result can be obtained by KNN. The fracture of location is achieved by Harris corner points. Since the corner points are the fracture or break points of leg bone, these points are the required fracture location. The output results for type of fracture and location of fracture are shown in Figure 11, Figure 12, Figure 13 and Figure 14.
Figure 11. Result for Normal Bone.
(a)
(b)
(a)
(b)
Figure 13. Result of Fracture Bone (a) Oblique Fracture Type (b) Fracture Location.
(a)
(b)
4. Performance Evaluation of the System
Tibia bone fracture detection system has been developed with two steps of performance evaluations.
4.1. Performance Evaluation in Fracture and Non-fracture
First performance evaluation is analysis for fracture or normal (non-fracture) conditions which is also called binary conditions. The analysis is with respect to the observer. There are four possible outcomes of applying in binary conditions. These outcomes are
(1) True Positive (TP) which refers to the fractured images that are correctly labeled as fractured.
(2) True Negative (TN) which refers to the normal (non-fractured) images that are correctly labeled as normal (non-fractured).
(3) False Positive (FP) which refers to the normal (non-fractured) images that are incorrectly labeled as fractured.
(4) False Negative (FN) which refers to the fractured images that are incorrectly labeled as normal (non-fractured).
Table.1 gives the confusion matrix for four possible outcomes for the performance evaluation of fracture and non-fracture for bone images. The outcomes are mentioned in above.
Table.1. Confusion Matrix for Four Possible Outcomes.
Classifier Data Truth Data
Normal Fracture
Normal TN FN
Fracture FP TP
The performance of the system in fracture and non-fracture conditions is evaluated in terms of accuracy, precision, sensitivity and specificity.
Accuracy =
FP
FN
TN
TP
TN
TP
+
+
+
+
(4) Precision =FP
TP
TP
+
(5)Sensitivity =
FN
TP
TP
+
(6)Specificity =
FP
TN
TN
+
(7)Table.2. Numerical Data of Four Possible Outcomes by Testing.
Classifier Data Truth Data
Normal Fracture
Normal 19 4
Fracture 0 27
Using the numerical data and equations, accuracy is 92%, precision is 100%, Sensitivity is 87% and Specificity is 100% based on the number of tested input images. In this performance evaluation step, fracture or non-fracture is only considered but each type of fracture accuracy and error condition is not introduced. Table.2 gives the numerical data of four possible outcomes by testing.
4.2. Performance Evaluation in Type of Fracture
The second method for performance evaluation is Kappa accuracy assessment (k) for each type of fracture accuracy. Kappa considers the error condition during the classification. The equation of the Kappa accuracy assessment is
ement
chanceagre
ement
chanceagre
curacy
observedac
k
−
−
=
1
(8)∑
∑
∑
= + + = + + =×
−
×
−
=
r i i i i i i r i iix
x
N
x
x
x
N
k
1 2 1 1 (9)To calculate the accuracy assessment of the system, confusion or contingency matrix is required from the experiment results. Numerical tested data are presented in this matrix. Table.3 gives the confusion or contingency matrix of kappa coefficient.
Table.3. Confusion or Contingency Matrix of Kappa Coefficient. Confusion Matrix or Contingency Table
Classifier Data
Truth Data
Normal Transve
rse Oblique
Comminu ted
Row Total
Normal 19 4 23
Transverse 12 1 1 14
Oblique 11 11
Comminuted 4 4
Column Total 19 12 16 5 52
k =
∑
∑
∑
= + + = + + =×
−
×
−
r i i i i i i r i iix
x
N
x
x
x
N
1 2 1 1 = )] ( ) ( ) ( ) [( )] ( ) ( ) ( ) [( ) ( 4 5 11 16 14 12 23 19 52 4 5 11 16 14 12 23 19 4 11 12 19 522 − × + × + × + ×
× + × + × + × − + + + ×
In the matrix, all Normal images and all Transverse images are correctly labeled. Oblique images are correctly classified with 11 Oblique images, however, 4 Oblique images and one Oblique image are incorrectly labeled as Normal and Transverse condition respectively. Similarly, Comminuted type is correctly with 4 Comminuted images and one is wrongly classified as Transverse type. According to the result, accuracy assessment is 83 % by using the Kappa accuracy assessment which considers the error states during classification.
5. Conclusion
In this work, automatic leg bone fracture recognition and localization algorithm is implemented based on the computer vision techniques to develop the automatic bone fracture diagnosis system in the CAD system. From both orthopaedic and radiologist point of view, the fully automatic detection and classification of fracture in lower leg bones is an important but difficult problem. For this purpose, several image processing techniques were used. Unsharp masking (USM) is useful for image enhancement and image sharpening of boundary condition in the images. Harris corner detection is effective tool to catch the broken points of the leg bone. DT is used as a simple classification for fracture and non-fracture. Fracture location can be pointed out by Harris corner points. KNN is suitable for pattern recognition and supports to classify Transverse, Oblique, and Comminuted fracture types. The system can be work with various image sizes which is under 400x400 pixel size. Fracture types such as Transverse, Oblique, Comminuted and Normal are classified by the system to overcome the previous research works. In this work, not only the performance accuracy with respect to fracture and non-fracture is calculated but also the accuracy assessment is evaluated for type of fracture using Kappa coefficient. Kappa accuracy assessment is used because this method considers the error results when calculating the performance and classifying the types of fracture. However, the types of fracture are detected by this research work; crack or ragged condition would not be detected as fracture. The brightness and contrast of the input images must be consistency to produce reliable output result. The system with many training dataset would give more confidence to achieve the accuracy level. The region of interest of the system is epiphysis (Tibia Bone Shaft) region which is between ankle and knee of the Tibia bone. Moreover, the location of the fracture cannot display in term of centimetre and inch because there is no typical specification of these parameters for bone size and high in the X-ray images. There is need to produce real time action output in the medical works by directly connecting the X-ray machine to process the this source code. However, the system
produces the output results with accurate and reliable performance and less processing time based on the contributed methods.
Acknowledgements
The author would like to thank many colleagues from the Biomedical Engineering Research Group under the Department of Electronic Engineering of Yangon Technological University.
References
[1] S. Myint, A. S. Khaing and H. M. Tun, “Detecting Leg Bone Fracture in X-ray Images”, International Journal of Scientific & Research, vol. 5, Jun. 2016, pp. 140-144.
[2] V. D. Vegi and S. L. Patibandla, S. SKavikondala and CMAK Z. Basha, “Computerized Fracture Detection System using x-ray Images”, International Journal of Control Theory and Applications, vol. 9, Nov. 2016, pp. 615-621.
[3] S. K. Mahendran and S. Santhosh Baboo, “An Enhanced Tibia Fracture Detection Tool Using Image Processing and Classification Fusion Techniques in X-Ray Images”, Global Journal Of Computer Science and Technology, vol. 11, Aug. 2011, pp. 27-28.
[4] S. K. Mahendran and S. Santhosh Baboo, “Ensemble Systems for Automatic Fracture Detection”, International Journal of Engineering and Technology (JACSIT), vol. 4, Feb. 2012, pp.7-10.
[5] M. AL-AYYOUB and D. AL-ZGHOOL, “Determining the Type of Long Bone Fracture in X-ray Images”,WSEAS TRANSACATIONS on INFORMATION SCIENCE and APPLICATIONS, vol. 10, Aug. 2013, pp.261-270.
[6] A. T. C, Mallikarjunaswamy M. S. and Rajesh Raman , “Detection of Bone Fracture using Image Processing Methods”, International Journal of Computer Application, National Conference on Power & Industrial Automation (NCPSIA, Aug. 2015, pp. 6-9.
[7] S Jayaraman, S Esakkirajan and T Veerakumar, Digital Image Processing, 2009, pp. 243-274.
[8] CHRIS SOLOMON, TOBY BRECKON, FUNDAMENTALS OF DIGITAL IMAGE PROCESSING,2011 pp. 90-108. [9] N. Umadevi, Dr. S. N. Geethalakshmi, “Multiple
Classification System for Fracture Detection in Human Bone X-ray Images”, in Proc. Third International Conference on Computing Communication & Networking Technologies (ICCCNT), India , 2012, pp. 1-8.