Volume XIII (2015), Page 51 - 64
THE RELATIONSHIP OF HUMAN HAPPINESS AND
NEIGHBOURHOOD PLANNING: CASE STUDY PUCHONG INDAH HOUSING ESTATE, SELANGOR, MALAYSIA
1Oliver Ling Hoon Leh, 2Farah Ayuni Marhalim, 3Siti Nur Afiqah Mohamed
Musthafa, 4Yusfida Ayu Abdullah & 5Marlyana Azyyati Marzukhi
Faculty of Architecture, Planning and Surveying UNIVERSITI TEKNOLOGI MARA (UITM)
Abstract
People living in urban area are always linked to stressful life and less happiness. One of the symptoms is the increasing number of people experiencing depression. Besides, there is also the feeling of fear (unsafe) within the community. To overcome the problems, neighbourhood planning should take into consideration the elements of happiness. A study was carried out at Puchong Indah Housing Estate, with the objectives to examine the level of happiness of residents and to analyse the relationship between happiness and neighbourhood planning aspects. Questionnaire survey was conducted to identify the level of happiness and satisfaction among the residents. The Spearman correlation was applied for the relationship analysis. The main findings demonstrate that the people in Puchong Indah are happy. The residential area planning aspects, i.e. community relationship, accessibility to public areas, transportation and safety aspects were significantly related to happiness of respondents. Recommendations were constructed based on the findings.
Keyword: Happiness; neighbourhood; planning aspects; quality; satisfaction.
1Lecturer at Environmental and Social Health Research Group, Faculty of Architecture, Planning and Surveying, Universiti
INTRODUCTION
Happiness is a state of mind which is not straightforward in definition and is subjective. Thus, happiness brings many meanings. It is often related to an emotion state of well-being characterised by feelings ranging from contentment to intense joy. Barrow (1980) believes that happiness derives from a Latin word felix which sometimes translated as ‘happy’. It implies fortune and the Greek word eudaimon which has a connotation of being favoured by the God. Happiness also appears to be originated from the archaic ‘hap; meaning ‘chance’, ‘luck’ or ‘good fortune’. As Argyle (1987) states, happiness relates to contentment, satisfaction, peace of mind, feeling fulfilled, enjoyment, pleasure and having fun. While Veenhoven (2001) identified the meaning of happiness as the meaning of the quality of life, in which social philosophy signifies a good living condition (happiness as the good society) and in moral philosophy as the sense of good performance (happiness as virtue). Meanwhile, in the context of social science, the word happiness is commonly used to denote subjective enjoyment of life. Subjective quality of life appraisals are referred to as ‘aspect-satisfaction’ and ‘domain satisfaction’. Layard (2011) added that happiness is enjoying good life and wanting the feeling to be maintained. Furthermore, Fred (2008) agrees that happiness is not a static goal that individuals are able to attain by aspiring to it. Rather, happiness is a by-product of a “good life” (or civil happiness, as expounded by Aristotle) producing satisfaction over the long run. Happiness is therefore both an individual right, but seemingly important for societies’ development (Greve, 2010).
Beyond doubt, everyone anticipates for happiness in life, especially people living in the city. Inhabitants around the cities and urban areas are always linked to problems which lead to unhappiness such as heavier work pressure, financial burden, the rise in goods prices and the cost of living, as well as low satisfaction of living conditions. Happiness is important to make our life worth for living. Apparently, there are many issues identified in relation to the study confirming the state of unhappiness of the Malaysian society, such as depressions, higher crime rates, child abuses, babies abandoned by teenage mothers and suicides. The former Malaysian Health Minister, Datuk Seri Liow Tiong Lai claimed that the ratio of suicides from 2007 to 2010 was 1.3 for every 100,000 people. However, Sipalan (2012) disagreed and commented that the statistics could be higher. Suicide is considered as rather a more valid measurement of happiness because it refers to revealed behaviour. The facts show that many people are not really happy and this situation might affect their mental health and the ability to face challenges in life.
crime is seemingly one of the main concerns of Malaysians. Crimes in residential areas has become a fact of life. The growing number of street crimes, crimes against humans and crime against properties have generated considerable fear within the community, making safety a greater issue. This results in the demand for critical attention at both local and national levels (Mohamad & Hanan, 2010).
According to Smith (2011), residential satisfaction is a degree to which the community meets a person’s needs and aspirations. The degree to which these are met is dependent on a person’s evaluation of the physical, social and personal elements of their community. Litman (2014) believes that well-designed and maintained city neighbourhoods have a significant impact on the happiness of city residents. Cities are important environment and these places can therefore facilitate human social connections and relationships because people are often connected to quality places that encompass of cultural value and distinctive. Hence, urban planners should design great places to live in, fostering health and happiness (Rosly & Rashid, 2012). The current Planning Guidelines published by the planning authorities in Malaysia have prescribed best practices in planning and design in creating a superior but affordable living environment that will ultimately promote happiness.
Happiness can be treated as a goal, also as an objective as it might come to be a target in specific urban or regional development project (Trkulja, 2007). As Layard (2011) suggested, in trying to achieve happiness, government should improves job security, reduce unemployment, provides more supports for parenting, creates better planning for the built environment, reduces mobility geographically (including immigration controls) and increases spending on mental health services. The Malaysian Government has decided that it is imperative to focus on the happiness of people as a yardstick to measure the country’s development (Bernama, 2013). It will seek views on the role of Government as well as private and corporate organisations in creating a happy environment. This makes it even more central to investigate the relationship between happiness and urban planning, especially for neighbourhood areas.
LITERATURE REVIEW
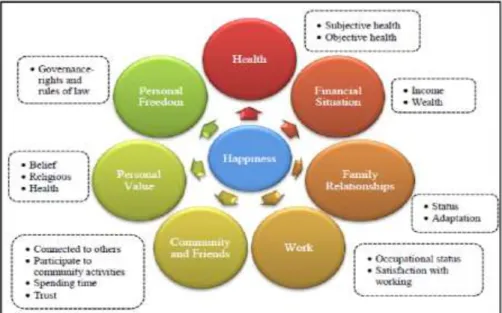
In general, the most important elements of satisfaction in human lives are family, home life, money, living standards, social relationships, social values, housing, work and health. The level of happiness can be measured by the increased level of health and mental health with the presence of certain social relationships and reduce the stressful life events. It leads to happiness which indirectly makes people become healthier and live longer (Argyle, 1987; Greve 2010). On the other hand, Leyden, Goldberg and Michelbach (2011) see personal income and wealth as factors predicting individual happiness. Figure 1 shows the variables of family relationships, work, community and friends, health, personal freedom, and personal values that are related to people’s happiness, and is called the “Big Seven”.
Figure 1: Factors affecting happiness (Source: Adapted from Layard, 2011)
Table 1: Summaries of happiness related measurement criteria in other countries
United Kingdom Thailand Bhutan
Gross Domestic Index (GDP)
Green Happiness Index (GHI) Gross National Happiness Index (GNH)
Health Health
● Healthy Physical ● Moral and ethnic mentality ● Intelligence
Economic Wellness ● Economic metric ● Example: consumer debt,
average income to consumer price index ratio income distribution
Level of Satisfaction Warm and Loving Family ● Family role ● Good relationship
Environmental Wellness ● Environmental metric ● Example: Pollution, noise,
traffic Local Authority Services
Inequality Income and Environment
Community Empowerment ● Self-reliance community ● Supportive community ● Community participation
Physical Wellness ● Physical Metric
● Example: obesity or severe illness
● Economic Strength and Equity ● Employment
● Economic strength ● Economic equity
Mental Wellness ● Mental Health metrics ● Example: usage of
anti-depression and rise or decline of physiotherapy patients Surrounding and Ecological System
● Basic needs
● Safety in life and property ● Good environment ● Well balance of ecological
system
Social Wellness ● Social metrics
● Example: discrimination, safety and divorce rates, complaints of domestic conflict and family lawsuits, crime rates
Democracy Society and Good Governance
Democratic awareness Good governance Harmonious society
Workplace Wellness Labour metrics
Examples: jobless claims, job change, workplace complaints and lawsuits
Source: Adapted from Rosly and Rahid (2012) and Barameechai (2007)
OBJECTIVES OF STUDY
The study had been carried out with the following objectives:
i. To examine the level of happiness among the residents in study area; and ii. To analyse the relationship between the happiness of residents and the
neighbourhood planning aspects.
RESEARCH METHOD
Scope of Research
This research was focused on the happiness of the residents and its relationship with the neighbourhood planning aspects, which covers the following scope:
Psychological aspects of happiness level of residents including the feeling of happiness and satisfaction of life.
Satisfaction of residents on the neighbourhood planning aspects that affect the people’s emotion, which are social interaction in the area, accessibility to public area, transportation (accessibility of the area) and safety aspects.
Case Study
The study on human happiness and relation to the neighbourhood planning aspects was carried out at a neighbourhood area in Puchong Indah Housing Estate (Figure 2), located in Puchong Town, District of Petaling, in the State of Selangor.
The total size of the study area is 108.19 acres and the estimated population living in the boundary of study area is 4,025 people based on the calculation of household size in urban areas. The study area mostly covered by terrace houses and apartments. There are 632 units of terrace houses and 400 units of apartments consisting of eight (8) blocks.
Questionnaire Survey and Sampling of Respondents
The sample size of this research was 97 samples among estimated population of 4,025 people based on the calculation of the total number of houses with a 10 percent of a precision error. A questionnaire survey was designed comprising 36 questions and took an approximate 5 to10 minutes for each person to complete the survey. The questionnaire which had been distributed to the residents was divided into two (2) sections which consisted of Section A (Profile of Respondent) that include questions about the characteristics of respondents through gender, age, employment, status, religious, income and type of property.
Meanwhile, Section B was on “Measuring the Happiness” which targets to obtain detail information about the respondents’ level of happiness, relationship with the community, their satisfaction level on accessibility to public area, accessibility (on transportation) and safety within their neighbourhood environment. Measuring the happiness referred to the average level of happiness within a particular month. According to Layard (2011), people normally accept the ups and downs, and care mainly because their average happiness is over a longer period of time. But the average is made up from a whole series of moments. The questions on happiness and satisfaction/happiness on neighbourhood aspects were designed in Likert Scale by rating their perception to indicate a degree of happiness or unhappiness by rating from 1 (not happy), 2 (less happy), 3 (moderate), 4 (happy) and 5 (very happy). Every single sub-topic in the questionnaire has an open ended question which requires the respondents to provide the reason why they have rated such answer to “1” or “2” (which are the lowest marks in describing happiness and satisfaction/happiness on the neighbourhood aspects).
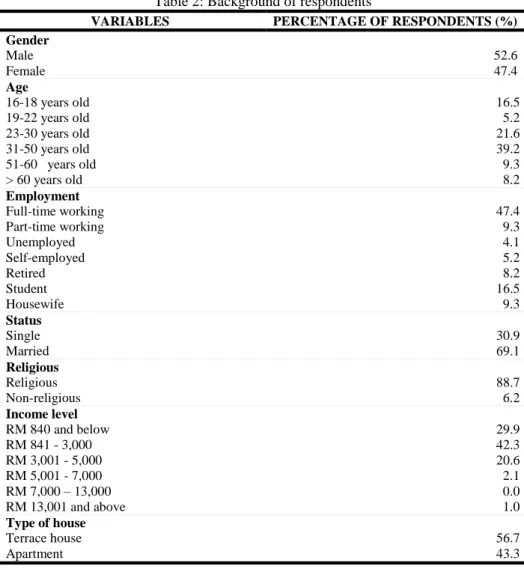
The background characteristic of the respondents is summarised in Table 2. There were 53 percent of male respondents while 47 percent were females. Majority of the respondents were between 50 years and below, and mostly were married (69 percent). In terms of employment, majority of the respondents are in full-time employment. There were 30 percent of the respondents with an income below RM 840, which is categorized under poverty level. However, majority of the respondents (63 percent) were earning between RM 841 to RM 5,000. Additionally, 56.7 percent of respondents live in terrace houses, while the rest live in apartments.
Method of Analysis
Table 2: Background of respondents
VARIABLES PERCENTAGE OF RESPONDENTS (%)
Gender
Male Female
52.6 47.4
Age
16-18 years old 19-22 years old 23-30 years old 31-50 years old 51-60 years old > 60 years old
16.5 5.2 21.6 39.2 9.3 8.2
Employment
Full-time working Part-time working Unemployed Self-employed Retired Student Housewife
47.4 9.3 4.1 5.2 8.2 16.5 9.3
Status
Single Married
30.9 69.1
Religious
Religious Non-religious
88.7 6.2
Income level
RM 840 and below RM 841 - 3,000 RM 3,001 - 5,000 RM 5,001 - 7,000 RM 7,000 – 13,000 RM 13,001 and above
29.9 42.3 20.6 2.1 0.0 1.0
Type of house
Terrace house Apartment
56.7 43.3
RESULTS AND FINDINGS
Happiness Level
Since happiness is a subjective matter, it is suitable to be measured through psychological perspective of the respondents. There were two variables (questions) that were directly measuring the happiness which are:
Variable 1: Consider themselves as happy people Variable 2: Satisfied (happy) with life
majority of the respondents (70% from the total respondents), were happy or very happy. There were around 23 percent which felt that they were moderately happy. There were only 3 percent of the respondents that felt less happy. Variable 2 (V2) evaluates people’s satisfaction on their life. This study shows that majority (around 60%) of them were satisfied (happy) or very satisfied (very happy) with their life. None of the respondents were not happy about their lives (Table 3). By averaging V1 and V2, results show that none of the respondents was less (or not) happy (Table 3). Instead, 47.4 percent of the respondents were happy, 21.8 percent were moderately happy and 16.4 percent were very happy.
Table 3: Happiness level of respondents
LEVEL OF HAPPINESS
V1: HAPPY PERSON V2: SATISFIED
WITH LIFE
AVERAGE OF HAPPINESS
No. of
respondent %
No. of
respondent %
No. of
respondent %
Not happy 0 0.0 0 0.0 0 0.0
Less happy 3 3.1 0 0.0 0 0.0
Moderate 22 22.7 29 29.9 21 21.8
Happy 51 52.6 46 47.4 46 47.4
Very happy 17 17.5 12 12.4 16 16.4
Refuse to answer
4 4.1 10 10.3 14 14.4
Total 97 100.0 97 100.0 83 100.0
From the cross tabulation analysis, it showed that most of the “happy person” (V1) were “satisfied with life” (V2). Meanwhile, most of the “very happy persons” were “very satisfied with life”. For those who were “less happy” are moderate in term of the satisfaction of life (Table 4). The relationship between V 1 “happy person” and V 2 “satisfaction with life” was positively, strongly and significantly correlated at 0.01 level (p= 0.000; r= 0.781). It explains that if they are more satisfied with their life, they are happier. Happiness is achieved when respondents are satisfied with their life and consider themselves a happy person.
Table 4: Cross tabulation analysis between V1 and V2
V1:Happy Person V2: Satisfied with Life (%)
Moderate Happy Very Happy
Not Happy 0.0 0.0 0.0
Less Happy 3.6 0.0 0.0
Moderate 21.7 4.8 0.0
Happy 4.8 45.8 4.8
Very Happy 0.0 4.8 9.6
Happiness in Relation to Neighbourhood Planning Aspects
For the purpose of analysing the relationship between the happiness and the neighbourhood planning aspects, four (4) main aspects of neighbourhood planning had been studied, which were:
Level of community relationship in the neighbourhood area, which covers two (2) sub-aspects: social interaction in community, and communicating with neighbours.
Level of accessibility to public areas i.e. green spaces, educational facilities, religious facilities, social centre, and health facilities.
Level of accessibility (transportation) of the area, which covers five (5) sub-aspects: satisfaction on overall transportation system, private transportation, public transportation, cycling, and walking.
Safety aspect, which covers the safety level in the house, safe living in the neighbourhood area, and common crimes in the area.
The neighbourhood planning aspects had been measured based on the satisfaction or perception of respondents on the level of the neighbourhood aspects (Tables 5 to 18). Most of the respondents were moderately satisfied or satisfied with most of the aspects. However, the results of the level of satisfaction of respondents for every neighbourhood planning aspects are not being discussed in this paper. This chapter focuses on the output of relationship analysis (correlation) between the neighbourhood aspects and the average happiness of residents.
Table 5: Satisfaction or perception on neighbourhood aspects (Part A)
SATISFACTION OR PERCEPTION (PERCENTAGE OF
RESPONDENTS) S o ci al in te ra ct io n i n co mm u n it y C o mm u n ic a -ti n g w it h n ei g h b o u rs A cc ess t o P u b li c G re en S p ac es A cc ess to Ed u ca ti o n al F ac il it ie s A cc ess t o R el ig io u s F ac il it y A cc ess t o S o ci al C en tr e A cc ess t o H ea lt h F ac il it ie s
Very weak 0.0 0.0 0.0 0.0 0.0 4.1 0.0
Weak 7.2 4.1 4.1 0.0 4.1 8.2 4.1
Moderate 46.4 42.3 51.5 47.4 22.7 50.5 24.7
Somewhat strong 38.1 49.5 39.2 48.5 64.9 28.9 66.0
Very strong 8.2 4.1 5.2 4.1 8.2 8.2 5.2
Total 100.0 100.0 100.0 100.0 100.0 100.0 100.0
Table 6: Satisfaction or perception on neighbourhood aspects (Part B)
SATISFACTION OR PERCEPTION (PERCENTAGE OF
RESPONDENTS) Ov era ll Tran sp o rtati o n S y ste m P riv ate Tran sp o rtati o n P u b lic Tran sp o rtati o n Ac ce ss ib il it y b y C y cli n g Ac ce ss ib il it y by Wal k in g S afe in t h eir o wn h o u se S afe in n eig h b o u rh o o d
Very weak 0.0 0.0 0.0 8.2 4.1 4.1 4.1
Weak 8.2 8.2 8.2 5.2 10.3 4.1 0.0
Moderate 37.1 28.9 28.9 34.0 14.4 35.1 38.1
Somewhat strong 41.2 45.4 55.7 49.5 56.7 40.2 45.4
Very strong 9.3 9.3 1.0 0.0 8.2 16.5 12.4
n/a 4.1 8.2 6.2 3.1 93.8 - -
Total 100.0 100.0 100.0 100.0 100.0 100.0 100.0
Mean value 3.54 3.61 3.53 3.29 3.58 3.61 3.62
Table 7: Perception on neighbourhood aspect - common crimes
% OF RESPONDENTS
Never 9.3
Rarely 12.4
Moderate 39.2
Sometimes 39.2
Always 0.0
Total 100.0
Mean value 3.08
Relationship between residents’ happiness and community relationship in the neighbourhood area
From the correlation tests, results show that sub-aspect of “social interactions in community” was positively, strongly and significantly correlated at 0.01 level (r= 0.520; p= 0.000) with an average happiness level of residents (average of V1 and V2). Besides, the sub-aspects of “communicating with neighbours” was also positively and significantly correlated (at 0.01 level) with an average happiness of residents (r=0.505; p= 0.000). This shows that stronger community relationship (social interaction and/or communicating with neighbours) is going to increase the happiness of residents.
Relationship between happiness of residents and accessibility to public areas
Correlation tests show a weak, positive and significant correlation (at 0.01 level) between average happiness of residents and satisfaction of residents on accessibility to green spaces e.g. parks (r=0.383; p=0.000); as well as the accessibility to health facility (r=0.317; p=0.003). This shows that an increase of accessibility to public areas (i.e. green spaces and health facility) will increase the happiness of residents of the neighbourhood (study area).
However, the relationship between happiness and satisfaction on accessibility to other public areas i.e. educational facilities (r= 0.166; p=0.134), religious facility (r=0.120; p=0.279), and social centre (r=0.194; p= 0.80) was very weak and insignificant even at the 0.05 level. This shows that accessibility to educational, religious and social facilities is not significantly affecting the level of happiness of residents. It might be due to the scenario that majority of the respondents are not students, and focus less on the facilities of religious and social centres in their neighbourhood area.
Relationship between happiness of residents and accessibility (transportation) of the area
Results of relationship analysis show significant correlation (but weak) between the average happiness of residents and satisfaction of residents on accessibility of the study area for the sub-aspects of public transportation (r=0.225; p=0.049), cycling (r=3.56; p=0.001) and walking (r=0.342; p=0.02). However, the results of correlation between average happiness of residents and their satisfaction on the other sub-aspects of accessibility show very weak and not significant even at the 0.05 level, i.e. overall transportation system (r= 0.048; p= 0.677), and private transportation (r=0.118; p=0.301). This shows that accessibility in terms of public transportation, cycling and walking do affect the happiness level of residents. Meanwhile, the accessibility of private transportation does not affect the happiness of residents.
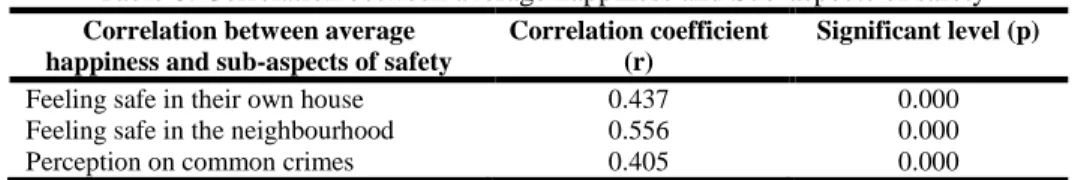
Relationship between happiness of residents and safety of the area
Table 8: Correlation between average happiness and Sub-aspects of safety
Correlation between average happiness and sub-aspects of safety
Correlation coefficient (r)
Significant level (p)
Feeling safe in their own house 0.437 0.000
Feeling safe in the neighbourhood 0.556 0.000
Perception on common crimes 0.405 0.000
SUMMARY AND CONCLUDING REMARKS
In general most of the respondents were happy and satisfied with their lives. In term of the relationship between happiness and neighbourhood planning aspects, analysis showed some neighbourhood aspects were weak and not significantly correlated while some of the aspects were strong and significantly correlated with happiness of residents.
The factors that are statistically less related to happiness are satisfaction on the accessibility to education, religious and social centre/facilities, and satisfaction on accessibility of overall transport system and private transportation. While for the strong and significant relationship between neighbourhood planning aspects and average happiness of respondents are community relationship, safety, accessibility to green spaces and health facilities, and accessibility of the area (in the aspects of public transportation, cycling and walking).
To conclude, the neighbourhood planning aspects are contributing to the happiness of residents. Thus, town planners and designers should properly plan a neighbourhood for the purpose to improve the happiness of the residents. However, not all of the aspects are significantly correlated to the happiness level. The result might be different if the study was to be carried out in a different study area due to the different perception of people. Thus, further studies should be carried out in different areas in the future to provide a more comprehensive understanding on the happiness of residents in different areas in relation to the neighbourhood planning aspects.
Acknowledgement
References
Argyle, M. (1987). The Psychology of Happiness. London & New York: Methuen & Co. Ltd.
Barameechai, J. (2007). International Conference on Happiness and Public Policy, United Nations Conference (UNCC), Bangkok, Thailand.
Barrow, R. (1980). Happiness. Oxford: Martin Roberson & Company Ltd.
Bernama (2013). Budget 2014 to focus on happiness of the people, The Star, Retrieved from http://www.thestar.com.my/News/Nation/2013/06/23/
Frey, B.S. (2008). Happiness: a revolution in economics. MIT Press.
Greve, B. (2010). Happiness and Social Policy in Europe. Edward Elgar Publishing Limited.
Helliwell, J., Layard, R. & Sachs, J. (2014). World Happiness Report 2013. New York: UN Sustainable Development Solution Network.
Layard, R. (2011). Happiness: Lessons from a New Science (Second Edition). Retrieved on 28 October 2014 from http://books.google.com.my/
Leyden, K., Goldberg, A. & Michelbach, P. (2011). Understanding the Pursuit of Happiness in Ten Major Cities. Journal Urban Affairs Review, 47 (861). Litman, T. (2014). Evaluating Active Transport Benefits and Costs: Victoria Transport
Policy Institute. Retrieved on 18 January 2015 from http://www.vtpi.org/nmt-tdm.pdf
Mohammad, A.M. & Hanan, M.H.E. (2010). Crime and Housing In Malaysia: Case Study Of Taman Melati Terrace Housing In Kuala Lumpur, Asian Journal of Environment-Behaviour Studies, 1 (3).
Sipalan, J. (2012). Suicide rate on the rise in Malaysia. Retrieved on 2 May 2014 from http://www.thestar.com.my/News/Nation/2012/06/05/Suicide-rate-on-the-rise-in-Malaysia/
Smith, K. (2011). The Relationship between Residential Satisfaction, Sense of Community, Sense of Belonging and Sense of Place in a Western Australian Urban Planned Community, BA (Psych), Edith Cowan University.
Rosly, D. (2014). Incorporating Social Urbanism in Planning For Urban Wellbeing and Happiness. International Conference on Urban Wellbeing and Happiness 2014, Kuala Lumpur, Malaysia.
Rosly, D. & Rashid, A.A. (2012). Incorporating Happiness and Well-Being into Sustainable Development Indicators Framework, Malaysian Townplan, 9 (1). Rosly, D. & Rashid, A.A. (2013). Happiness Index Towards Sustainable and Livable
Cities in Malaysia, San Francisco California, United States of America. Subang Jaya Municipal Council (2013). Land use maps.
Trkulja, S. (2007). Happiness as Indicator and Planning Objective for the Spatial
Development Policy. Retrieved from
http://gnh-movement.org/papers/trkulja.pdf.
Veenhoven, R. (2001). Quality-Of-Life and Happiness: Not Quite The Same. In G. DeGirolamo et al. (eds.) ‘Salute e qualitá dell vida’, Centro Scientifaco Editore