The Influence of Season on the Cow Milk Quantity,
Quality and Hygiene
Ludovic-Toma Cziszter
1*, Stelian Acatinc
ă
i
1, Florin Cristian Neciu
2, Radu Ionel Neam
ţ
2,
Daniela Elena Ilie
2, Liviu Ioan Costin
2, Dinu Gavojdian
1, Iulian Tripon
11Faculty of Animal Sciences and Biotechnologies Timişoara, 300645 - Timişoara, Calea Aradului 119, Romania
2Research and Development Station for Bovine Raising Arad, 310059 - Arad, Bodrogului 32, Romania
Abstract
The purpose of this study was to evaluate the effects of season of collection on the quantity, quality and hygienic properties of the raw milk delivered from one dairy farm. The studied traits were: bulk tank milk yield, chemical composition (fat, protein, lactose, and total solids), freezing point, density, total bacteria count, coliform bacteria count and somatic cell count, during years 2010 and 2011. A total of 727 samples were drawn and analysed in two laboratories, using the standard methods. Average milk production per day per head in the farm was 13.58 kg, obtained from 252 cows. Year of collection had a significant effect on the bulk tank raw milk yield, quality and hygiene, except for freezing point and total bacteria count. The raw milk yield and chemical composition improved (p<0.05) from year 2010 to year 2011, as well as the hygienic quality. Season of collection had a significant (p<0.05) influence on the milk yield and chemical composition, the highest milk yield with the lowest concentration being obtained during summer, while the lowest milk yield with the highest chemical composition was obtained in winter. Physical properties of the raw milk were less affected by the season of collection, with the lowest freezing point in the winter and the highest density in the autumn. The highest somatic cell count and coliform bacteria count was obtained during the spring and the lowest total bacteria count was obtained in winter season. There was a significant (p<0.05) interaction between year and season of production for all raw milk traits.
Keywords: bacteria count, chemical composition, coliform count, density, freezing point, milk yield, raw cow milk, somatic cell count
1. Introduction
Understanding the variability in milk yield, milk composition, physical and hygienic parameters of milk is important when making management decisions and in milk-recording programs. [1,2]. The composition and functional properties of cow’s milk are of considerable importance to the dairy farmer, manufacturer, and consumer. Broadly, there are 3 options for altering the composition and/or functional properties of milk: cow nutrition and management, cow genetics, and dairy manufacturing technologies [3]. The
* Corresponding author: Cziszter Ludovic Toma, Tel
+40256277105, Fax +40256277110,
concentration and composition of protein in milk are largely unresponsive to variation in nutrition and management.
Somatic cell count is usually used to detect udder infection, especially the sub-clinical mastitis [1]. The total bacteria count shows how the milk was harvested, manipulated and stored before reaching the milk processing plant.
coliforms are themselves not normally causes of serious illness, they are easy to culture and their presence is used to indicate that other pathogenic organisms of faecal origin may be present, including bacteria, viruses, or protozoa and many multicellular parasites [4].
The freezing point of milk depends upon the concentration of water-soluble components. As milk is more diluted, the freezing point will raise closer to zero. The current official freezing point limit (-0.525 degrees Horvet or -0.505 degrees C) was designed for whole-herd, bulk-tank samples or processed milk samples, and not for samples from individual cows or individual quarters. The value of -0.525 degrees Horvet is considered the upper limit which statistically is suppose to be a cut-off for most, but not absolutely all, samples to be considered "water-free". However, freezing point of milk as a regulatory standard is really only valid for milk pooled form many cows (bulk tank milk). Many factors may affect freezing point of milk from individual cows. High producing cows might be expected to have higher freezing points than lower producing cows. Diet, and how and when the diet is fed relative to collecting the milk sample, also may affect freezing point from individual cows. Little work has been done in recent years to define freezing point on milk from modern high producing dairy cattle [5].
Freezing point belongs to the key properties of milk. Many factors affect it. From among the main milk constituents, lactose and chlorides mostly influence freezing point. If combined, they account for 75–80% of the final freezing point. The remaining 20–25% of the freezing point value is affected by other milk constituents – calcium, magnesium, lactates, phosphates, citrates, urea etc. [6] The freezing point of milk is determined by the proportion of milk constituents in a true solution and whose content in milk is affected by a number of factors: e.g. breed, stage and number of lactation, occurrence of subclinical mastitis, nutritional deficiencies, water intake, weather conditions, thermal stress, seasonal influences, presence of CO2 in milk. It was shown that minor details of analysis have to be considered, otherwise freezing point data cannot be compared [7].
The aim of the present study was to study the influence of season on the raw cow milk yield, chemical composition and hygiene.
2. Materials and methods
Researches were carried out on the dairy farm of the Research and Development Station for Bovine Arad, where the main breed was Romanian Spotted of Fleckvieh type.
The milk yield collected in the bulk tank and the number of cows milked was recorded daily, during two consecutive years 2010 and 2011. Also, a milk sample was drawn every day from the milk bulk tank and analysed for chemical composition, density, freezing point, and microbiological load. Chemical composition (fat, protein, lactose, totals solids) as well as the freezing point were carried out by using the FOSS Milkoscan Minor™. Density of milk was determined using the thermo-lacto-densimeter. Somatic cell count in milk was determined using either the FOSS Fossomatic Mino™ or the classical smear reading following the SR EN ISO 13366-1/2010 standard. Total bacteria count was performed using the classical method, following the SR EN ISO 4833/2003 standard. Coliform bacteria count in milk was determined following the SR ISO 554111191 and SR ISO 5541/2/94 standards. The average milk production per cow and per day was obtained by dividing the total milk in bulk tank to the number of cows milked in that day.
An analysis of variance model was used in order to test the influence of year (2010 and 2011) and season of production (winter, spring, summer, and autumn) on these raw milk traits.
3. Results and discussion
Generally, there was found a significant influence of the year of study on the milk yield, quality and hygiene.
from the farm was 2600 kg milk in year 2010 and 2450 kg in year 2011, while the maximum milk yield produced was 4340 kg and 4540, respectively.
Raw milk chemical composition was significantly different (p<0.001) according to the collection year (Table 1). Thus in year 2010 the milk from bulk tank had, on average, 4.089% fat, 3.355% proteins, 4.662% lactose and 12.875% total solids. The milk collected in year 2011 had more fat (4.176%), more proteins (3.367%), less lactose (4.565%) and more total solids (12.976%).
The freezing point was not significantly different between the two years of study, though in year 2010 it was slightly lower than in year 2011 (-0.523 vs. -0.525C, respectively). Average value of the milk density was significantly higher in year 2011 than in year 2010, 1.03 and 1.0299, respectively (p<0.001). Results found in our study were lower than those published in year 2010 [8] for Romanian Spotted breed, which was the main breed in our farm, of -0.547C, ranging from -0.539C to -0.548C.
The average somatic cell count was below the maximum level of 400000 per ml, in both years.
In year 2010 somatic cell count was higher than in year 2011 (137695.1 and 226350.1, respectively), the difference of 11345 cells/ml reaching the statistical significance level (p<0.001).
The average total bacteria count was less than 50000 cfu/ml in both years, and the difference between the two study years was not significant (210.9 cfu/ml, p>0.05). The minimum level of total bacteria count was 25000 cfu/ml in year 2010 and 25000 cfu/ml in year 2011. The maximum level determined in the bulk tank milk did not exceeded the maximum level admitted (100000 cfu/ml), being 93000 cfu/ml in year 2010 and 94000 cfu/ml in year 2011.
Coliform bacteria count was slightly higher in year 2010 than in year 2011, and the difference of 0.12 cfu/ml reached the significance level (p<0.001). Coliform bacteria count ranged from 0.3 to 1.7 cfu/ml in year 2010 and from 0.1 to 6 cfu/ml in year 2011.
As a conclusion, we can observe that from year 2010 to year 2011 the milk production and quality increased, as well as the hygienic properties of the milk from the bulk tank, providing high-quality raw milk.
Table 1. Means and dispersion indices for raw milk traits according to year of collection
Trait 2010 2011 Difference and significance
n 364 363 -
No. of cows milked 252 252 -
Total milk collected daily (kg) 3346.3±18.75 3482.4±27.38 136.1***
Milk production per cow per day (kg) 13.29±0.0749 13.86±0.1119 0.57***
Fat percentage (%) 4.089±0.0123 4.176±0.0149 0.087***
Protein percentage (%) 3.355±0.0038 3.367±0.0032 0.012***
Lactose percentage (%) 4.662±0.0047 4.565±0.0044 -0.097***
Total solids (%) 12.875±0.0127 12.976±0.0152 0.101***
Freezing point (C) -0.523±0.00129 -0.525±0.00006 0.002ns
Density (g/cm3) 1.0299±0.000013 1.0300±0.00001 0.0001***
Somatic cell count (cells/ml) 237695.1±1887.59 226350.1±1860.59 -11345***
Total bacteria count (cfu/ml) 49458.8±766.59 49247.9±819.96 -210.9ns
Coliform bacteria count (cfu/ml) 0.857±0.2595 0.737±0.5045 -0.120***
The season of production had a significant effect (p<0.005) on the milk yield, milk chemical composition and hygiene, and less effect on the physical properties of the milk.
The influence of season on the raw milk yield is presented in Table 2. The highest daily milk production was obtained during the summer, 3727.9 kg, followed by autumn, 3657.3 kg and by spring, 3254.4 kg, while the lowest average daily milk production was obtained in winter, 3016.6
kg. In the summer the daily milk production sold from the farm was ranging from 2980 kg to 4445 kg. The lowest variability of bulk tank milk yield was observed during the winter (from 2450 kg to 3655) and the highest during the autumn (from 2720 to 4540 kg).
winter (11.90 kg). This seasonal distribution of the milk yield is due to the milk secretion stimulation by the green fodder, which is fed to cows during the warm season of the year, from April until October. The lowest milk yield per cow per day
was produced during the winter time (9.61 kg), while the highest production was obtained during the autumn (18.2 kg). The highest variability for this trait was observed in autumn season.
Table 2. Means and dispersion indices for raw milk yield according to the season of collection
Season n No. of cows milked Total milk collected daily (kg) Milk production per cow per day (kg)
Winter 180 254 3016.6±17.17 11.90±0.086
Spring 184 251 3254.4±26.73 12.96±0.102
Summer 181 251 3727.9±28.31 14.83±0.109
Autumn 182 250 3657.3±28.59 14.61±0.112
Differences and Significance
Winter-Spring -237.8*** -1.06***
Winter-Summer -711.3*** -2.93***
Winter-Autumn -640.7*** -2.71***
Spring-Summer -473.5*** -1.87***
Spring-Autumn -402.9*** -1.65***
Summer-Autumn 70.6* 0.22ns
Table 3. Means and dispersion indices for raw milk chemical components according to the season of collection
Season n No. of cows
milked
Fat
(%) Protein (%) Lactose (%) Total solids (%)
Winter 180 254 4.44±0.0068 3.41±0.0033 4.58±0.0082 13.21±0.0116
Spring 184 251 4.15±0.0157 3.34±0.0038 4.62±0.0068 12.93±0.0173
Summer 181 251 3.89±0.0058 3.30±0.0035 4.64±0.0063 12.67±0.0069
Autumn 182 250 4.05±0.0179 3.39±0.0042 4.61±0.0073 12.89±0.0176
Differences and Significance
Winter-Spring 0.29*** 0.07*** -0.04*** 0.28***
Winter-Summer 0.55*** 0.11*** -0.06*** 0.54***
Winter-Autumn 0.39*** 0.02*** -0.03*** 0.32***
Spring-Summer 0.26*** 0.04*** -0.02** 0.26***
Spring-Autumn 0.10*** -0.05*** -0.01ns 0.04*
Summer-Autumn -0.16*** -0.09*** 0.03*** -0.22***
Differences between seasons for total milk yield produced per day and average milk yield per cows per day were statistically significant (p<0.001), except for the difference between summer and autumn daily milk production per cow (p>0.05). Seasonal distribution of the milk chemical composition of the raw milk from the bulk tank is presented in Table 3. As opposite to the milk yield, the bulk tank milk chemical composition was the lowest in summer (3.89% fat, 3.30% protein, 4.64% lactose and 12.67% total solids) and the highest in winter (4.44% fat, 3.41% protein, 4.58% lactose and 13.21% total solids), with intermediate values in spring and autumn. The highest milk fat percentage was found in winter (4.6%), while in the summer the maximum value that was observed was 4.0%, value that was
representing also the minimum value during the winter. The minimum value for fat percentage was observed in autumn, 3.6%. Protein percentage ranged from a minimum value of 3.2% observed in spring, summer and autumn and the maximum value of 3.5% observed in winter and autumn. The minimum value for lactose percentage was 4.4% and was observed in all seasons, while the maximum value of 5.0% was obtained in winter. Total solids percentage was as low as 12.3% in winter and as high as 13.6% in autumn. The lowest variability for total solids in the bulk tank raw milk was observed during the summer, ranging from 12.5 % to 13.0%.
significant (p<0.05), except for the difference for lactose percentage between spring and autumn (p>0.05).This results are consistent with those presented by other scientists [9,10], showing that the milk composition was lower in summer than in winter.
Physical properties of the raw bulk tank milk collected daily in the farm, from season to season, are presented in Table 4. The freezing point of the milk varied within a small range from one season to another. The highest average for freezing point was observed during summer, -0.521C, while during the winter was obtained the lowest value for this trait, -0.526C. Generally, the season did not had a significant influence on the freezing point of the milk (p>0.05), except for the difference between the summer and winter, which reached the significance level (0.005C, p <0.05). It is, also, to be observed that the average freezing point in each season did not increased over the maximum limit accepted by the standards [11], -0515C. This means that the milk in the bulk tank was not adulterated by adding water. Other authors [12] found that the freezing point of milk was influenced by breed, successive lactations, lactation stage and the geographic region. In milk
with a high urea concentration (over 300 mg/L), the increased apparent protein level caused a decrease in the milk freezing point values. The combined influence of geographic region and production season showed significant interactions for daily milk yield and total solids content and the milk freezing point. Studying freezing point of goat milk other authors [6] found that this trait had higher values in the spring months and a drop at the end of lactation. Also, the freezing point corresponded to the non-fat solids content of the milk.
Density of the bulk tank milk was ranging between the normal limits from season to season (Table 4). The highest density of milk was recorded in autumn, 1.030, while the lowest was observed in spring, 1.02994. Differences among seasons were small and non significant (p>0.05), except for those between autumn on one hand and spring and summer on the other hand (0.00006, p<0.01 and 0.00004, p<0.05, respectively).
We could state that the freezing point and the density of milk from the bulk tank were not significantly influenced by the season of collection.
Table 4. Means and dispersion indices for raw milk physical properties to the season of collection
Season n No. of cows milked Freezing point (C) Density (g/cm3)
Winter 180 254 -0.526±0.000078 1.02997±0.000013
Spring 184 251 -0524±0.000069 1.02994±0.000018
Summer 181 251 -0.521±0.002602 1.02996±0.000015
Autumn 182 250 -0.525±0.000073 1.03000±0.000005
Differences and Significance
Winter-Spring -0.002ns 0.00003ns
Winter-Summer -0.005* 0.00001ns
Winter-Autumn -0.001ns -0.00003ns
Spring-Summer -0.003ns -0.00002ns
Spring-Autumn 0.001ns -0.00006**
Summer-Autumn 0.004ns -0.00004*
Table 5 presents the averages for hygienic properties of the raw bulk tank milk collected in the farm during the study period, according to the season. The highest average for somatic cell count was observed in spring, 238858.7 cells/ml, while the lowest was observed in summer, 228221.0 cells/ml. From season to season, the daily variation of the somatic cell count in milk was higher in winter, from 95000 to 361000 cells/ml and lower in summer, from 167000 to 342000 cells/ml. This variation form season to season of
calving cows [13]. Also, a significant interaction was found between season of calving and parity of cows [14]. A work on the raw milk from Western Romania [8] showed that the somatic cell count
was the highest in summer and autumn, exceeding 500000 cells/ml, while the lowest was in winter and spring.
Table 5. Means and dispersion indices for raw milk hygienic properties according to the season of collection
Season n No. of cows
milked
Somatic cell
count (cells/ml) count (cfu/ml) Total bacteria Coliform bacteria count (cfu/ml)
Winter 180 254 230427.8±3004.08 46316.7±1053.72 0.750±0.0376
Spring 184 251 238858.7±2706.86 49364.1±1020.41 0.900±0.0351
Summer 181 251 228221.0±2280.51 51375.7±1239.30 0.762±0.0203
Autumn 182 250 230500.5±2642.68 50335.2±1136.57 0.775±0.0220
Differences and Significance
Winter-Spring -8430.9* -3047.4* -0.150***
Winter-Summer 2206.8ns -5059.0** -0.012ns
Winter-Autumn -72.7ns -4018.5* -0.025ns
Spring-Summer 10637.7** -2011.6ns 0.138***
Spring-Autumn 8358.2* -971.1ns 0.125**
Summer-Autumn -2279.5ns 1040.5ns -0.013ns
Average for total bacteria count in bulk tank milk was within the accepted limits in all season (Table 5). During the winter season the average total bacteria count was significantly lower compared with the other season; 46316.7 cfu/ml vs. 49364.1 cfu/ml in spring (p<0.05), 51375.7 cfu in summer (p<0.01) and 50335.2 cfu/ml in autumn (p<0.05). In the summer time was observed the highest daily variation of this trait, from 21000 cfu/ml to 94000 cfu/ml. The maximum admitted level of 100000 cfu/ml was not observed in any season, grading all the milk produced in the farm during the study period in class A, from this point of view [11]. In year 2004, out of 14 dairy farms from the Western Romania, only 5 farms were producing raw milk complying with the standards for total bacteria count, and only 8 farms produced raw milk within the accepted limits for somatic cell count [15]. Coliform bacteria count, was on average, 0.750 cfu/ml in winter, 0.900 cfu/ml in spring, 0.762 cfu/ml in summer, and 0.775 cfu/ml in autumn. The higher value of this trait in spring was significantly different (p<0.01) compared to the value found during the other seasons. The averages for coliform bacteria count in all seasons complied with the maximum admitted levels [11]. From data presented in Table 5 we could state that the lowest value for total bacteria count in bulk tank milk is found in winter, while in spring the somatic cell count and coliform bacteria count were higher. This mean that cows have the highest susceptibility for new intra-mammary infection
during the spring time, and the bacterial stress is the lowest during the winter. Studying the lactation curve for milk yield, chemical composition and somatic cell count, the same authors [16] found that calving season had a significant effect on the shape of the lactation curve for these traits, summer calving cows having a flatter lactation curves for milk yield and composition, while for somatic cell count the flattest lactation curve was obtained in winter. Year and season of study interacted in their effect on the milk production indices. There were significant interaction (p<0.05) between the two factors on the milk yield, milk chemical composition, somatic cell count and coliform bacteria count. There was no interaction between year and season for physical properties of the milk (freezing point and density) and total bacteria count.
2000 2500 3000 3500 4000
D
aily
milk
y
ie
ld
(k
g)
Winter Spring Summer Autumn
2010 2011
Figure 1. Seasonal evolution of the total daily milk yield for the two years of study (year x season
interaction)
There was, also, a significant interaction between year and season for all chemical constituents of the milk. For exemplification we show in Figure 2 the interaction between the two factors for total solids in milk. Even though the pattern of total solids content was similar between the two years from season to season, only differences for winter (13.14% in 2010 vs. 13.29% in 2011) and spring (12.8% in 2010 vs. 13.06 in 2011) were statistically significant (p<0.001). We can say that the total solids content of milk was the lowest in summer and then increased in autumn, irrespective of the year (see Table 3).
12 12,2 12,4 12,6 12,8 13 13,2 13,4
T
ota
l s
olid
s (%
)
Winter Spring Summer Autumn
2010 2011
Figure 2. Seasonal evolution of the total solids in milk for the two years of study (year x season interaction)
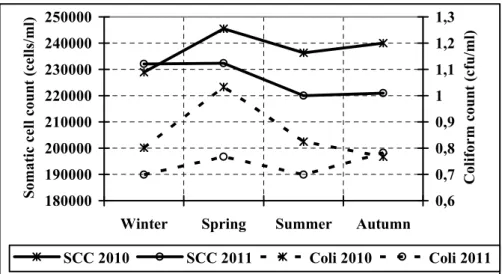
The season by year interaction on milk somatic cell count and coliform bacteria count of the raw milk is presented in Figure 3. These two hygienic characteristics of the milk had different patterns for each year from season to season.
Somatic cell count was similar in winter for both study years (228866.7 in 2010 and 231988.9 in 2011, p>0.05), while in year 2010 this trait was significantly higher than in year 2011 for spring (245413.0 vs. 232304.3 cells/ml, p<0.05), summer (236296.7 vs. 220055.6 cell/ml, p<0.01) and autumn (240022.0 vs. 220979.1p<0.001) seasons.
180000 190000 200000 210000 220000 230000 240000 250000
Winter Spring Summer Autumn
Somati
c c
el
l c
ou
nt
(c
el
ls
/m
l)
0,6 0,7 0,8 0,9 1 1,1 1,2 1,3
C
olif
or
m co
un
t (
cf
u/ml)
SCC 2010 SCC 2011 Coli 2010 Coli 2011
Figure 3. Seasonal evolution of the somatic cell count and coliform bacteria count in milk for the two years of study (year x season interaction)
For coliform bacteria count, there was an opposite interaction of year with season. Thus, in winter (0.802 cfu/ml in 2010 and 0.698 cfu/ml in 2011) and autumn (0.767 cfu/ml in 2010 and 0.782
count was significantly higher in year 2010 compared to year 2011.
4. Conclusions
Year of collection had a significant effect on the bulk tank raw milk yield, quality and hygiene, except for freezing point and total bacteria count. The raw milk yield and chemical composition improved from one year to another, as well as the hygienic quality obtaining a high-quality, class A milk.
Season of collection had a significant influence on the milk yield and chemical composition, the highest milk yield with the lowest concentration being obtained during summer season, while the lowest milk yield with the highest chemical composition was obtained in winter.
Physical properties of the raw milk were less affected by the season of collection, with the lowest freezing point in the winter and the highest density in the autumn.
The highest somatic cell count and coliform bacteria count was obtained during the spring and the lowest total bacteria count was obtained in winter season.
There was a significant interaction between year and season of production for all raw milk traits.
References
1. Cziszter, L.T., Dirijarea funcţiei glandei mamare,
Eurostampa, Timişoara, 2003, pp.50-77, 123-147,
228-238.
2. Quist, M.A., LeBlanc, S.J., Hand, K.J., Lazenby, D., Miglior, F., Kelton, D.F., Milking-to-milking variability for milk yield, fat and protein percentage, and somatic cell count, J. Dairy Sci., 2008, 91(9), 3412-3423.
3. Walker, G.P., Dunshea, F.R., Doyle, P.T., Effects of nutrition and management on the production and composition of milk fat and protein: a review, Aus. J. of Agric. Res., 2004, 10, 1009–1028.
4. http://en.wikipedia.org/wiki/Coliform_bacteria, accessed 14.03.2012
5. Hurley, W.L. – Lactation biology website,
http://classes.ansci.illinois.edu/ansc438/milkcompsynth /milkcomp_freezing.html accessed 16.03.2012
6. Janštová, B., Dračková, M., Navrátilová, P., Hadra,
L., Vorlová, L., Freezing point of raw and heat-treated goat milk, Czech J. Anim. Sci., 2007, 52, 394–398. 7. Rohm, H., Determination of the freezing point of milk – an analytical myth?, Z. Lebensm. Unters. Forsch., 1993, 197, 558-561.
8. Ilie, L.I., Tudor, L., Galis, A.M., Research concerning the main factors that influence the freezing
point value of milk, Lucr. St. Med. Vet. Timişoara,
2010, 43 (2), 228-234.
9. Cziszter, L.T., Milovan, Gh., Sala, C., Morar, A.,
Acatincăi, S., Baul, S., Erina, S., Tripon, I., Petreuş, C.,
Researches on chemical composition and somatic cell
count in raw cow milk, 2007, Lucr. Şt. Zoot. şi Biot.
Timişoara, 40, 2, 521-529.
10. Sala, C., Milovan, Gh., Morar, A., Cziszter, l., Raw milk quality in the farms from the west of Romania, Rev. Rom. Med. Vet., 2007, 17, 2, 142-146.
11. Ordinul ANSVSA nr. 682/2006 privind aprobarea
Grilei de parametric pentru negocierea preţului de
livrare a laptelui de vacă materie primă, stabilită de
reprezentanţii producătorilor şi ai procesatorilor, M.O.
846/13.10.2006.
12. Kędzierska-Matysek, M. Litwińczuk, Z. Florek, M.,
Barłowska, J., The effects of breed and other factors on
the composition and freezing point of cow’s milk in Poland, Int. J. of Dairy Tech., 2011, 64, 3, 336–342.
13. Cziszter, L.T., Stanciu, G., Acatincăi, S., Erina, S.,
Bochiş, F, Study on some factors influencing the milk
somatic cell count in Romanian Black and White cows, 2004, Bul. USAMV-NC, 60, 115-120.
14. Cziszter, L.T., Stanciu, G., Acatincăi, S., Baul, S.,
Erina, S., Tripon, I, Study on some factors influencing the milk somatic cell count in Romanian Black and
White cows, 2005, Lucr. Şt. Zoot. şi Biot. Timişoara,
38, 259-264.
15. Vintilă, T., Vintilă, C., Cziszter, L.T., Evaluation of
hygiene qualities of fresh milk produced in some dairy
farms in Western part of Romania, 2004, Lucr. Şt.
Zoot. şi Biot. Timişoara, 37, 535-539.
16. Cziszter, L.T., Acatincăi, S., Baul, S., Stanciu, G.,
Gavojdian, D., Tripon, I., Erina, S., Chemical composition and somatic cell count evolution during lactation in Romanian Black and White cows, 2008,