Lucrări ştiinŃifice Zootehnie şi Biotehnologii, vol. 41(1), (2008), Timişoara
THE INFLUENCE OF NON STARCH POLYSACCHARIDES
(NSP) CONTENT FROM FORAGES ON NUTRITIVE AND
BIOPRODUCRIVE INDICES AT BROILER CHICKENS
INFLUENłA CONłINUTULUI ÎN POLIGLUCIDE
NEAMIDONOASE (PNA) DIN FURAJE ASUPRA INDICILOR
NUTRITIVI ŞI BIOPRODUCTIVI LA PUII DE CARNE
ŞTEF LAVINIA, DRINCEANU D., PANDUR C., JULEAN C., LUCA I., ŞTEF D, TETILEANU RAMONA, FOTA D.
Banat's University of Agricultural Sciences and Veterinary Medicine Timisoara - Romania
The NSP in cereal grains are composed predominantly of arabinoxylans (pentosans), beta glucans and cellulose. The main soluble NSP in these grains are arabinoxylans, while in barley and oats the are betaglucans. In this experiment we want to establish the influence of NSPs and NSPi from barley on nutritive and bioproductive indices at broiler chickens. The experiment was carried out on 120 broiler chickens divided in four experimental groups (CL, EL1, EL2 and EL3). The difference between the experimental groups was the different percentage of barley in the structure of combined forage and it was between 0 and 30% in the growth period from eclosion to 21 days and between 0 and 40% from 22 till 42 days of age. On the entire growth period the smallest forage consumption was registered by the control group, which had no barley in the structure of combined forage and registered the smallest values of NSPs and NSPi. The body weight at experimental groups was smaller with 3.25% but the differences were not statistical significant. In the growth period from 0-6 weeks in the experimental group EL1 the specific consumption is greater with 5.63% comparatively with the control group CL.
Key words: nonstarch polysaccharides, nutritive and bioproductive indices, broilers
Introduction
all 1996). Concentrations of indiviadul oligosaccharides from total beta-glucans have been found to vary between oats and barley, suggesting variability in beta glucan structure (Edney, Marchylo and MacGrogor 1991). The increased viscosity interferes with the activity of digestive enzymes and subsequent movement of nutrients prior to absorbtion, therefore ultimately depressing growth rate and feed conversion. Thus it has been observed that foregut intestinal viscosity, in particular, corelates well with weight: gain and feed: gain (Bedford, Classen and Campbell 1991) and that variation in performance was substantially reduced especially with a multienzyme product which reduced gizzard viscosity to a greater extent (Bedford and Classen 1992).
Materials and Methods
The experiment was carried out on 120 broiler chickens divided in four experimental groups (CL, EL1, EL2 and EL3). The used hybrid was Ross 308. The four experimental groups were fed in two growing periods: in the first period, from 0 to 3 weeks, the combined feed had ensured 3158 kcal metabolizable energy (ME) and 23.08% crude protein (CP); in the second period, from 3 to 6 weeks, the combined feed ensured 3200 kcal metabolizable energy and 20.16% crude protein.
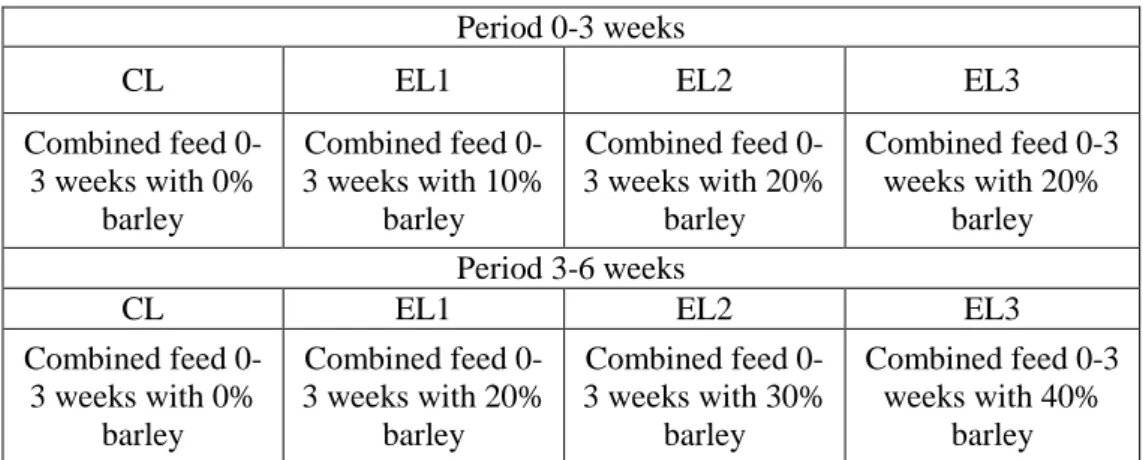
The difference between the experimental groups was the percentage of barley from the combined forage and was between 0 and 30% % in the growth period from eclosion to 21 days and between 0 and 40% from 22 till 42 days of age. The experimental scheme is presented in Table 1.
Table 1 The experimental scheme
Period 0-3 weeks
CL EL1 EL2 EL3
Combined feed 0-3 weeks with 0%
barley
Combined feed 0-3 weeks with 10%
barley
Combined feed 0-3 weeks with 20%
barley
Combined feed 0-3 weeks with 20%
barley Period 3-6 weeks
CL EL1 EL2 EL3
Combined feed 0-3 weeks with 0%
barley
Combined feed 0-3 weeks with 20%
barley
Combined feed 0-3 weeks with 0-30%
barley
Combined feed 0-3 weeks with 40%
barley
forage was incorporated barley in proportion of 20% in the first period of growth and in proportion of 30% in the second growth period. At experimental group EL3 in the first period of growth was incorporated barley in the structure of combined forage in proportion of 30% and in the second period of growth in proportion of 40%.
Results and Discussions
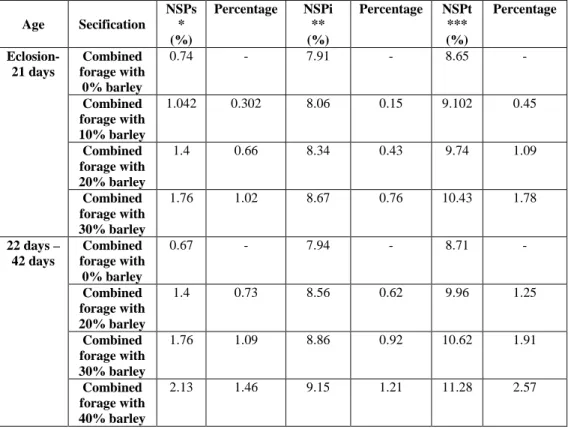
The NSPt, NSPs and NSPi content of forages used in broiler chickens nutrition are presented in table 2. The content of NSP from forages was establish on tabelar values (Englyst H.,1989) and on spectrofotometric determinations.
Table 2 The NSPt, NSPs and NSPi content of combined forages
Age Secification
NSPs * (%)
Percentage NSPi ** (%)
Percentage NSPt *** (%)
Percentage
Eclosion-21 days
Combined forage with
0% barley
0.74 - 7.91 - 8.65 -
Combined forage with 10% barley
1.042 0.302 8.06 0.15 9.102 0.45
Combined forage with 20% barley
1.4 0.66 8.34 0.43 9.74 1.09
Combined forage with 30% barley
1.76 1.02 8.67 0.76 10.43 1.78
22 days – 42 days
Combined forage with
0% barley
0.67 - 7.94 - 8.71 -
Combined forage with 20% barley
1.4 0.73 8.56 0.62 9.96 1.25
Combined forage with 30% barley
1.76 1.09 8.86 0.92 10.62 1.91
Combined forage with 40% barley
2.13 1.46 9.15 1.21 11.28 2.57
* NSP soluble, ** NSP insoluble, *** NSP total
From table data it can be observed that the levels of NSPs and NSPi rise with the proportion of the barley in the structure of combined forages.
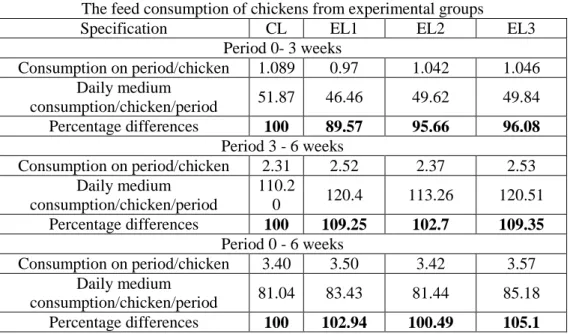
those remained when the chickens reached the age of 3 and 6 weeks. We calculated the feed consumption on period per chicken and the medium daily consumption for each period. The obtained data are presented in Table 3.
Table 3 The feed consumption of chickens from experimental groups
Specification CL EL1 EL2 EL3
Period 0- 3 weeks
Consumption on period/chicken 1.089 0.97 1.042 1.046 Daily medium
consumption/chicken/period 51.87 46.46 49.62 49.84
Percentage differences 100 89.57 95.66 96.08
Period 3 - 6 weeks
Consumption on period/chicken 2.31 2.52 2.37 2.53
Daily medium consumption/chicken/period
110.2
0 120.4 113.26 120.51
Percentage differences 100 109.25 102.7 109.35
Period 0 - 6 weeks
Consumption on period/chicken 3.40 3.50 3.42 3.57
Daily medium
consumption/chicken/period 81.04 83.43 81.44 85.18
Percentage differences 100 102.94 100.49 105.1
The data from table above show that the smallest forage consumption was registered by the control group, which had no barley in the structure of combined forage and registered the smallest values of NSP.
In order to establish the evolution of body weight we weighed the chickens at one day, at 3 weeks and at 6 weeks of age. The obtained results are presented in Table 4
Table 4 The evolution of body weight at chickens from experimental groups
Specification CL EL1 EL2 EL3
n 30 30 30 30
Weight at eclosion (g) 39±0.38 39±0.33 39±0.32 39±0.43 Weight at 3 weeks (g) 614.53±13.46 529.75±15.56 554.5±18.37 577.25±17.97
Percentage values 100 86.2 90.23 93.93
CV (%) 19.13 18.62 17.25 15.85
Statistical differences NS NS NS
Weight at 6 weeks (g) 2100.28±80.81 2032.14±71.94 2085.71±85.26 2089.69±89.72
Percentage values 100 96.75 99.3 99.49
CV (%) 9.56 10.35 8.93 12.42
Statistical differences - NS NS NS
Table 4 shows that at 42 days of age the highest body weight was registered by the chickens from control group at which the combined forage was based on corn. The body weight at experimental groups was smaller with 3.25% but the differences were not statistical significant.
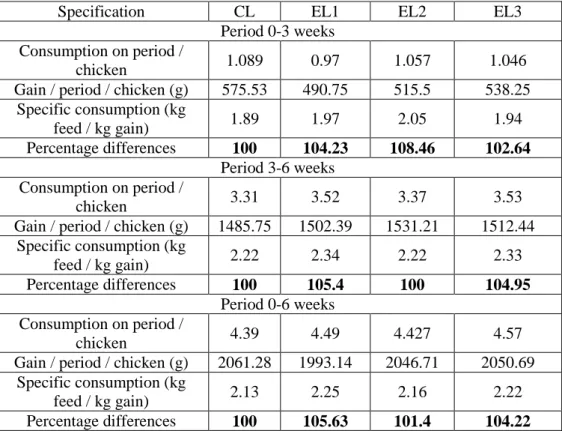
Coroborating the consumption data with body weight we obtained the specific consumption. The evolution of specific consumption is presented in the Table below.
Table 5 Evolution of specific consumption at chickens from experimental groups
Specification CL EL1 EL2 EL3
Period 0-3 weeks Consumption on period /
chicken 1.089 0.97 1.057 1.046
Gain / period / chicken (g) 575.53 490.75 515.5 538.25 Specific consumption (kg
feed / kg gain) 1.89 1.97 2.05 1.94
Percentage differences 100 104.23 108.46 102.64
Period 3-6 weeks Consumption on period /
chicken 3.31 3.52 3.37 3.53
Gain / period / chicken (g) 1485.75 1502.39 1531.21 1512.44 Specific consumption (kg
feed / kg gain) 2.22 2.34 2.22 2.33
Percentage differences 100 105.4 100 104.95
Period 0-6 weeks Consumption on period /
chicken 4.39 4.49 4.427 4.57
Gain / period / chicken (g) 2061.28 1993.14 2046.71 2050.69 Specific consumption (kg
feed / kg gain) 2.13 2.25 2.16 2.22
Percentage differences 100 105.63 101.4 104.22
The data presented in Table 5 show that: in the growth period from 0-6 weeks in the experimental group EL1 the specific consumption is greater with 5.63% comparatively with the control group CL.
Conclusions
-The inclusion of barley in the structure of combined forages determined the rising of NSPs and NSPi levels;
-The body weight decrease with the rising ol NSPs and NSPi levels from the structure of combined forage with 3.25% but the difference is not statistical segnificat;
-The specific consumption rise at the experimental groups to which the combined forage included barley.
Bibliography
1. Bailey , R.W., 1973, Structural carbohydrates In: Chemistry and Biochemistry of Herbage. No 1 Edited by Butler , G. W, Bailey R.Ww., pp 157-211, Aacademic Press , New York
2. Bedford Mr., Classen H.L., 1992 – Reduction of intestinal viscosity by beta –
glucanases in barley fed broilers: site of action and effect on bird performance.
Anim. Prod. 54: 470
3. Bedford M.R., Classen and Campbell G.L., 1991 – The effect of pelleting, salt
and pentosanase on the viscosity of intestinal contents and the performance of broiles fed rye. Polutry Science 70:1571-1577.
4. Hopwood D.E., Pethick, D. W., Pluske, J.R., Hampson, D.J., 2004, Addition
of pearl barley to a rice – based diet for newly weaned piglets increased the viscosity of the intestinal contents, reduces starch digestibility and exacerbates post – weaning colibacillosis . British Journal of Nutrition 92: 419-427
5. Edney M.J., Marchylo and A.W. MacGregor, 1991, Structure of total barley
beta – glucan. Inst Brew 97: 39-44
6. Englyst, H., 1989, Animal Feed Sci. Technology, 23-27 7. Pluske, J.R., Siba P.M., Pethick, D.W., Durmic A., Mullan, B.P., and Hampson, D.J., 1996, The incidence of swine dysentery in pigs can be reduced by feeding diets that limit the amount of fermentable substrate entering the large intestine. Journal of Nutrition 126:2920-2933