© 2019 Penerbit UTM Press. All rights reserved
Dynamic Control of Sensor and Actuator failures in Multivariable Distillation
Column
Ali H. Al-Shatri
1, 2, Arshad Ahmad
1, 2*, Olagoke Oladokun
1, 2, Bemgba Bevan Nyakuma
1, 2, Ali Al-shanini
31
Centre of Hydrogen Energy, Institute of Future Energy, Universiti Teknologi Malaysia, 81310 UTM Johor Bahru,
Johor, Malaysia
2
Department of Chemical Engineering, Universiti Teknologi Malaysia, 81310 UTM Johor Bahru, Johor, Malaysia
3Department of Chemical Engineering, Hadhramout University, Mukalla, Yemen
*Corresponding author: [email protected]
Article History
Received: October 16, 2018 Received in revised form: February 11, 2019 Accepted: November 10, 2019 Published Online: December 09, 2019
Abstract
This paper examines the impact of sensor and actuator failures in the operation of a multivariable distillation column. Several failure scenarios are evaluated including failures of sensors and actuators in various scales of magnitudes and durations. The results obtained illustrate the ability of process controllers in suppressing the impact of these unwanted events. Closed-loop dynamic responses of the process revealed capabilities of these controllers in dealing with upsets that are small in magnitude and duration. In the case of larger and longer process upsets, process controllers are not adequate in providing the necessar y corrective measures. This leaves the necessary interventions to be taken by the plant operators, following alarms that would have been triggered in typical plant operation scenario.
Keywords: Multivariable distillation column; abnormal process situations; PI-control; actuator failure; sensor failure
INTRODUCTION
Chemical plants are becoming increasingly complex due to the needs of achieving high economic performance in challenging set up of more stringent product specifications and higher environmental standards. This typically forces the operations near constraints, which may cause process failures and plant shutdown if not properly managed. Even failures of supporting devices such as sensors and actuators may lead to suboptimal performance of the process plant, higher operation costs, violation of production specifications and major damage to equipment if not brought under control by appropriate responses [1]. These uncertainties are managed in process plants through multiple layers of protections as shown in Figure 1.
According to this hierarchical strategy, process control is the first line of defence in suppressing the impact of abnormal situations. On occasion of failures, alarms will be triggered to provide warning to the plant operators so that appropriate actions are taken. If this is not successful, protections are provided by a safety interlock system (if any). Finally, there are relief devices, which operate based on mechanical function to reduce the accumulation of materials by diverting it to recovery system or the atmosphere. This is the last component of the plant automation, and beyond this, the plant safety is facilitated by passive mitigating measures such as containment systems and management efforts such as emergency evacuations [2].
RESEARCH ARTICLE
Open Access
Damage region
Dangerous region
Upset operating region
Safe operating region
Operating target Interlock system
Alarm system
Process control system Shutdown system
Figure1 The process plants safety protection layers
In terms of overall plant performances and safety, process control plays pivotal role by adjusting the operating conditions to satisfy various production specifications. It is in fact the first line of defence in process operation, failing which, higher level functions may be activated. These include alarms, interlocks and relief systems. Product quality is maintained by either directly controlling the product composition on-line analysers or on-line data-based inferential models, or indirectly by fixing some key variables that have significant impact on the product quality of interest. In any case, failure of process controllers and/or related auxilliary devices impacts the overall performance significantly. To illustrate this issue, a multivariable distillation column for separating aromatic components is studied. Distillation is an important process widely used in purifying final products in the petroleum and chemical industries. Typical of a chemical process distillation system is multivariable and nonlinear in nature, thus making controller design more complicated and interactive. It is important to ensure that the distillation controllers operate efficiently as the consumption of material and energy, output quality, operation safety, and process cost are strongly influenced by the distillation control system performance [3].
In a typical distillation operation, set points are fixed and control tasks are therefore associated with disturbances rejection functions to deal with external disturbances and interactions introduced due to actions of other control loops. Various different strategies have been developed and reported in the literature [4-7]. While these techniques offer solutions for dealing with small disturbances, larger process upsets resulting from failures of instruments, and other auxiliary equipment are often difficult to handle. Examples of distillation malfunctions along with their main causes are summarized by Kister[8], in which it was concluded that the number of failures is on the rise and accelerating even with the tremendous progress in distillation.
There are different classification of faults based on time dependency, influence on system, and location of occurrence in the
system. Faults according to time dependency are classified to abrupt, incipient and intermittent [9], while faults according to influence on system models can be divided into additive faults and multiplicative faults [10]. In addition, faults are also classified according to their location of occurrence in the system such as; actuator faults, sensor faults, and process faults [9]. Lack of understanding of the impact of fault, lack of awareness of hazard, and inappropriate response to deal with abnormal situations are risk factors accompanying with failure to implement under abnormal situation management [11, 12].Therefore, the process control engineer needs to understand the impacts of these faults on control performance.
In this paper, assessments on the impact of sensor and actuator failures are carried out through simulation studies on a multivariable distillation column simulated in MATLAB environment. Several scenarios of failures are performed, and the dynamics and stability of control loop operations are analysed.
2.0 CASE STUDY
2.1 Process Description
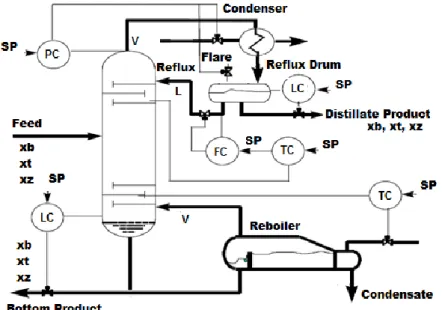
Figure 2. Multi-component distillation column with proposed control structures
Derivations on this nonlinear mathematical model is shown in the previous work of Al-Shatri and co-authors[13]. The mathematical model applies the mass and energy balance equations, basic laws of thermodynamics, and algebraic energy equations supported by vapour liquid equilibrium and physical properties to correlate all of the variables. The model has 40 state variables that are represented by a set of nonlinear differential equations.
The mass and energy balance in the condenser tray are given by
1 - ( )
2 1
dM
V L D
dt
(1)
( 1 1, )
- ( ) 2 2, 1 1,
d M x j
V y j L D x j
dt
(2)
( 1 1)
- ( ) -2 ,2 1 ,1
d M H
V HV L D HL Qc
dt
(3)
Here, x1,j and yi,j are liquid and vapour mole fractions of benzene, toluene and xylene on the tray 1, D is the top product molar flow rate, L1 is the liquid reflux flow rate, M1 is the liquid hold-up in reflux drum, V2 is the vapour molar flow rate comes on, HL and HV are liquid and vapour enthalpies, and QC is the condenser duty.
The mass and energy balance in the rectifying and stripping sections are given by
1 1
dMi V V L L
i i
i i
dt
(4)
( , )
y , x,
1, 1, 1, 1,
d M xi i j
Vi j i j V yi i j Li j ix j Li i j
dt
(5)
( H )
H H , H H ,
1 , 1 1 , 1
d Mi i
Vi V i Vi V i Li L i Li L i
dt
(6)
tray is given by Eq. (8) [14]:
Li=L1+ Mi-M0,i
tl +(Vi+1-VNt)l (7)
Li=(Li+F)+ Mi
-M0,i
tl +(Vi+1-VNt)l (8)
Here Mo,I is the normal liquid hold-up on tray i, is the effect of vapour flow on liquid flow which assumed close to zero, t
l is time constant for the liquid flow dynamics, Nt is the reboiler tray, and F is the feed flow which is entering the column at boiling point (q=1).
The mass and energy balance in the feed tray Nf are given by
1 1
dMNf
F VNf VNf LNf LNf
dt
(9)
( , j)
y x
, j 1 1, j , j 1 1, j , j
d MNf Nfx
Fxf VNf Nf V yi Nf LNf xNf LNf Nf
dt
(10)
( H )
H H H H
1 , 1 , 1 , 1 ,
d MNf Nf
FHf VNf V Nf VNf V Nf LNf L Nf LNf L Nf
dt
(11)
The mass and energy balance in the reboiler tray Nt are represented by the following equations
1
dM Nt L V B
Nt Nt dt
(12)
( Nt, j)
_ x
1 Nt, j Nt, j
d MNtx
LNt VNty B
dt
(13)
( H )
H ,Nt H ,Nt 1 , 1
d M Nt Nt L H V B Q
Nt V L R
Nt L Nt
dt
(14)
Here B is the bottom product flow rate and QR is the reboiler duty. The vapour-liquid equilibrium for multicomponent is calculate using the Eq. (15) below [15].
, ,
,
x j i j yi j
x j i j
(15)
Here j is the constant relative volatility of benzene, toluene, and xylene. Their values are 2.34, 1, and 0.44 respectively. The
liquid and vapour enthalpies moving across the trays are calculated through thermodynamic rules as illustrated in Eqs. (16) and (17).
( , )
, ,
( y, ) ( y, ) )
V, ,
H i Mwtj i jCpV i T Mwtj i j (17)
where CpL and CpV are the heat capacity of the components in liquid and vapour phase, Mwtj is the molecular weight, ∆T is the
difference between the standard and tray temperature, and is the latent heat of vaporization.
In order to design the control structure of the dynamic model, it is better to select which variables to control, which variables to manipulate, and which variables are considered as disturbances. The identification of process variables is given in Table 1.
Table 1. Model variables classification
Controlled variables Manipulated variables disturbances
Top product composition Liquid comes down Feed flowrate
Bottom product composition Vapour boil-up Feed composition
Reflux drum level Top product flow-rate
Reboiler level Bottom product flow-rate
2.2 Control of Column
A control scheme essentially depends on the process goals designed to ensure process stability, and to suppress and compensate deviations arising from disturbances or equipment failures, and achieve acceptable product specification. In generally, control schemes alleviate the consequences of designed errors and optimise the operations to reduce cost and enhance product quality [16]. A number of control strategies have been proposed for distillation processes, including D-B, D-V, L-B, L-V, and (L/D) (V/B) configurations [14]. Selection the optimal control configuration is carried out using a steady-state RGA [11] as key measures, and based on this methodology, L-V configuration is selected as listed in Table 2. L-V control configuration is known as the energy balance configuration that use reflux flow L and vapour boil up V as manipulated variables (internal molar flow) to control the purity of the top product and the impurity of the bottom product and referred to as primary control loops. whereas, top (D) and bottom (B) product flowrate (external molar flow) use to control reflux drum and reboiler level and refereed as secondary control loops.
Table 2. Steady-state RGA
Description Liquid comes down Vapour boil-up Top flow-rate Bottom flow-rate
Overhead Comp. (Benzene) 1.0671 -0.0672 -4.12E-09 6.57E-05
Bottom Comp. (Benzene) -0.0659 1.0296 4.35E-08 0.0362
Reflux drum level -1.26E-09 -2.03E-08 1.0000 0
Reboiler level -0.0012 0.0375 -6.10E-08 0.9637
Although, advance process controls techniques exist, the PID control algorithm is still extensively used in process industries due to its robustness, simple tuning procedure, and the fact that it performs well in dealing with modelling uncertainties and valve and sensor failure [17, 18]. A PID controller is an algorithm that takes the present, past, and future of the error into consideration as illustrated in Equation (18)
u(t)= Kc e(t)+ 1
Tiòe(t)dt+Td de dt
æ
èç
ö
ø÷
(18)Here, Kc is the controller gain which acts on the present value of the error, Ti is the integral time constant that represents an
average of past errors, Td is the derivative time constant which is given a prediction of future errors. The tuning parameters for
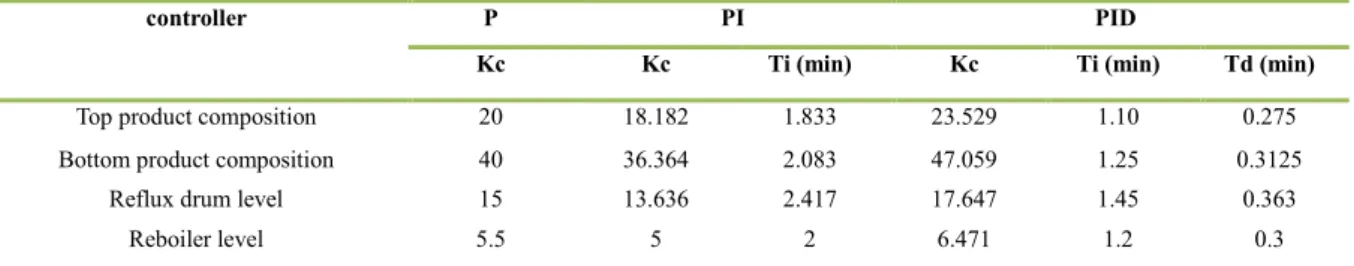
Table 3. Summary of controller parameters gains using Ziegler-Nichols method
controller P PI PID
Kc Kc Ti (min) Kc Ti (min) Td (min)
Top product composition 20 18.182 1.833 23.529 1.10 0.275
Bottom product composition 40 36.364 2.083 47.059 1.25 0.3125
Reflux drum level 15 13.636 2.417 17.647 1.45 0.363
Reboiler level 5.5 5 2 6.471 1.2 0.3
The velocity form of the digital PID algorithm is derived directly form a digital version of the parallel PID control as illustrated in Eqs. (18) and (19) [19, 20]. In this study PI-control is used instead of PID control due to insensitive to multi-loops interaction and provides a smooth response of output variables and zero control error. Furthermore, same considered by Hurowitz et al.[21] due to the low ratios of dead time-to-time constant for all control loops.
( 1) ( 2 1 2)
T
t d
MVN Kc eN eN eN CVN CVN CVN
Ti t
V V
V
(19)
1
MVN MVN VMVN (20)
Where CVN, MVN, and SP are represented the current values of the controlled variable, manipulated variable input, and set point
at the current sample N, with the current erroreN SPCVN.
3.0 SIMULATION RESULTS AND DISCUSSION
3.1 Process Steady State Simulation
The operation condition of the proposed dynamic model was mathematically adjusted and initialized based on the purity of the main component (Benzene) and simulated in MATLAB R2018a programming environment using fourth order Runge-Kutta method with adaptive step size algorithm to provide the steady-state of the process. All physical and chemical properties, thermodynamic data, and vapour-liquid equilibrium for the aromatic compounds (Benzene, toluene, and o-xylene) are taken from thermodynamic and chemical engineering books. The dynamic model was incorporated with control strategy to control quality of the products and level of reflux drum and reboiler using multi-loops PI-control. Hence, the main process conditions at steady state are presented in Table 4.
Table 4. The operation condition data for all main streams
External stream data Feed Top product Bottom product
Stage number 5 1 10
Flow rate (Kmole/min). 10 5 5
Temperature (K). 379.17 332.97 425.32
Pressure (atm). 1 1 1
Benzene (mole %). 60 99.25 20.75
Toluene (mole %). 25 0.73 49.27
Xylene (mole %). 15 0.02 29.98
Reflux ratio 1.8
Condenser duty (KJ/min) 363377.21
Reboiler duty (KJ/min) 369224.10
3.2 Abnormal Process Situations Management
Table 5. Specification of failure scenarios
Failure Actuator Sensor
Short-term failure Total failure in top product, bottom product, and liquid comes flowrates for 10 minutes.
Top product sensor drift ±10 % for 20 minutes.
Medium-term failure Total failure in top product, bottom product, and liquid comes flowrates for 40 minutes.
Top product sensor drift ±20 % for 40 minutes.
Long-term failure Total failure in top product, bottom product, and liquid comes flowrates as a continue failure.
Top product sensor totally broken down and stay as a continue error.
3.2.1 Equipment Failure (Actuator)
About 20–30 % of major deviations in control loops are due to valve problems such as stiction, hysteresis or total stuck [3]. Total actuator failures are handled as multiplicative faults. On the contrary, partial actuator failure is a part of normal operation which is considered as additive faults including leakage, increase or decrease the voltage of power supply line [9]. There are many ways to model the faults on actuator. For the sake of simplicity, the standard dynamics of physical systems can be described by the following discrete-time, time-invariant Eq.21 [22]
( 1) ( ) ( )
( ) ( ) ( )
x k Ax k Bu k
y k Cx k Du k
(21)
Here, xRn is the state vector, uRm is the system’s input vector, yRp is the output vector measured by the sensors. A,
B, C, and D are statistic matrix of system with proper dimension obtained by identification procedure.
Actuator faults result from the malfunction of the actuators can be modelled as a step change of the system input as shown in Eqs. 22 and 23[9].
( 1) ( ) ( ) ( )
( ) ( ) ( ) ( )
x k Ax k B au k B I au
y k Cx k D au k D I a u
(22)
1a, 2a,... a
, a .diag R
a m i
(23)Where uRm is input fault vector (may be not constant) that cannot be manipulated, and a total failure takes place when
0
a i
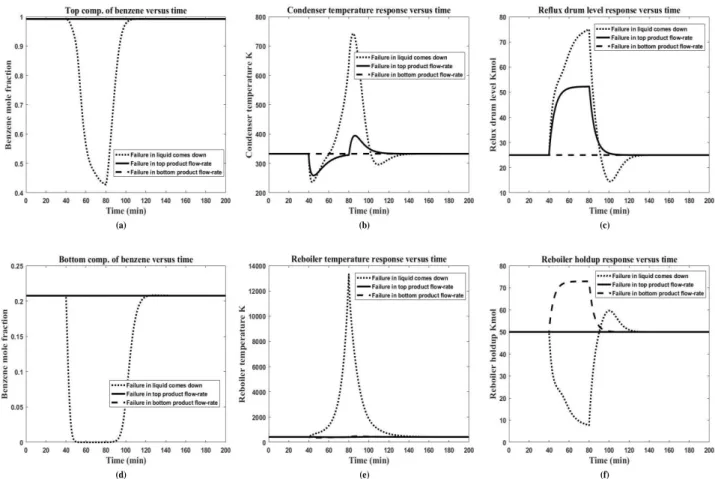
(total malfunction) of i-th actuator of the system.In this section, three scenarios are examined. Firstly, a short-term (10 minutes) total failure of valve is considered, followed by medium-term failure (40 minutes), and finally a long-term failure. Figure 3 (a, b, c, d, e, f) presents the results obtained from the dynamic simulations of valve stuck-closed for top product flow-rate, bottom product flow-rate, and liquid drops down, occurring independently at time (40 minutes) and maintained as a continued failure for 10 minutes. As illustrated by the dynamic response of the closed-loop simulation, the most impacted output variables when the top product flow-rate valve stuck, are the reflux drum level, condenser temperature, and reboiler temperature. The compositions of the top and bottom product streams and the reboiler level are not affected. Similarly, when the bottom product flow-rate valve stucked, the reboiler temperature and reboiler level are significantly affected, while the top and bottom product composition, condenser temperature and reflux drum level are not affected.
(a)
(d)
(c) (b)
(f) (e)
Figure 3. Control strategy response when top product flow-rate, bottom product flow-rate, and liquid comes down valve totally stuck for (10 min) at time (40 min).
Next, a medium-term failure of actuator (valve stuck-closed for 40 minutes) is examined. Three positions of failure were presented. These are top product flow-rate, bottom product flow-rate, and liquid comes down. Results are as illustrated in Figure 4 (a, b, c, d, e, f). The results revealed that the top product flowrate (i.e. distillate flow), is least sensitive as the impact of failure on this actuator does not significantly impacting the performances except for the liquid level in the reflux drum, which is expected. Similarly, when a fault was implemented on the bottom product valve, the process is still capable of maintaining within the desired set point. Temporary setbacks can be observed for the reboiler liquid level.
(a)
(d)
(b)
(e) (f)
(c)
Figure 4. Control strategy response when top product flow-rate, bottom product flow-rate, and liquid comes down valve totally stuck for (40 min) at time (40 min).
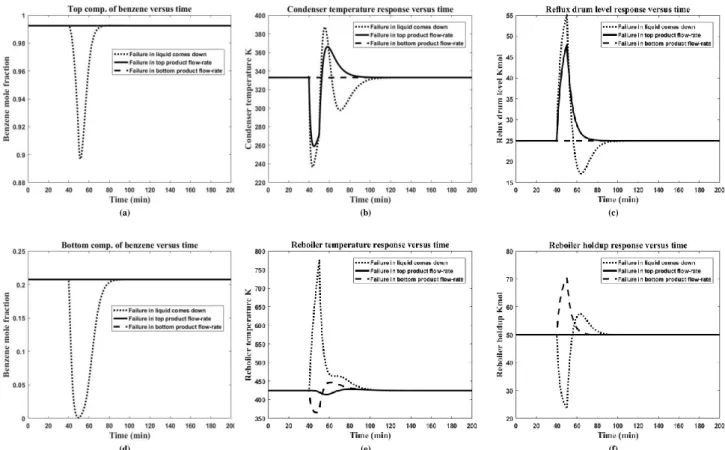
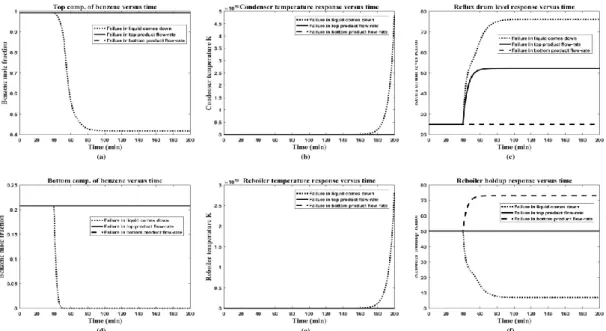
Lastly, a long-term failure of actuator (valve stuck-closed as a continue failure) was examined. Three positions of failure were introduced to the top product flow-rate, bottom product flow-rate, and liquid comes down flow-rate. As shown in Figure 5 (a, b, c, d, e, f), the operation is manageable by the control system for cases involving failures in the distillate stream flow valve. The most sensitive output variable is the reflux drum level, which would lead to potential overflow. A similarly situation can be observed for the case of bottom product stream, where a failure of the bottom product actuator was successfully compensated except fot the reboiler level.
Figure 5 also illustrates that when a total failure occurs on the actuator for liquid comes down stream, the closed-loop dynamic
responses of all output variables is significantly affected. The system control is unable to maintain the variables within the
(a)
(d)
(c) (b)
(f) (e)
Figure 5. Control strategy response when top product flow-rate, bottom product flow-rate, and liquid comes down valve totally stuck at time (40 min) and stay as a long-term failure.
3.2.2 Measurement Error
Error in measurement of process outputs is another major problem in process operations, especially if these output variables are used in control loops. In such cases, computations of control actions are no longer reliable since they are made based on inaccurate or totally wrong values that do not represent the actual operating condition [23]. Typically, these faults are due to errors in sensor reading, which can either be partial or total failures. Total sensor fault is considered as multiplicative faults due to failures involving variety of parts. In the situation when sensor faults are independent of the measured magnitude, they are classified as additive faults. In the same way, sensor faults occur in the system Eq. 21 when sensor reading is incorrect. So, the
actual output of the system y
k differs from the measured value. These patterns of faults can be modelled as[9]:
( 1) ( ) ( )
( ) ( ) ( ) ( )
x k Ax k Bu k
y k sCx k sDu k I s y
(22)
1s, 2s, ..., s
, s .diag R
s
m
j
(23)Where yRpis an offset vector, and sj 0 indicates a total failure (malfunction) of j-th sensor, and sj 1 represents the
normal status of the j-th sensor operation. While value of sj(0,1) represents the partial sensor fault modelling.
The effects of the measurement errors on operating conditions and process control are examined based on the three scenarios.
Firstly, minor drift ±10 % of the sensor for a short period (20 min). Then expanding the drift magnitude to ±20 % of the sensor and remain erroneous for 40 min to represent a medium-term failure. Finally, the sensor is considered permanently failing,
signifying a long-term failure.
Figure 6 (a, b, c, d, e, f) present the effects of short-term error on the reading of the top product composition sensor, i.e., drift
(a)
(d)
(b)
(e) (d)
(c)
Figure 6. Control strategy response when top product sensor drifts (±10 %) at time (40 min) for (20 mins).
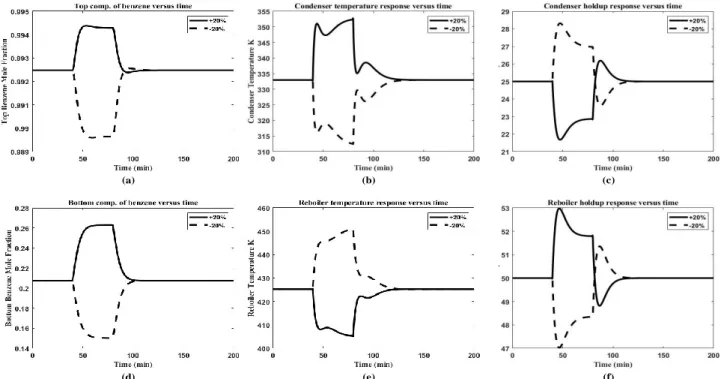
In the case of the medium scaled sensor error, i.e., ±20 % sensor drift for 40 minutes, as illustrated in Figure 7 (a, b, c, d, e, f), The controllers employed were able to bring the operations from initial deviations to acceptable levels.
(a)
(d)
(c) (b)
(f) (e)
Figure 7. Control strategy response when top product sensor drifts (±20 %) at time (40 min) and continuous unchanged.
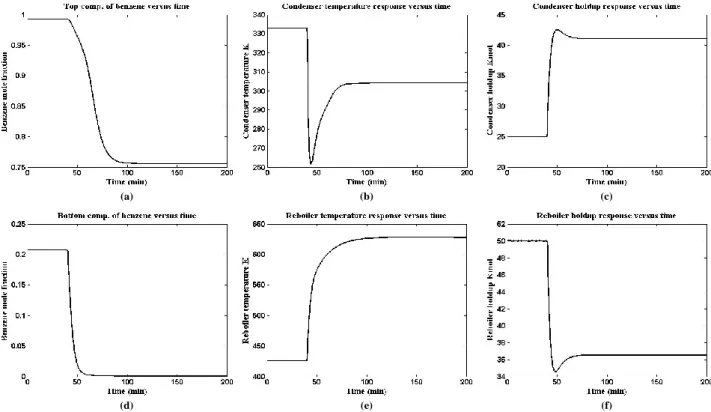
Finally, as expected, the case of total sensor failure will lead to larger deviations. As shown in Figure 8 (a, b, c, d, e, f), the
closed-loop dynamic response of all output variables are significantly affected. The controllers failed to recover the process
(a)
(d)
(b) (c)
(e) (f)
Figure 8. Control strategy response when top product sensor broken at time (40 mint).
In practice, chemical process plants are constantly exposed to variety of process upsets such as process disturbances, equipment failures, measurement errors, interruption of utilities and environmental changes. These abnormal situations may lead to consequences that are expensive, such as schedule delays, equipment damage, environmental hazards, and poor product quality, and sometimes may also result in fires or explosions [24]. These are managed by various layer of protections equipped by the plant operation system, the core of which, is the process control system that is designed to suppress these upsets to acceptable level. Failure of the control system is normally backed up by the plant operator interventions upon alerts provided by the alarm system. For some key variables, there are additional protections provided by safety interlocks and relief devices. These features operate as multiple independent layers of protection to ensure the plant is running smoothly to satisfy the production specification.
Among these layers of protection, the alarm system is most subjective. Since appropriate decisions and/or actions are to be taken immediately at the time of occurrence, there are minimum amount of time available for detailed analysis. More developments in this area are needed to offer tools to facilitate process plants in minimizing human errors and avoiding delayed responses. Features such as early detection and diagnosis can be adopted to facilitate decision making and minimize the probabilities of productivity loss during an abnormal situation [25, 26].
4.0 CONCLUSION
The studies presented in this paper illustrate a broad overview of potential operational problems as a result of abnormal process situations (APS), which may appear unexpectedly. The results have illustrated that while smaller upsets are normally manageable by existing layers of protection normally installed as part of the plant operation system, larger and longer process upsets may subject the plant to larger uncertainties including undesireable hazard and operability issues. These failures or faults could have been prevented before they become critical and causing catastrophes, if the information about process failures had been accessible in a timely efficient manner. To reduce the risk of human errors in carrying out recovery actions, features such as early warning systems, fault diagnosis and alarm management are needed. Using carefuly crafted fault detection and diagnosis system, assistance can be made available to plant operators to decide on the best course of actions when the needs arize.
Acknowledgements
References
[1] Zumoffen, D., M. Basualdo. 2008. From Large Chemical Plant Data To Fault Diagnosis Integrated To Decentralized Fault-Tolerant Control: Pulp Mill Process Application. Industrial & Engineering Chemistry Research. 47(4): 1201-1220.
[2] Rothenberg, D.H. 2009. Alarm Management for Process Control: A Best-practice Guide for Design, Implementation, and Use of Industrial Alarm Systems. Momentum Press.
[3] Jelali, M. 2012. Control Performance Management In Industrial Automation: Assessment, Diagnosis And Improvement Of Control Loop Performance. Springer Science & Business Media.
[4] Enagandula, S., J.B. Riggs. 2006. Distillation Control Configuration Selection Based On Product Variability Prediction. Control Engineering Practice. 14(7): 743-755.
[5] Wahid, A., A. Ahmad. 2016. Improved Multi-Model Predictive Control To Reject Very Large Disturbances On A Distillation Column. International Journal of Technology. 6: 962-971.
[6] Al-Shatri, A.H., A. Ahmad, N. Abdullah, O. Oladokun, A. Al-Shanini, M. Khalil. 2015. Control and Optimization Of Aromatic Compounds In Multivariable Distillation Column. Chemical Engineering Transactions. 45.
[7] Marangoni, C., E. Zierhut, I. Parisotto, R. Machado, A. Bolzan. 2017. Influence of the Location of the Internal Temperature Control Loop on the Performance of the Dual Temperature Control for Feed Temperature Disturbance. Chemical and Biochemical Engineering Quarterly. 30(4): 411-418.
[8] Kister, H.Z. 2003. What Caused Tower Malfunctions In The Last 50 Years? Chemical Engineering Research and Design. 81(1): 5-26.
[9] Kanev, S.K. 2004. Robust Fault-Tolerant Control. University of Twente.
[10] Isermann, R. 2005. Model-Based Fault-Detection And Diagnosis–Status And Applications. Annual Reviews in control. 29(1): 71-85.
[11] Bullemer, P.T., L. Kiff, A. Tharanathan. 2011. Common Procedural Execution Failure Modes During Abnormal Situations. Journal Of Loss Prevention In The Process Industries. 24(6): 814-818.
[12] Eljack, F., M.-K. Kazi. 2016. Process Safety And Abnormal Situation Management. Current Opinion In Chemical Engineering. 14: 35-41.
[13] Al-Shatri, A.H., A. Ahmad, N. Abdullah, O. Oladokun, A. Al-shanini, M. Khalil. 2015. Control and Optimization of Aromatic Compounds in Multivariable Distillation Column. Chemical Engineering Transaction. 45: 469-474.
[14] Skogestad, S. 1997. Dynamics and Control Of Distillation Columns: A Tutorial Introduction. Chemical Engineering Research and Design. 75(6): 539-562.
[15] Halvorsen, I.J., S. Skogestad. 2003. Minimum Energy Consumption In Multicomponent Distillation. 3. More Than Three Products And Generalized Petlyuk Arrangements. Industrial & Engineering Chemistry Research. 42(3): 616-629.
[16] Seborg, D.E., D.A. Mellichamp, T.F. Edgar, F.J. Doyle III. 2010. Process Dynamics And Control. John Wiley & Sons.
[17] Åström, K.J., T. Hägglund. 2006. Advanced PID control. ISA-The Instrumentation, Systems and Automation Society.
[18] Vu, T.N.L., M. Lee. 2010. Multi-loop PI Controller Design Based On The Direct Synthesis For Interacting Multi-Time Delay Processes. ISA transactions. 49(1): 79-86.
[19] Ahmad, A., A. Samad, N.A. Fazli, A.W. Chow. 2003. Mathematical Modeling And Analysis Of Dynamic Behaviour Of A Fed-Batch Penicilin G Fermentation Process. Proceedings of International Conference on Chemical and Bioprocess Engineering. 387-394.
[20] Marlin, T.E., T. Marlin. 1995. Process Control: Designing Processes And Control Systems For Dynamic Performance. McGraw-Hill New York.
[21] Hurowitz, S., J. Anderson, M. Duvall, J.B. Riggs. 2003. Distillation Control Configuration Selection. Journal Of Process Control. 4(13): 357-362.
[22] Ding, S.X. 2008. Model-Based Fault Diagnosis Techniques: Design Schemes, Algorithms, and Tools. Springer.
[23] Yang, S.-F., H.-W. Ho, M.A. Rahim. 2007. Effects of Measurement Error On Controlling Two Dependent Process Steps. Economic Quality Control. 22(1): 127-139.
[24] Bullemer, P.T., I. Nimmo. 1994. Understanding and supporting Abnormal Situation Management In Industrial Process Control Environments: A New Approach To Training. Systems, Man, and Cybernetics, 1994.'Humans, Information and Technology'., 1994 IEEE International Conference on. 391-396.
[25] Monroy Chora, I. 2012. An Investigation On Automatic Systems For Fault Diagnosis In Chemical Processes.