New Service Provider Economics with Network Optimization Services
Executive Summary
Service providers want to optimize their networks to minimize total cost of ownership (TCO), contain operational risk and environmental impact, and concurrently monetize their network base with services that increase average revenue per user (ARPU) and profitability. Traditionally, service providers use a variety of appliances to deliver and monitor services and ensure security services; however, this approach becomes more inefficient, complex, expensive and risky as network scale and service offerings increase.
Juniper Network’s Network Optimization Services portfolio trumps these shortcomings by integrating services on one platform, the MX Series 3D Universal Edge Router, and one operating system, Junos®. Consolidating service on the MX Series 3D supports the business goals of service providers by significantly lowering the cost to implement and operate the network and by improving return on network and service investments (ROI).
ACG Research compared network upgrades for three hypothetical mobile operators. Operator 1 implemented a traditional appliance-based network; Operator 2 implemented a hybrid approach using both router-based services and appliance-based services; Operator 3 implemented a fully converged infrastructure based on Network Optimization Services. Among other findings, our research established that the Juniper Network Optimization Services
Key Takeaways
Compared with appliance-based service solutions, Network Optimization Services offers:Financial benefits
42% lower TCO 54% lower OpEx 29% lower CapEx
Operations benefits
95% less OS patch/upgrade costs 84% lower OAM costs
17X lower operational risk 76% floor space reduction 75% less power costs 74% cooling reduction
Time to market benefits
69% faster rate of deployment 76% faster rate to add new apps 14X less implementation risk
Introduction
A service delivery scenario is developed for three theoretical network operators that are deploying a next-generation mobile broadband data service network that meets the following business and technical requirements:
Invest in and protect scale through 40Gbps capacity and 2 million subscribers per service zone.
Increase ARPU via monetization services such as targeted ad insertion and managed video.
Better optimize network resource utilization with intelligent traffic balancing.
Reduce network bandwidth demands by transparently caching popular web content.
Extend without disrupting the current IPv4 address pool.
Improve network visibility and fault isolation capabilities.
Protect network resources and assets and improve security posture.
Ensure nonstop network availability.
The scenario includes optimization and monetization services that are typically implemented in service providers’ networks. Specifically:
Optimization services
o L4 load balancing and L4-L7 Application Delivery Control to optimize traffic distribution;
o Web caching to reduce network bandwidth demands;
o Flow monitoring for network troubleshooting and analysis activities;
o Carrier-grade network address translation (CGN) to ensure an efficient, low-risk
transition to IPv6;
o Firewall services for network security.
Monetization services
o Targeted ad service that provides anonymous subscriber-related data to ad networks
and inserts optimal ads into the subscribers web transactions; and
o Managed video service that delivers premium video for subscribers.
The study analyzes cost, time to revenue, ROI, risks and other criteria for three different approaches to service delivery:
Operator 1 uses an appliance-based service approach: each service is implemented using a
discrete appliance that is connected to the network via a router or switch.
Operator 2 uses a hybrid approach: some services are router-integrated, some appliance based.
Operator 3 uses a converged Network Optimization Services-based approach: all services are
implemented on the Juniper MX960.
In the analysis, all capital expenses (CapEx) are incurred on project initiation; operations expenses (OpEx) are incurred and calculated over five years.
Operator 1, Appliance-Based Service Delivery
Figure 1 – Operator 1, Logical Appliance-Based Network Configuration
This redundant design employs 42 individual network elements and 7 network operating systems to provide routing, switching flow monitoring, CGN, application delivery control, firewall, managed video, transparent caching and targeted ad insertion. It consumes 152 square feet of floor space.
Operator 2, Hybrid Service Delivery
Figure 2 – Operator 2, Logical Hybrid-Based Network Configuration
Operator 2 employs routing, switching and some services on the router itself. Flow monitoring runs as a licensed application on the routing cards. CGN runs on one type of service card and managed video on a different type of service card. Load balancing, firewall, transparent caching and targeted ad insertion are
Mobile Operator 3, Full Service Convergence Using Juniper Network Optimization Services
Figure 3 – Operator 3, Full Convergence Network Configuration
Operator 3 uses Network Optimization Services to fully consolidate routing, switching and all services on the Juniper Networks MX960 Universal Edge Router. Flow monitoring and transparent load balancing are licensed applications for Junos Trio chipset-based routing cards. CGN, Application Delivery Controller and targeted ad insertion run on a processing optimized service card. A storage optimized service card hosts managed video and web caching. This redundant design uses just two MX960 chassis and one network operating system, Junos®, and occupies a single, standard telecom rack.
The MX Series 3D Universal Edge Router and the Junos operating system support routing, switching, security and services, including partner developed applications that are fully integrated with Junos® via the Junos SDK. This converged approach greatly reduces network and service design and testing complexity, time and costs when contrasted with solutions composed of elements and multiple operating systems. This innovative design allows the easy addition of new applications via non-disruptive license activation, and service cards provide linear scale without linear costs.
Network Optimization Services include features that improve service delivery:
The MX Series 3D integrates routing, switching, security and service functions.
The Junos® operating system provides consistent operations across all functions and
applications.
Modular applications allow incremental service deployment to support evolving requirements.
Services consolidation and convergence for environmental impact reduction.
Network and service consolidation reduces training, sparing and service contract related costs.
Total Cost of Ownership Comparisons
The initial costs to implement each service complex and ongoing operations expenses over five years are compared in this section. Figure 4 shows the TCO comparison for the cumulative five-year TCO.
Figure 4 – Five-Year Cumulative TCO Comparison
Using Network Optimization Services, Operator 3 has 42% lower TCO, 54% less OpEx and 29% less CapEx than Operator 1. Operator 3 also has 42% lower TCO, 48% less OpEx and 37% less CapEx than Operator 2. The lower CapEx and OpEx afforded by Network Optimization Services are directly attributable to its converged architecture. The following table summarizes the number of chassis and operating systems used by the solutions.
Operator Service Approach Chassis Operating
Systems
Operator 1 Appliances 42 7
Operator 2 Hybrid 25 5
Operator 3 Network Optimization Services 2 1
Table 1 – Number of Chassis and Network Operating Systems
The primary source of CapEx advantage over the other approaches is the use of a single chassis type (the MX960) for all services. Operator 1’s appliance-based service model uses 21 times more chassis than Operator 3’s Network Optimization Services implementation. Operator 2’s hybrid approach uses 13 times more chassis than Operator 3’s Network Optimization Services approach. Because each chassis has common equipment such as power supplies, fans and controllers, the multiple chassis used by Operators 1 and 2 replicate these costs many times. In the Network Optimization Services implementation, the common components of the MX Series 3D chassis power routing, switching and services.
Figure 5 – Five-Year OpEx Comparisons less Vendors’ Service Fees
The Network Optimization Services has substantially lower OpEx in each expense category because implementing fewer chassis reduces labor expenses, environmental costs, and vendors’ service fees.
Environmental Impact Comparison
Figure 6 shows the environmental impact of powering and cooling the service delivery equipment.
Figure 6 – Five-Year Environmental Impact Comparison (Carbon Emissions)
The electricity needed to power and cool the network produces greenhouse gases. Operator 3’s implementation reduces these emissions by 76% compared to Operator 1 and 63% compared to Operator 2.
Operator 1 Operator 2 Operator 3
1,200,000 miles 800,000 miles 300,000 miles
Table 2 – Emissions Expressed as Equivalent Miles Driven
Time to Market and Time to Add a New Service Comparison
Network Optimization Services improve time to market by utilizing a single network element (the MX Series 3D) and operating system (Junos®), enabling a consistent set of operations, administration and management processes (OAM); software update schedule and procedures; and technical support. Time to market increases when multivendor multi-element solutions are used, as it takes longer to qualify vendors and certify elements. Implementation times were analyzed using a work breakdown structure per solution and show that the rate of deployment time for the MX Series 3D and Network Optimization Services is 69% and 38% faster to implement than the appliance and hybrid solutions, respectively (which is equivalent to 41% and 28% reduction in number of days to deploy system and services). This faster deployment time adds 13% and 7% more to top-line revenue to Operator 3 as compared to Operator 1 and Operator 2.
A service provider’s ability to quickly respond to market trends and customers’ requests with new services is a major competitive advantage. The time to add a new service to an existing network is 76% faster (which is equivalent to 46% reduction in number of days) for the Network Optimization Services as compared to the other solutions, as no additional vendor or element qualification is needed. This makes it feasible to rapidly exploit market niches that could not be profitably addressed with traditional solutions.
Comparison of Implementation and Operational Risks
All implementation projects are subject to risks: Vendor/product fails qualification.
Qualified technical staff is not available.
Installation fails due to bad design or execution.
Project management risks where coordination breaks down and unforeseen events occur.
The probability of encountering these risks increases with complexity. Simply, the risk of a failed vendor qualification increases if three vendors are qualified rather than one; the risk of an install failure grows as the number of chassis and operating systems increases. Given a 1% chance of an implementation failure event occurring per chassis, Operator 3 faces a 2% chance of implementation failure per facility;
ROI on Monetization Services
The return on investment realized in deploying two monetization services is analyzed:
Targeted Advertising: subscribers can opt in to receive preference-based web advertisements.
Mobile Video: operators can offer high-quality mobile video services to subscribers.
The ROI obtained by investing in the service delivery equipment needed to deliver these services is compared for the three operators. Although the additional revenue is the same for each operator the investment cost, monthly recurring operations expense, and time to market differs for each operator because of their choices of service delivery architecture.
ROI Results
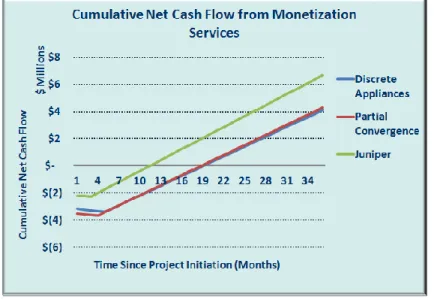
The net cash flow consisting of 7% ($294,000 per month) of the revenue from the ad insertion and video services less the initial investment in service delivery equipment and monthly operations expenses is used to compute the ROI over 36 months for each mobile operator. Only 7% of the revenue is attributed to the investment in service delivery equipment because there are many other expense components, for example, sales, promotions, billing, and general and administrative expenses that are not part of this analysis. Figure 7 shows the cumulative net cash flow for each operator.
Figure 7 – Cumulative Net Cash Flow from Monetization Services
A substantial net cash flow advantage is seen for the Network Optimization Services solution versus the appliance and hybrid service solutions. ROI over 36 months is 171%, 170% and 266% for the appliance, hybrid and Network Optimization Services solutions, respectively. The Network Optimization Services solution reaches the break-even point in 12 months; the other solutions require 19 months to reach the break-even point.
Conclusion
Three service delivery solutions, discrete appliances, hybrid convergence, and the Network Optimization Services full convergence approach, were compared by modeling implementation and operation of the solutions for three mobile broadband operators. Selected network optimization and monetization services were featured in the analysis. Table 3 summarizes the amount of savings produced by the Juniper Network’s Network Optimization Services solution.
Metric Discrete
Appliances Hybrid Model Network Optimization Services
Network Optimization Services Percentage OS Patch and
Upgrade Cost Savings 95% less 92% less -
Network Optimization Services Percentage OAM Cost
Saved 84% less 76% less
Network Optimization Services Percentage Less Emissions 75% less 63% less -
Time to Market (months) for First Office Application 115 94 68
Network Optimization Services Percentage Time Saved to
Add a Service to the Network 46% less 46% less
Monetization ROI 171% 170% 266%
Risk of Failure Event if Each Chassis Has a 1% Chance of
Failure 34% 22% 2%
Network Optimization Services Percentage Space Saved 76% less 27% less -
Power Consumed compared to Network Optimization
Services 4x more 2.5x -
Network Optimization Services Five-Year TCO Percentage
Saved 42% less 42% less -
CapEx Juniper Percentage Saved 29% less 37% less
OpEx Juniper Percentage Saved 54% less 48% less -
Table 3 – Summary of Results, Percentage Savings Produced by Network Optimization Services Our research indicates that Juniper Network’s Network Optimization Services solution reduces cost, environmental impact and improves network ROI by providing full convergence of routing, switching, security and services. It delivers consistent operations and management across applications, produces environmental efficiency and lowers the cost of deployment and operations.
ACG Research
ACG focuses on providing market analysis and consulting to help service providers, enterprises, and vendors monetize their existing infrastructures and increase operational efficiency and profitability. Through ROI and TCO