ACKNOWLEDGEMENTS, ABSTRACT..., LIST OF TABLES... LIST OF FIGURES.,
INTRODUCTION...___ WETLANDS USED IN TREATING WASTEWATER... CHARACTERISTICS OF BOTTOMLAND HARDWOOD FOREST$
PRIMARY PRODUCTIVITY IN BOTTOMLAND HARDWOOD FORESTS... SEWAGE IMPACTS ON VEGETATION... ...
SEWAGE IMPACTS ON COMMUNITY STRUCTURE. SITE CHARACTERIZATION... STUDY OBJECTIVES... . . . .... . .___ MATERIALS AND METHODS... D.B.H. MEASUREMENT... RANDOM CORE SAMPLING... TREE RING ANALYSIS..., ANALYSIS AND INTERPRETATION OF GRAPHS, RESULTS...___ TREE IMPORTANCE VALUES: ALL TREES...., SEWAGE IMPACTS ON TREE GROWTH... SUMMARY OF RESULTS...___. ,
PAGE i ii iii , iv
1
,1 2
5
,7
9 .10 ,11 14
,14 ,16
,20 ,21
,23
DISCUSSION.
SEWAGE IMPACTS ON THE GROWTH OF FLOOD-TOLERANI TREES..., OTHER IMPORTANT CONSIDERATIONS IN BROWN MARSH SWAMP... BROWN MARSH SWAMP USED IN SEWAGE TREATMENT. CONCLUSIONS... RECOMMENDATIONS FOR FUTURE RESEARCH... LITERATURE CITED...
32
32
37
,38
coritributed Dr. Edward J. Kuenzler gave great encouragemerit
advice, lab space and help with the field work throughout
the length of this project. Dr. Michael Syinons time and advice on the statistical analyses
Cross, Suzanne Thompson and many volunteers helped considerably with the field work of this project,
a number of them were part of a class field trip, in data gathering is appreciated. Alice Carberry some research material.
performed
Although heir aid
jtrovided
ABSTRACT
GREGORY B. EIBAND. Impacts of Past Sewage Exposure
Growth of Bottomland Hardwood Trees. (Under the of Dr. EDWARD J. KUENZLER)
on the Direction
A series of permanent vegetation plots was est^ablished
under the direction of Drs. Edward J. Kuenzler and Curtis
Richardson. From 1985 to 1990, diameter at breast height
measurements were made on all tagged trees. In 19^0, cores
were taken from randomly selected trees and the growth rings
were examined to detect differences between the
sevrage-impacted and non-sevrage-impacted years. The results of AlfOVA
models showed statistically significant growth differences
among plots. Regression analysis revealed a pattei-n of
increased tree growth immediately downstream of the sewage
sprayfield. Black gum (Nyssa sylvatica var. bifloi-a) showed
11the greatest increase in growth due to municipal s«iwage
loading. Tupelo gum (Nyssa aguatica) and baldcypr«iss
(Taxodium distichum) showed considerably less growth changes
due to municipal sewage loading. Brown Marsh Swamp
downstream of the sewage sprayfield seems to funct;.on
normally after the sewage has ceased flowing through this
TABLE
LIST OF TABLES
PAGE
Table 1.
Table 2. Table 3.
Table 4.
Table 5.
Table 6.
Table 7.
Key for Interpretation of Tree Species Tables...
in
Sample Calculations for Core Sampling.
44 45
Total and relative density of trees in Permanent
Plots 1-4 at Brown Marsh Swamp, 1990....J...46
Importance Values for Trees in Permanent
1-4 at Brown Marsh Swamp, 1990...
Plots
47
Total and Relative Density of Trees in Permanent
Plots 5-10 at Brown Marsh Swamp, 1990...j...48
Importance Values for Trees in Permanent
5-10 at Brown Marsh Swamp, 1990...
Plots
49
Two Factor ANOVA using Tree Species and as the Factors...
]>lots
FIGURE
LIST OF FIGURES
iv PAGE Fig. 1. Fig. 2. Fig. 3. Fig. 4. Fig. 5, Fig. 6, Fig. 7 Fig. 8. Fig. 9, Fig. 10,
Map of the Brown Marsh Swamp study area, 51
The mean and standard error growth (cm) o
aquatica including the spray field plots,
to 1990.(d.b.h. data)...
Nyssa from 198 6
...52
The mean and standard error of change in dfrowth
(cm.) of Nyssa aquatica (Method 1 of core data; difference between 1986-1990 growth and 1«81-1985
growth)...J...52
The mean and standard error of change in dfrowth
(cm.) of Nyssa aquatica (Method 2 of core data:difference between 1986-1987 growth and IS 88-1990
growth)...J...53
The mean and standard error of change in growth (cm.) of Nyssa aquatica (Method 3 of core data;
difference between 1986-1987 growth and IS 84-1985
growth)...J...53
Regression diagram of change in growth (cii) of Nyssa sylvatica var. biflora including Plot 10,
(Method 1 of core data: difference between
1986-1990 growth and 1981-1985 growth)...J...54
cii
Plot
Regression diagram of change in growth (
Nyssa sylvatica var. biflora excluding
(Method 1 of core data: difference betweeiji
1990 growth and 1981-1985 growth)....
) of
10.
1986-___54
Regression diagram of change in growth (ci|i
Taxodium distichum including Plot 10.
of core data: difference between 1986-199 and 1981-1985 growth)...
) of
(Method 1 growth
___55
Regression diagram of change in growth (c]|i) of
Taxodium distichum excluding Plot 10. of core data: difference between 1986-199
and 1981-1985 growth)...
(Method 1
growth ___55
en) of
1 of
Regression diagram of change in growth (
Nyssa aquatica including Plot 10. (Method
core data:difference between 1986-1990 gr([)wth
Fig. 11. Regression diagram of change in growth (cii) of Nyssa aquatica excluding Plot 10. (Method 1 of core data: difference between 1986-1990 growth
and 1981-1985 growth)... Fig. 12
Fig. 13
Fig. 14
Fig. 15,
Regression diagram of change in growth (cii) of
Nyssa sylvatica var. biflora including Plot 10,
(Method 2 of core data: difference between
1986-1987 growth and 1988-1990 growth)...J...57
Regression diagram of change in growth (cm) of Nyssa sylvatica var. biflora excluding Plot 10.
(Method 2 of core data: difference between
1986-1987 growth and 1988-1990 growth)...j...57
Regression diagram of change in growth (cri Taxodium distichum including Plot 10.
of core data: difference between 1986-198''
and 1988-1990 growth)...
Regression diagram of change in growth (cm Taxodium distichum excluding Plot 10.
of core data: difference between igse-igsv
and 1988-1990 growth)...
Fig. 16, Regression diagram of change in growth (cm) of Nyssa aquatica including Plot 10. (Method 2 of
core data: difference between 1986-1987 gijrowth
and 1988-1990 growth)...,
56 ) of (Method 2 growth ...58 ) of
(M4thod 2
growth ___.58 59 Fig. 17. Regression diagram of change in growth (cm) ofNyssa acfuatica excluding Plot 10. (Method 2 of core data: difference between 1986-1987 growth
and 1988-1990 growth) Fig. 18,
Fig. 19,
Regression diagram of change in growth (cm) of
Nyssa sylvatica var. biflora including Plot 10, (Method 3 of core data: difference between 198
6-1987 growth and 1984-1985 growth)...j...60
Regression diagram of change in growth (cm) of Nyssa sylvatica var. biflora excluding Plot 10,
(Method 3 of core data: difference between
1986-1987 growth and 1984-1985 growth)...I...60
Fig. 20. Regression diagram of change in growth (ci)i) of Taxodium distichum including plot 10.
of core data: difference between 1986-198 and 1984-1985 growth)...
59
(Method 3
Fig. 21. Regression diagram of change in growth (citj) of
Taxodium distichum excluding Plot 10.of core data: difference between 1986-1987 and 1984-1985 growth)...
Fig. 22,
Regression diagram of change in growth (cri) of
Nyssa acfuatica including Plot 10. (Method 3 of
core data: difference between 1986-1987 giowth and 1984-1985 growth)...62
Fig. 23. Regression diagram of change in growth (en.
Nyssa acfuatica excluding Plot 10. (Methoc
core data: difference between 1986-1987 and 1984-1985 growth...
VI
(Method 3 growth ____61
) of 3 of
giFowth
bottomland Wetlands Used in Treating Wastewater
The use of freshwater wetland systems for the further
treatment of secondarily treated municipal wastewater is
becoming more common in the southeastern part of the United
States. Although many different types of wetlands are used
to accept this wastewater, in North Carolina most o|f these
wastewater discharges are to river swamps orhardwood forests (Kuenzler, 1987, 1988). Wetlands tend to occur in depositional environments that accumulate sediments from adjacent ecosystems (Brinson, 1985). The soils in the wetland system are usually a mixture of clay and silt and have a high organic content (Kuenzler, 1989).
Wetlands are often viewed as a nuisance to
developers because they are unable to use these syst
productively. However, wetlands have many function
values to the immediate adjacent natural systems
in these functions and values are hydrologic values
productivity and biotic values. Perhaps the most value attributed to a freshwater wetland is the abi
improve surface water quality by removing sediments
nutrients and toxic chemicals (Kuenzler, 1989) . Th|e
wastewater treatment function of a wetland is an attempt to farjmers and
ems
s and Included
, organic i|mportant
lity to
flood-treatment
ever
;ediirent
of Ewel,
a
s and The
capitalize on the capacity for material accumulatio|n beyond
the natural levels of the system (Brinson, 1985) The characteristics of swamps dominated by tolerant trees give them potential for further
secondary wastewater (Boyt et al. . 1977, Lemlich an|d 1984). The dispersion of the nutrient-rich water large area increases the surface contact with s vegetation (Boyt et al.. 1977, Richardson, 1988)
vegetation is adapted for filtering and settling thle
nutrient load for use in growth (Boyt et al.. 1977, Nichols,
1983) . Wetlands vegetation can readily assimilate organic
and inorganic constituents from water (Guntenspergen et al.,
1989) . The increased nutrients and particulates provide an efficient substrate for microorganisms 1983). In general, nutrient removal efficiencies i
systems are high depending upon the particular swaitjp
Variations in removal efficiencies occur because of
different redox states in the system, the amount of organics
already present in the system, and the sediment type
(Richardson, 1988, Kuenzler, 1989). This generali
applicable to point and non-point sources of pollut
Characteristics of Bottomland Hardwood Forests Bottomland hardwood forests are forests that
river floodplains in the southeastern portion of
also
(Nichols,
ijn swamp
system.
zation IS
ion.
groundwater periodically during the growing season. The
water color is naturally dark, acidic, low in nutribnts and
low in conductivity (Kuenzler, 1987). The prevalent woody
species associated with this habitat demonstrate the ability
to survive, achieve maturity, and reproduce in a habitat
where soils in the root zone may become anaerobic for
various periods during the growing season (Odum, 1984,
Mitsch and Gosselink, 1986). Southern deepwater swamps are
defined as freshwater, woody communities with water
throughout most or all of the growing season (Mitsch and
Gosselink, 1986). Groundwater in these systems enters the
swamp in sufficient amounts to sustain flow through
non-storm periods. In the southeast, these communities are
generally dominated by cypress and tupelo gum (Mitsch and
Gosselink, 1986).The chemistry of these systems fluctuates between
aerobic and anaerobic conditions, depending on the severity
of flooding. In comparison to other systems, there is an
intermediate organic content of the alluvial soils.
Productivity is determined by the degree of floodirg and the
supply of nutrients provided by floodwaters (Messira et_al.,
1983) . Flooding provides adequate water and contirual
nutrient replenishment. During anoxic periods, the
nutrients may be mobilized from the sediments to tt.e water
Gosselink, 1986). The nutrient cycles are generally
these wetlands, but they can serve as effectivesinks. The general pattern is a net import of the wetland and a net export of organics from the
(Mitsch and Gosselink, 1986).
Trees that grow in these environments have adaptations that enhance their survival during
periods. The flooded anaerobic environment reduces
for respiration and mineral nutrient availability
metabolism (Guntenspergen et_al., 1989). Both
gum trees produce knees or arched roots that
extend above the high water mark of the swamp.
functions of these knees and arched roots are they are thought to aid in gas exchange and tree
(Odum, 1984, Mitsch and Gosselink, 1986,
al., 1989). Trees that are found in flooded areas swollen buttresses which also aid in gas exchange stability (Mitsch and Gosselink, 1986, Guntensp al.,1989). The roots of these trees have adapted nutrients from the interstitial water in the s
(Guntenspergen et al.. 1989). During anoxic condit
cypress and gum trees are capable of circulating
the root systems to ease stress (Guntenspergen et
1989).
nutrient
inorganics to wetland
developed extremely wet
oxygen for
cypress and
generally
Although speculat
stab Guntenspergen et
and
)ergen to sediments
open m
the
ive, ility
et have
tree et obtain
ions. oxygen to
productivity in
Many studies have shown that primary
bottomland hardwood forests and other similar ripar systems is influenced primarily by hydrologic and conditions with other factors influencing the syst
well. It has been established that primary
riparian systems is higher than that of terrestrial
(Ewel, 1975, Brown, 1981, Brinson et_al., 1984,
Gosselink, 1986 Guntenspergen et al., 1989). Within
different types of forested wetlands, there is much
variation in the primary productivity. Ewel (1975) that the growth of cypress trees in pure cypress low while the growth of cypress trees in cypress-stands characterized by moderately wet conditions These findings were confirmed by Mitsch and Ewel ( Brinson, et al.. (1981) showed the range of primary productivity of U.S. riparian wetlands in to be 8 00 dry weight/m yr.
The hydrologic conditions of a forested wetlar(d
important impact on the productivity of the system
water swamps are generally more productive than si
water swamps, which are more productive than
still-swamps. (Brown, 1981). Fluctuating water levels
essential for growth and seed germination of trees
systems (Ewel, 1975, Mitsch and Gosselink, 1986).
flowing through the swamps functions in several
aie
capac
lan
nlutrient
em as
productivity in
systems Mitlsch and
the
found
was
o
high.
79) . stands tupel
was
19
-1600 g
have an Flowing
-moving water
cw
in these Water
forested
seme
water
the water brings nutrients to the vegetation, washes away
waste products from the vegetation and brings oxygejn to the
root systems (Mitsch and Gosselink, 1986, Guntensp^rgen et
al. , 1989). Water in a forested wetland can have njegative
effects as well. At extremely high water levels, alnoxic
conditions from slow-moving or standing water can qamage or
kill vegetation. The depth of the water in a
wetland will also effect species distribution as
species are more flood-tolerant than others (Keele^)
Guntenspergen et al.. 1989). The flow rate of
the system will also have an effect on oxygen and availability and plant development. With increased rate comes increased oxygen and nutrients for plant
and reduced residence time and effects of toxic (Guntenspergen et al.. 1989).
As mentioned above, nutrient availability is related to the hydrology of a forested wetland and turn affects the growth of trees in the system. Ni4tr
inputs to a forested wetland from point or non-poirit
are mainly removed from the water by sorption onto
(Brown, 1981, Richardson, 1988,). The accumulatior
vegetation is relatively small in comparison (Brin^on
al. , 1984). Increasing tree wood increments accouiit
3.6% of nitrogen inputs and 0.3% of phosphorus inpv.ts
(Brinson et al. . 1984). A large portion of the nit(rogen
inputs into the system is also removed through the
, 1979, through
riutrient flow growth,
sukjstances
qlosely this in
lent
sources
sediments into
1984) . The mean rates of net daytime photosynthesj and wood production are related to the phosphorus i
into the forested wetland (Brown, 1981).
s, growth
inputs
introdvct
Sewage Impacts on Vegetation
Recent concern of sewage introduction into spurred much research on this subject. The i
a large amount of nutrients into a system may caus
to the system, and these stresses are the subject
this research (Odum, 1984, Mitsch and Gosselink, IS
Kuenzler, 1987). The studies can be divided into
concerning the community structure and those conceij^n
plant uptake. The results are discussed below.
Every study that has been concerned with tree a result of the addition of sewage found that the experimental plots (sewage added) grew at a higher
the control plots. The results of one study were
variance. Lemlich and Ewel (1984) found that the
of raw or primary sewage to trees in cypress stranc^s
negative effect on growth while secondary sewage growth, possibly due to less extensive reducingand less impact or formation of toxic compounds
(1981) reported that photosynthesis and respiration
wetland vegetation increase with increasing phosph
wetlands has ion of stress f much of 86,
tlhose ing
growth as
rate than alt
addition had a
eijhanced
conditions Brown
in
hydr operiods,
inputs, but leaf and fruit production decrease. Evten in
cypress domes, which are characterized by long
the addition of sewage increased productivity in th|e trees
by 2-3 times. Ewel and Odum (1978) discovered a 2.5-fold
increase in basal area increments and greater seedljlng
survival after the addition of sewage to a Florida cypress
dome for more than 50 years. Nessel and Bayley (19 84)
reported that mean basal area increments in a cypress strand
receiving wastewater increased 1.7-2.3-fold. Phosphorus
uptake by cypress was also higher in the experimental sections, and there was a 2.6-fold increase in leaf phosphorus concentrations.
Litterfall was also higher in the sewage-impacjted
trees. Boyt et_al., (1977) reported higher tree swamps that receive sewage as a result of increased
uptake. Nessel et__al. , (1982) reported an increase
area increments in black gum and cypress after sewafge
addition.
It was also discovered that even mature trees
respond to an increase in nutrients to the system, and Ewel (1984) found that wastewater increased the:
content of leaves and fruit in a cypress dome and
litterfall was also increased. Deghi (1984) reporij^ed
addition of sewage to tupelo gum and bald cypress
increased mortality and decreased the growth rate
gr[owth in
nutrient in basal
can
Dierberg
nutrient
that
that
Seedlings
survivors. Ewel (1975) reported that trees grow si faster when exposed to sewage, but the difference v statistically different. Dierberg and Brezonik (19
that the nutrient content of aboveground cypress tree
components increased because of wastewater additior(. In
general, the addition of wastewater to forested wetllands
enhances the nutrient uptake and growth of the treejs in
these systems.
teriest Sewage Impacts on Community Structure
The community structure of a forested wetland affected by the introduction of a large amount of but these changes are not irreversible (Ewel, 1984) current total biomass is representative of past di and past productivity rates (Brown, 1981). In
systems, the addition of a large amount of nutrient
results in a change in species composition and inva
non-native plants, but in wetland systems, the c
speciation is not significant (Ewel, 1984). An
change to the community is the appearance of a
of small floating plants (Ewel, 1975, Ewel and Oduni
Ewel, 1984). These small floating plants can rapid
process sewage nutrients in the water and transfer
sediments where plants have access to them. However
plants can also reduce the oxygen content of the water
thic:k
ightly as not 84) found
is also
r(utrients.
The ^turbances
rial s often sion by
in charge
imf lortant
cover
, 1978, ly
10
thereby killing fish, amphibians, insects and some emergent
plants (Ewel and Odum, 1978). The biomass and spedies turnover rates are also increased with the addition of
sewage to the wetland (Ewel, 1975, Brown, 1981) . V^ith
regards to the effects on species diversity in
sewage-impacted wetlands, there are conflicting results. Ewel
(1975) reported a decrease in species diversity while James and Bogaert (1989) reported an increase in species
diversity.
Site Characterization
Brown Marsh Swamp is a forested wetland in Blajden
County, North Carolina, located southeast of the town of
Clarkton. Beginning in May 1985, sewage from the tlown of
Clarkton was introduced into one tributary to the slwamp.
Raw sewage from the town first passed through a one-celled oxidation pond which supported a dense phytoplanktcnpopulation. The sewage was then pumped to the swanjp and
distributed by rotating sprayers over an area of 0.4
hectares (Kuenzler, 1987). Within 18 months after the
introduction of sewage into this area, 98% of the tirees in
the spray field were dead due to unknown causes. Tfhere was
a clear demarcation within which the trees were kil|led(Kuenzler, 1987). The bark of the trees was peelec meters above the ground which indicates damage by
force. The trunks of these trees were constantly by effluent and a sludge blanket 0.4 meters thick
of dead algae sometimes covered part of the area ( 1987). Sewage introduction into this portion of
was discontinued late in 1987 in reaction to the triee
mortality.
The wetlands below the spray field are a floodplain
forest clearly dominated by tupelo gum (Nyssa aquatica).off 1-3 rihysical £ aturated c omposed
I^uenzler,
swamp tte
Other important species in this area are black gum sylvatica v. biflora), baldcypress (Taxodium distidhum) swamp cottonwood (Populus heterophylla), ash (Fraxinus spp.), elm (Ulmus spp.), laurel oak (Quercus laurifolla),
periodically
and red maple (Acer rubrum) (Table 1) . Brown Marshj Swamp
has characteristics of bottomland hardwood forests and
southern deepwater swamps. Portions of this swamp were
continuously flooded during the growing season whille other
parts on slightly higher ground were only
flooded. The water in this floodplain forest flows many pathways. No distinct banks or levees have
by the water flow. At times of low flooding, the v
mainly confined to many intermediate courses but at
extreme flood stages, water moves over the entirefloodplain. The total watershed of this swamp is
(Kuenzler, 1987).
(Nyssa
been
through
formed
ater is the
study Objectives
A series of permanent plots (0.10 ha.) was below the outfall of the spray field in 1985 by Drs; J. Kuenzler and Curtis Richardson (Figure 1). The field was divided into 4 0.05 ha. plots. Plots 5-1
situated downstream of the spray field along the me.
tributary. Plot 5 was located 91 meters downstream outfall. Plot 6 was located 103 meters downstream,
was located 213 meters downstream, and Plot 9 was
221 meters downstream. Measurements of the diameter
breast height (d.b.h.) of approximately 1000 tagged
commenced in order to study the preliminary effects
addition of sewage to this swamp. Measurements of
were continued on the trees in the permanent plots,
addition to the d.b.h. measurements, cores were randomly selected trees in the study area to provi method of assessing tree growth. There were two conducting this study. The first was to examine
patterns before and after the trees were exposed tc
municipal sewage, and the second was to compare patterns between trees in the upstream and
The hypothesis being examined by this study is that,
introduction into forested wetlands will not distuij-b
growth of the affected trees.
In temperate zones of the world, trees produc^
that are very straightforward to enumerate (
ta]<:en
'^ice
downstream
12
esttablished Edward
spray 0 were in
of the Plot 8 located
at trees
of the
d.b.h.
In
from another
for
reasons
growth
grcwth
plots, sewage
the
rings
boundaries
jflect ed (Schweirgrub
cf
1984) . The wood tissue forms clearly defined between wood formed early in the growing season
and wood formed late in the growing season (latewocjd
Every change in environmental conditions is re
some way in the annual ring width in trees
1984) . For example, environmental changes such as in the tree's position, light, water, temperature
ecosystem, damage to the tree's crown, and chemical in the environment will all have some measurable e
the width of the annual rings of the affected tree
changes affect the size of the cells and the
the cell walls when the tree is growing. Through examination of cores taken from an environmentally
area, the beginning and ending points of these stre be determined. This information can be valuable ir. determination of pollution events and its effects
growth rate.
(earlywood)
)
thickres
m
er,
changes the changes ^fect on
These s of
stressed
sses can
be€:n
ee.ch MATERIALS AND METHODS
D.B.H. Measurement
Measurement of the diameter at breast height
(approximately 1.37 meters above the soil) have
periodically. Only the final two measurement dates,
incorporated in this study. Each living tree in had been tagged at the beginning of the study when d.b.h. measurements were made. Trees which died
measuring periods were dropped from the study. Si
if a tagged tree could not be located again or if was missing, the tree was deleted.
The d.b.h. measurement was performed with the directly above the numbered tag. Any growths on of the tree that interfered with the path of the
removed so as to obtain the diameter just outside
bark. Trees with physical deformities that
the measurement of d.b.h. were omitted at the di
the investigator. The following characteristics
calculated from the results of the d.b.h. mea
between
iitiilarly, the tag
interf<ired
isurem(ints
Total Density - Number of trees/area of plot
Relative Density - (100)(Density for species)|total
density
d.b.h.) made
are
plot the first
the tcipe
tape
outside
were
f the with
of sciretion
'area
specae
of plot
js)/total species/total Basal Area - Cross-sectional areas of tree trunk at breast height
Dominance - Total basal area for a species/c Relative Dominance - (100)(Dominance for dominance
Frecfuency - Number of plots containing number plots
Relative Frecfuency - (100) (Frequency for spec4es)/total
frequency for all species
Importance Value - Relative Density + Relativ^
Dominance + Relative Frequency
Growth - The increase in diameter from the beginning of
the study to the end
(Mueller-Dombois and Ellenberg, 1974).
The species density of a plot in this study i4 the
number of individuals of that species per unit are^- The
frequency value for a species is the chance of fin4ing a
species in a particular area in a particular trial sample.
The advantage to these measurements is that they aij-e quick
and easy to record. However, they also have some
shortcomings for descriptive vegetation analysis,
parameters are dependent on plot size and therefor^
calculations are not considered absolute. Optimum
is also a consideration, but in this study, the
already established. The frequency value reflects
pattern of tree distribution as well as the density
individuals. It yields information about two
characteristics of vegetation (pattern and abundance) and
therefore it may confuse these two important features
(Goldsmith and Harrison, 197 6).
Additional information concerning the
is helpful for a complete understanding of the caltulat
plots
Importance
These two , these
plot size
were
the
of these
fundamental
;tigcit
The permanent plot method of vegetational analysis
many quantitative parameters, any one of which can
interpreted as important depending on the inves
Importance Value is a parameter that gives equal three relative values from the above calculations, therefore comparisons among species in a plot can lie
obtained with relative ease. One shortcoming of a
parameter is that it gives less information about
than actual parameters. For example, densely and vegetated habitats may have the same relative dens
Importance Values, but nothing is stated about speck
biomass or cover, and these are important ecologicci considerations (Mueller-Dombois and Ellenberg, 197
16 can yield be
or. The
weight to
and
relative
ͣ
\^egetation
Sparsely
ty and ies 1 )•
Random Core Sampling
Three species, tupelo gum, black gum and
were examined more closely because of their relati"\^e
tolerance (Goldsmith and Harrison, 197 6), their
throughout the swamp and their close association i environment (Goldsmith and Harrison, 1976),
was abundant as well, it was not chosen for this
because it is less tolerant of flooding (Goldsmith
Harrison, 1976) and the species could not be posit
identified.
baldcpypress
flood abilindance
iiti the Although ash
In addition to measuring the d.b.h. for the living
trees in these permanent plots, cores were taken fi'om a
random sample of trees in these plots. A simple rcindom
sample of the trees to be cored was undertaken for tworeasons. A complete sample of approximately 1000 itrees was
not logistically possible, and with fewer observations of
these sample cores, more care could be taken in obt:aining
the samples (Freese, 1978).
In selecting trees to be cored, it is necessai-y to
minimize bias. For example, the beginning of the c:oring
process during this study was aimed at only obtaini.ng cores
from trees that showed positive growth over the ent:irety of
the five year study. However, since there was a b:.as
incurred in this sampling method, it was quickly abandoned.
The adopted sampling method involved the calculation of a
minimum number of cores to be taken from each plot and
selection of the particular trees to be cored using a table
of random numbers (Freese, 1978) . The estimation Jiormula
was only used on the Nyssa aguatica trees in all vtsgetation
plots and Nvssa sylvatica var. biflora trees in Plot 9.
Because of the limited number of Nyssa sylvatica var.
biflora and Taxodium distichum in the permanent plots, all
individuals of these two species were cored.
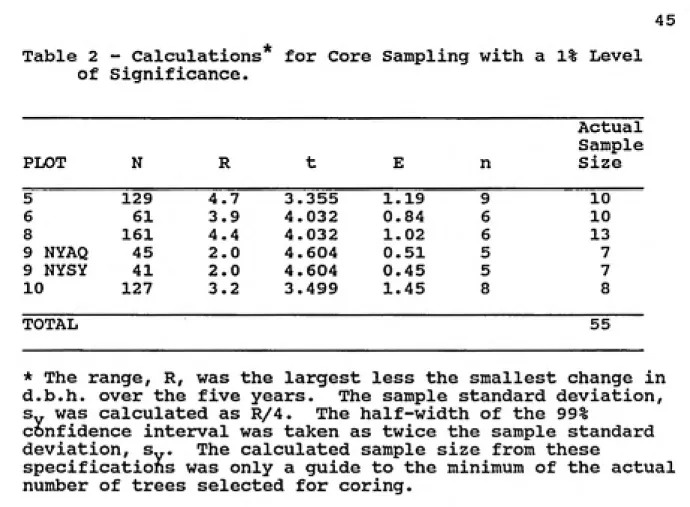
Freese (1978) gives the following formula for
estimating the sample size for a simple random sample of a
n =
-1-2
_1_N Where:
n = the number of random samples to be taken
E = the samples confidence limits; this is how clo^e the
sample estimate is to be to the population meant = percentile of t distribution with degrees of
freedom = n-1
s = population variance
N = individuals in the population
Since not all the parameters in this equation could be
gained from the collected data, some had to be estimated.
For example, the population variance could not be tkad from
the sample of trees in this study, so it was estimated by
the following formula (Freese, 1978):
s^ = (R/4)2
tr(ie
In this formula, R is the estimated range from the to the largest unit value encountered in sampling, data, this value was reported to be the largest
growth, based on d.b.h., shown by an individual
the five years of the study.
Another value that had to be estimated was
In order to use a t table, the degrees of freedom known (n - 1). Since n is the object of these ca
and n must be known to proceed in these calculat procedure is to make a reasonable guess at n and
at a value for t. A value of n is guessed at until
th<s
18
smallest From the amcbunt of
during
t value, tiave to be
ions
, the then arrive
the Iculat;
calculated values were the same or only slightly different,
When using the t tables, the 0.01 probability colunlin was
used in order to more accurately determine the numl^er of
samples needed.
To exhibit how this formula is used, the following is
an example of these calculations using data from plot 10.
n = 15 samples R =
E =
5.2 cm
1.61327 (This value was determined by calcula
standard deviation of the growth of
in this plot. Since the estimated number is to be + E units away from
and since 95% of normally distributed
usually within two standard deviat mean, this value is two standard dev
t ing the
the trees
e
t^he mean,
data is of the
ations)
ions
= 0.69
t = 2.977 for 14 degrees of freedom (15 samples)
Using these numbers, the calculated number of core^
taken from the trees is 5.5 which rounds up to 6.
changed to 10 degrees of freedom (11 samples) the
for n is 6.18 which rounds up to 7 cores to be t is changed to 7 degrees of freedom (8 samples), outcome is 7.46 which rounds up to 8 samples
guessing at the value of n, and obtaining a t valu^
corresponding degrees of freedom (n-1), it is
estimate the number of cores to be sampled from th^
permanent plots. Table 2 shows the calculated
the minimum number of Nyssa aquatica cores to be
from each plot.
value
to be When t is cbutcome
When the
, by
from the e to taken
Theirefore,
reasonabl
sam
20
The cores were taken with an incremental borei" with a
1/4 inch diameter. The boring end of the corer was; placed
perpendicular to the tree at the height of the tagJ After
the borer was removed from the tree with the core, the corewas placed in a soda straw. Both ends of the stravj^ were
stapled and a tag was attached showing the number c»f the tree, the species, and the date. A total of 77 cores were
taken from the permanent plots. The cores were treinsported
back to the University of North Carolina Wastewateip Research
Center and stored in a 4°C refrigerator.
Tree Ring Analysis
Since the rings of Nyssa acpiatica and Nyssa syivatica
wtire
.sh<jd
var. biflora are sometimes difficult to distinguislji
necessary to cut and polish the cores. Two cuts along the length of each core at approximately a 4
angle. The surfaces of these two cuts were poli
fine sandpaper. This causes fine particles of woocft
in the cells thereby making it easier to distinguish
earlywood from latewood. The growth rings were measured
under a microscope and the width (mm) of each ring or set of
rings was recorded.
Cores taken from randomly selected trees provf.de
information on tree growth in addition to the results
obtained from the changes in d.b.h.. The tree rin^ data
, it was
were examined three ways: (1) five year increments increments of the sewage-exposed years compared to following years of the study, and (3) increments sewage-exposed years compared to the previous two Change in growth between the sewage exposed years non-exposed years were compared graphically.
(2) the
the years, and the of.
m
the in1:ens;
and
an
Analysis and Interpretation of Graphs
The original set of graphs show the changes
growth assessed from d.b.h. data. Each point on
represents the mean growth (x + 1 S.E.) of each
studied species in plots 5, 6, 8, 9, and 10. The show a high degree of variance around each point
therefore, no growth patterns can be concluded froiji
graphs. The data for Nyssa aquatica is shown as(Fig. 2)
The second set of graphs (Figures 3-5) show
in growth from the core data. This change in growth
measured by three methods: (1) the mean change in
between the periods of 1986-1990 and 1981-1985, (2
change in yearly growth between the sewage-impacte(|i
(1986-1987) and the following non-impacted years (
1990), and (3) the mean change in yearly growth be
sewage-impacted years (1986-1987) and the previous
impacted years (1984-1985). Method (3) was the mofet
tree graph
ively-^raphs
these example.
tlie changes
was
growth
the mean
years
1988-:ween the
non-Figure
I
ei-ror
the thi
logical bec:au
appropriate method of assessing growth change,
uses Method (1) of assessing growth change from th^
Figure 4 uses Method (2) and Figure 5 uses Method
These graphs also show the mean and one standard
pattern of increased growth immediately downstream of the sprayfield is shown by these graphs.
The third set of graphs (Figures 6-23) show of the regression analysis. The control used in statistical study was Plot 10, which was located 2 upstream of the spray field. This plot was the comparison to the downstream experimental plots was undisturbed compared to the others. It was
the tree growth measurements had a normal
that any inherent variations found in Plot 10 would apparent in the downstream plots. Each core mea
represented on the graphs and the best fitting lin^
according to the regression equation is included
6-11 use Method (1) of assessing growth change froiji
cores. Figures 12-17 use Method (2) and Figures 18Method (3) . The general pattern of increased growtjih
immediately downstream of the sprayfield (200 m) i
the best fitting line.
asEiumed distribut:ion
22 3
cores, 3).
The (200 m)
results
s
5 m
se it that and also be
is sui'ement
Figures the
23 use
Tree Importance Values; All Trees
Vegetation analysis procedures provide a geneiral
impression of the system being studied. Brown Mar^h
is populated with a variety of bottomland hardwood At the beginning of this study, eleven tree specie
identified in the ten permanent plots. The spray
Brown Marsh Swamp, consisting of Plots 1-4, was
dominated by tupelo gum (Nyssa acfuatica) , but othe:)}:
were important in this area before the input of sewage
(Kuenzler, 1987). In 1985 at the beginning of thi^ study,
cottonwood (Populus heterophylla) and ash (Fraxinu^ sp.)
Swamp trees.
s were
::ield at
clearly trees
Jince
were also common in the spray field. However, s
approximately 98% of the trees within range of the
spray were killed during the two years of sewage iijiput
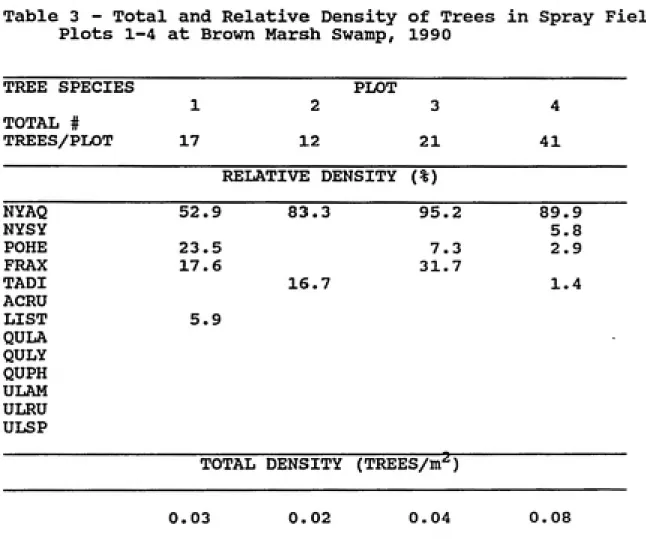
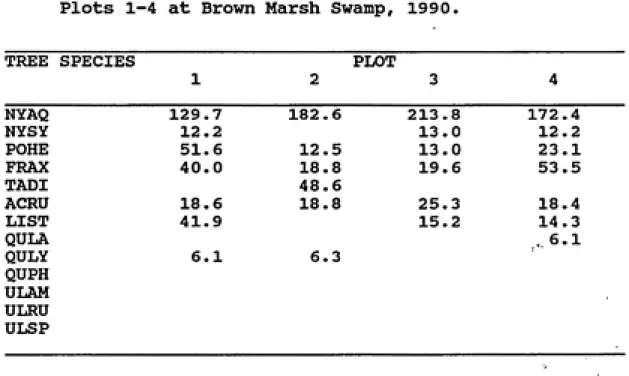
(Kuenzler, 1987) , the Importance Values and other of certain tree species have changed in Plots 1
-total density of trees in the sewage spray field
0.02 trees/m^ in Plot 2 to 0.08 trees/m^ in Plot 4
3). Importance Values for the species in the spray
also show the samo general pattern (Table 4). Tup
(Nyssa aquatica) consistently had the highest
Values in all plots with values ranging from 129.7
sewage
ranged
parameters
The from (Table
field
lo gum
Importance
24
to 213.8 in Plot 3 (Table 4). Other species that tad high
Importance Values in the spray field were cottonwocid
(Populus heterophvlla). ash (Fraxinus sp.) and balqcypress
(Taxodium distichum).
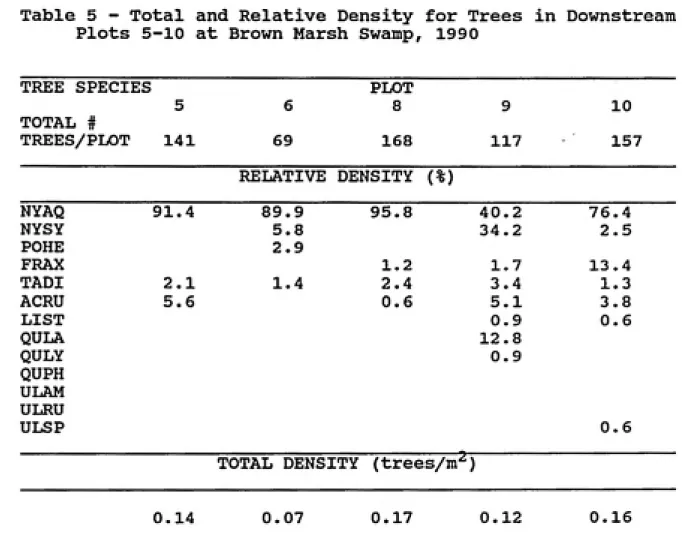
Downstream of the spray field five permanent jj)lots were
established along the main channel through Brown Me.rsh
Swamp. Plots 5, 6, 8 and 9 were dominated by tupe].o gum
(Table 5) . Since Nvssa acpiatica was not identified in plot
7, and since this plot seemed to be more characteristic of
an upland area, this plot was omitted from study. Total
tree densities in the four downstream plots ranged from 0.07
trees/m^ in Plot 6 to 0.17 trees/m^ in Plot 8 (Tab].e 5)
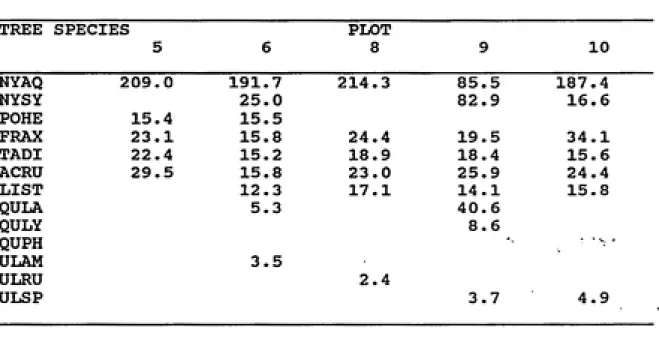
Nyssa acfuatica again consistently had the highest ]:mportance
Values, ranging from 85.5 in Plot 9 to 214.3 in Plot 8
(Table 6) . Black gum (Nvssa sylvatica var. biflorci) and
baldcypress (Taxodium distichum) were more apparent in the
downstream plots than in the spray field plots. In Plot 9,
the extreme downstream station, Nyssa sylvatica vai:. biflora
had an Importance Value approximately equal to Nys»a
aquatlca (82.9). This plot was located on slightly higher
ground than the other plots, which may have had an effect on
the species composition of this plot. Other speci<is that
were important in the downstream plots were red ma]3le (Acer
rubrum), cottonwood and ash.
As in the other plots used in this study. Plot 10 Was dominated by Nyssa aquatica. having an Importance
187.4 (Table 6). Other important trees in this Acer rubrum^ Fraxinus, and Nyssa sylvatica var. bi
plot
value of
were
ora.
j:l<
analy
becciuse Sewage Impacts on Tree Growth
The d.b.h. and tree ring measurements were
deteirmine if sewage inputs affected the growth of dominant species. Plots 1-4 were included in the graphs using the d.b.h. growth data. In addition, were taken from the spray field because of the ser
disturbance to this part of the study area and
many trees were killed in the spray field.
The figures used to represent the study area 10 305 meters downstream of the spray field. The
study of Brown Marsh Swamp (Kuenzler, 1987), i
the water nearly returned to normal conditions
the spray field at this distance downstream. In
make the comparisons easier. Plot 10 was graphed 3
downstream.
Preliminary graphs were constructed using the
diameter growths from each downstream plot and the
plot for each species. Graphs were also constructed
the mean basal area change for each species in all
compare these two measurements of growth. The gra^h
zed to the three initial
no cores
4.0US
so
indicated found
Eshow Plot
previous
that above
to 05 meters oirder
mean
upstream using plots to
each
::e classes measjurements. d.b.h. mean plus or minus the standard error for
is shown in Figure 2 as compared to the control, no significant difference in the growth of trees iiti
plots.
Differences in growth among Nyssa aguatica si were examined by regression analysis of d.b.h.
distance downstream was the independent variable aitid the
change in growth from 1986-1990 according to size ctlasses
was the dependent variable. The graphs and R^ valikes
indicate no significant change in growth with increasing
distance downstream.
Data were also examined showing the mean chande
growth between sewage-influenced and non-influenced based on core samples. This change in growth wasby (1) the mean change in growth between the perio(|
1986-1990 and 1981-1985 (Figure 3), (2) the meanyearly growth between the sewage impacted years (1^
and the following non-impacted years (1988-1990)
and (3) the mean change in yearly growth between
impacted years (1986-1987) and the previous non-impacted years (1984-1985) (Figure 5). Positive values for the
points on these graphs indicate a positive influenc|;e of
sewage on tree growth. The comparison between the 5-year
growth increments (Figure 3) indicated that growth decreased as distance downstream increased. This was repeated in the
other graphs produced by the alternate methods of growth
the
26
plot here was
these
m
years itieasured
s of in
86-1987)
(|"igure 4) ,
comparison. However, this graphical method showed much
variation in the data and stronger statistical analyses were
needed.
A two-factor ANOVA was performed on the d.b.h. data and
the core data using Method 3 of assessing growth change. The purpose for this analysis was to determine if iiean growth changes of the three dominant species (tupe].o gum, black gum, baldcypress) differed between the permanent
plots. The effects of the tree species and plot number were assigned individually and in combination in order t:o
determine the effects, if any, on tree growth. Upon
examination of the ANOVA table (Table 7), it was found that the interaction term (TREE*PLOT) showed significance
(p=0.001) for the model using the d.b.h. data. Th;.s means
that there was a significant interaction between the tree
species and the different plots. The terms TREE and PLOT
also show significant differences (p=0.001) in this model.
However, because the interaction term showed signiJ'icance, these terms alone do not permit conclusions concerning the growth of these trees. The ANOVA model using Method 3 of
assessing growth change in the core data shows significance
in the PLOT term (p=0.02) which indicates the grow1:h of trees is different among plots. The third ANOVA model on Table 7 was constructed including only the distances
downstream as a function of tree growth. Tree species was
was shown with the second model. This analysis
the high F-ratio, that the growth of the trees
varied significantly (p=0.001).
Because the ANOVA did not fully utilize the and to analyze the growth data by species, least
regressions were performed on the three methods of
mean growth differences. The results of the ANOVA
that the trees were growing at different rates and
regression analysis on each species would show the
differences. The independent variable used was
downstream and the dependent variable was change iiji
Since Plot 10 was placed at 305 meters downstream,
regression calculations were performed including
excluding Plot 10 to determine the effects, if any
regression. For the 5 year incremental mean chang^
growth (Method 1), Nyssa sylvatica var. biflora
highest degree of growth change due to sewage inpulj.
(Figure 6) and without (Figure 7) Plot 10 in the However, the regression of Nyssa sylvatica var. bi
included only three distances downstream while
28
shctwed, from
among plots
information
styuares comparing
indicated
distance growth, the and
thi
distichum and Nyssa aquatica had 5 distances and
contribute to the increased correlation. The R'^
0.55 with Plot 10 (Figure 6) and 0.48 without Plot
(Figure 7) show much variation in the data; the
not fit the regression line very well. The regres^
Taxodium distichum (Figures 8,9) and Nyssa aquaticcion the s in
the s with
ssion.
ora
showed
r€igre 11
Taxodium
s may of
10
s do ions of
(Figures Vcilues
10,11) including or excluding Plot 10 showed littlfs
measurable change in growth with increasing distanc:e
downstream. However, the models which include Plof 10 show
higher R" values. Both models show the pattern of increased
growth of the trees near the spray field.
The regression of the difference in average yearly
growth using 1986-1987 as the sewage-impacted yearsi and
1988-1990 as the non-impacted years (Method 2) yiel.ded similar results as above. Nyssa svlvatica var. biJ'lora
showed the strongest correlation between a tree-ring widths
and the distance downstream including (Figure 12) and
excluding (Figure 13) Plot 10. The R^ values for
regressions of Nyssa sylvatica var. biflora growth including
and excluding Plot 10 were 0.69 (Figure 12) and 0.72 (Figure
13) respectively. Taxodium distichum (Figures 14-:.5) and
Nyssa aguatica (Figures 16-17) showed the same trend of
decreasing growth with increasing distance downstream
including and excluding Plot 10. Unfortunately, the R'^
values were very low.
A third regression of the core data used the difference
in average yearly growth with 1986-1987 as the
sewage-impacted years and 1984-1985 as the non-sewage-impacted y<;ars.
This approach avoids any after-effects of nutrient:; trapped
in the soil. Once again, Nyssa sylvatica var. bifJLora
showed the strongest correlation for a positive imjaact of
30 The largest increase in growth occurred in the plots closest
to the spray field. The R^ values for the regression with
and without Plot 10 are 0.48 (Figure 18) and 0.29 (Figure
19), respectively. Taxodium distichum also showed improved
correlation over prior methods using this method. The R"
values increased slightly for regression with (Figi^re 20)
and without (Figure 21) Plot 10 to 0.23 and 0.19,
respectively. Nyssa aquatica regression in this mdinner
showed the trend of decreasing growth with increasing
distance downstream including (Figure 22) and excluding
(Figure 23) Plot 10, but the R^ values remained lovr.
tr(ies Summary of Results
The ANOVA models showed that the growth of
significantly among the different plots. The patt established from the regression analysis show the growth of these trees with the addition of sewage trees closer to the input of sewage showed higher
rates during the impacted than during the non-im
periods than the trees farther downstream. The analysis showed significance for many of the black
figures. Although other figures show no signifi
in growth, the patterns established by regression
combination with the significant change in growth ]
plots (Table 7) suggest significant changes in
growthvaried
^rns
change in The
growth
time sion
gum
changes
:Ln
] between
among pacted
regres£
the trees in the plots immediately downstream of tljie
DISCUSSION
Sewage Impacts on the Growth of Flood-Tolerant Tretis
The graphs of the change in tree diameter durz.ng the five years of this study yielded little information
concerning the effects of municipal sewage on the growth of
tupelo gum, black gum, and baldcypress. For each sipecies,
the variation shown by the standard errors above and below
the mean are great and deducing any change in growl:h between
the different plots is difficult. In addition, no pattern of decreasing growth was seen by examining the mean growths of each species in the downstream plots.
The reason why growth changes are not apparent from the
preliminary graphs of tree growth based on d.b.h.
measurement may be attributed to several factors. Human
error in measuring the trees is a possible source of error.
Measurements of d.b.h. were made by several different
persons during the course of this study, many with no prior
experience. Although these mature hardwoods are rciplenished
with sufficient nutrients and water throughout the growingseason, they do not grow very fast. Trees have different
growth rates from year to year as the environmental
conditions other than nutrient inputs change and tliese
different growth rates are inherent in each tree. Since the
in growth since sewage loading began, and the trees; have
undergone variations in growth during their entire lifespan,
the recent variations may have been hidden by previous
variations. Therefore, measuring the change in diameter of
these trees may not yield accurate results over sucph a
comparatively short time period.
Other physical or chemical factors due to the presence
of sewage in this swamp may have countered the eff(ict of
increased nutrients. The extended hydroperiod of 1:his
system due to the addition of sewage water may hav<i caused
anoxic conditions which would make the assimilation of
nutrients by plants more difficult (Mitsch and Gosiselink,
1986). The most productive forested wetlands are i;hose that
fluctuate between wet and dry conditions (Ewel, 197 5, Ewel
and Odum, 1978, Odum, 1984, Mitsch and Gosselink, 1986).
Because this swamp would remain wet at sites below the
outfall due to the input of sewage, there would be no
fluctuating environmental conditions and the effects of
increased nutrients to the system may have been eliminated.
The cores taken from randomly selected trees tend to
eliminate some of the previous variations in tree growth
because the specific years in question can be distinguished
and measured. This more precise method of measuri
is shown in the basic graphs of the core data (Figures 3-5)
Increased growth during the sewage-impacted period
associated with a positive point on these graphs.
ng growth
IS
34
increased growth can be interpreted as a positive ;.nfluence
of sewage on the trees. As would be expected, the mean
changes in growth for Plot 10, the control plot, are very
close to zero which indicates no net positive or n(jgative
effects acting on the trees. Although there is much
variation in the data, all three measurements of girowth
change indicate an increase in growth as a result of sewage
addition to this swamp. The 5-year changes in growth
(Figure 3) shows the most variation while the grow:h change
using 1986-1987 as the sewage impacted years and 1!384-1985
(pre-sewage) as the non-impacted years (Figure 5) ishowed the
least variation. The latter method also showed leiss
variation than the method using 1986-1987 as the sewage
impacted years and 1988-1990 (post-sewage) as the
ion-impacted years (Figure 4). Therefore, based on ths data
represented by these figures, the pattern of increased
growth as a result of sewage addition is implied, out not
proven.
The two-factor ANOVA performed on the d.b.h. and core
data was undertaken for two reasons. The first was to
determine differences in the growth rates of the ttiree
dominant species. The second reason was to assess
differences in the growth of trees with respect to the
different plots. The first model (Table 7) shows
there is significant interaction between the tree and the plots. It is not only the tree species or
number which is affecting the growth of these tree combination of these two factors. The significance TREE term suggests that different tree species are
at different rates and therefore should be examined individually by regression analysis Another reason proceeding with the regression analysis was the si
interaction term in the first model (Table 7). A
reason was the ANOVA was very unbalanced. The
trees for each species represented in the model from equal. Although this does not invalidate the the species comparisons are weakened.
The regression calculations for the core data same general pattern shown by the core graphs,
decrease in tree growth as the distance downstream increased. Nyssa sylvatica var. biflora consi the highest correlation and the largest change in between the impacted and the non-impacted time
the three methods of assessing growth change. Witji
exceptions, both Taxodium distichum and Nyssa a
species
the plot s, but a
of the
number
were
periods
iquat
showed
growth for few ica also
showed a decrease in growth change between the impacted and
non-impacted periods as the distance downstream increased,
However, the agreement between the best-fitting line and the
data points was generally poor and the slopes of tbe lines
were shallow. One reason for the poor fit and correlation
growing
for gnificant
third of far ANOVA,
show the namely a
36
of the data to the equation is the variance in the data.
Another reason for the poor fit may be the number of
permanent plots downstream of the spray field. Since there
were only five plots (including Plot 10) below the spray
field, the regression had only five distances with which to
work. Combined with so few plots was a substantia!, degree
of variation around them. More plots, and more sanples
immediately downstream of the spray field may have produced
a higher correlation between the change in growth and the
distance downstream and consequently a better stat;Lstical
fit. However, since there was a high degree of va::iation in
these plots, it is likely that additional plots would show
variation as well, and therefore the regression analysis
would not be improved.This effect of distance downstream on growth pecomes
more important when combined with the results from the ANOVA
models. The graphs from the regression analysis sliow the
general trend of a decrease in the change of growti between
the sewage impacted and non-impacted years as the distance
downstream increased. The results from the ANOVA show that
there was a significant change in growth between the plots.
Therefore, it can be concluded from these two pieces of
evidence that the sewage input into this swamp had
positive effect on the surviving trees immediately
other Important Considerations in Brown Marsh Swaitp
The tributaries that flow into Brown Marsh Svamp are in
a constant state of flux. The map published by Richardson
(1988) shows the main tributaries as they appeared in 1985.
Although the permanent plots were established on a( main
tributary, other water sources flow through these plots.
The unknown hydrology of some portions of the swaitp may have
an effect on the growth of certain areas. Plot 8
consistently showed unusually high growth in comparison to
the other downstream plots and this may be due to other
tributaries flowing into this plot. Additional tributaries
that flow through some plots but not others may have
countered some negative effects of the sewage introduction,
such as anoxia.
The relative elevation of the permanent plots in Brown
Marsh Swamp may also have an effect on the growth of trees
and species composition after the addition of sewage. There
are shallow waterways where the water is confined during
periods of low water, whereas in other places surface water
drains completely off. Moderately wet areas are generally
the most productive in these wetlands (Ewel and Odum, 1978,
Mitsch and Gosselink, 1986). Therefore, the plots
downstream of the spray field meeting these moderately wet
conditions will be the most productive while areas that are
too wet or too dry will be less productive. The elevation
sewage into this swamp. Plots of varying elevatiom
affected to a certain degree by the sewage,
their height relative to the rest of the swamp.
may have influenced the unusually high growth of Plot
comparison to the other downstream plots.
depending
This
Ewel 19i
leld Brown Marsh Swamp Used in Sewage Treatment
Clarkton sewage has been diverted from the section
containing the permanent vegetation plots to anoth|er
tributary of Brown Marsh Swamp for disposal. Many have reported the effectiveness of swamps in the to further treat municipal sewage (Ewel, 1975,Odum, 1978, Brinson, 1985, Mitsch and Gosselink,
Guntenspergen et_al., 1989). Although trees died spray field, the area downstream of the spray fi few ill effects from the introduction of sewage, trees grew faster, apparently in response to the nutrients. Richardson (1988) reported that the for nutrient removal by the sediments was great
(1987) reported that the water returned to nearly
conditions a short distance below (305 m) the spra|y
Therefore, it is reasonable to conclude that this swampfunctioned effectively in the tertiary treatment of
wastewater
38
will be
upon also 8 in
authors Southeast
and
86,
in the suffered These
ilncrease m
ial Kuenzler normal
The problems encountered in using the spray fiold at
Brown Marsh Swamp arose from the method of sewage
introduction into the swamp. The sewage spray apparently
did physical damage to the trees in the immediate vicinity,
eventually killing them. Layers of sludge and constant
wetness of the tree trunks in the spray field may have been
harmful as well (Kuenzler, 1987). Wetlands in the Southeast
should be used for the treatment of municipal wastewater
only if the stress to the swamp does not disturb these
ecosystems. The damage done to the spray field was severe
and irreversible. Although no damage is apparent to
portions of Brown Marsh Swamp further downstream, <ividence
of damage within the spray field may surface in the future.
Effects to the swamp with the introduction of sewa(je should
be a primary concern to those who are planning to use the
nutrient removal capabilities of forested wetlands so that
CONCLUSIONS
1. TREE GROWTH - The trees immediately downstream of the
sewage input (200 meters) showed an increase in growth
during sewage loading as compared to the control
compared to growth previous to the sewage input.
plot and
2. SEWAGE EFFECTS ON BROWN MARSH SWAMP - The swa|np
downstream of the spray field functioned norma
cessation of sewage input. The trees appeared
normally at the last sampling period.
illy to
system after the
be growing
3. SEWAGE EFFECTS ON TREE SPECIES - Black gum fNvssa
sylvatica var. biflora) showed the greatest incr(2ase in
growth due to sewage loading. Tupelo gum (Nyssa
and baldcypress (Taxodium distichum) showed litt
change due to sewage loading.
aquatica)
e growth
4. DATA TYPES - Assessing growth changes in trees using tree
cores provides more accurate results than using changes in
d.b.h.. cores are more difficult to remove from trees and
more time consuming to interpret. The relative ease of
measuring the change in d.b.h. is ideal for large numbers of
The following recoinmendations are proposed for future
research in the area of sewage impacts on swamps in the
Southeast and, in particular, trees that are specific to
forested wetlands:
1. EFFECTS OF SEWAGE ON TREES - The effects of municipal and
other types of sewage on bottomland hardwood trees should
continue to be studied on longer time scales. This would
enable scientists to determine any long-term positive or
negative effects on the trees in these systems. In addition
to studying the effects of sewage on flood-tolerant trees,
studies undertaken to determine the effects on upland trees
should proceed. Tree species that have commercial value may
benefit from nutrient inputs such as municipal sewage.
These high nutrient loads may be helpful in the
re-establishment of forests that have been logged.
2. SEWAGE INTRODUCTION INTO SWAMPS - The effects of sewage
on the entire swamp ecosystem are poorly understood because
this method of sewage treatment has not been studied long.
Therefore, more information is needed to determine whether
this method of sewage treatment is helpful or harmful to
wetlands. In addition, new methods of introducing municipal
42
such as occurred at Brown Marsh Swamp. Sewage distribution
designs should concentrate on maximizing the swamp's
nutrient removal potential while creating the least
disturbance to the system.
3. STUDY DESIGNS - The design of the study at Brown Marsh
Swamp could be improved by a greater number and different
location of permanent vegetation plots. Preliminary studies
to determine the hydrology of the forested wetland would aid
in the positioning of the plots in the direct flow of the
sewage with as litle outside influence from other
disturbances as possible. This would help in eliminating
some of the variation in tree growth. Additional plots
downstream of the spray field may have helped in the
statistical analyses, although variation in the data would
still be present. The regressions of the data may have been
more conclusive if additional points were provided for the
model. Research should also be conducted on the fate of
nutrients as the move through swamps. Distance downstream
is only a proxy for the nutrient concentration in the root
zone of soils below a sewage outfall. An effective method
of assessing nutrient change in swamp systems is needed to
4. ANALYSIS OF TREE GROWTH - The measurement of tree growth
change as a result of sewage introduction into a swamp
should be studied without the limitations of permanent
plots. Cores and d.b.h. measurements should be taken at