ACKNOWLEDGEMENTS
I would like to thank Dr. Edward J. Kuenzler for his
Gross uptake rates of filterable reactive phosphorus
were measured in surface waters of B. Everett Jordan Lake
from December 1983 to January 1985. In conjunction,
laboratory experiments examining the phosphorus adsorption/desorption potential of suspended sediments and bioavailability of suspended sediment-bound phosphorus were performed on suspended sediments obtained from the Haw River, the major tributary of Jordan Lake, during five periods of high flow from January 1985 to May 1985.
Phosphorus uptake rates were highly variable, ranging from 0.007 to 9.78 ug P 1"! h"^. The highest uptake rates
were measured during the warm months in the New Hope Creek basin of the lake when filterable reactive phosphorus concentrations were low and algal biomass high, which when combined with high nitrogen to phosphorus ratios, indicate conditions of potential phosphorus limitation. Lower uptake rates were measured throughout the study in the Haw River basin of the lake and during the winter months in the New Hope Creek basin. Biotic uptake, which comprised most of the uptake during the warm months, was dominated by uptake in the small size fraction (< 8.0 um). Abiotic uptake often comprised the majority of the total uptake in the winter months. Sampling sites near tributary inputs, especially in the Haw River arm, had the highest rates of abiotic uptake due to large inputs of suspended sediments during periods of
Sorption isotherms of suspended sediments obtained from the Haw River exhibited equilibrium phosphorus concentrations significantly below ambient stream filterable reactive phosphorus concentrations, indicating that the sediments were likely acting as a sink for soluble phosphorus present in the stream. Algae grown with suspended sediment-bound phosphorus under conditions otherwise optimal for growth were able to utilize a relatively small amount (mean = ll .Ssi) of the sediment-bound phosphorus. Potential impacts of these results on lake
PAGE
ACKNOWLEDGEMENTS... ii
ABSTRACT... ill LIST OF FIGURES... vii
LIST OF TABLES...vill INTRODUCTION... 1
Phosphorus Cycling in the Epillmnion... 1
Phosphorus Uptake Kinetics... 3
Suspended Sediment-Phosphorus Dynamics... 5
Bioavailability of Sediment-Bound Phosphorus... 8
METHODS... 12
Lake Sampling and Measurements... 12
Phosphate Uptake... 14
Nutrient Analyses-Lake Water... 17
Stream Sampling and Sample Processing... 18
Nutrient Analyses-Stream Water... 19
Desorption-Adsorption Characteritics of Suspended Sediments... 20
Bioavailabllty of Sediment-Bound Phosphorus... 21
RESULTS... 24
Physical Characteristics of Lake Water... 24
Chlorophyll-a Distribution... 26
Phosphorus Distributons... 28
FRP Uptake Coefficients and Turnover Times... 31
Gross Abiotic and Biotic Uptake Rates... 34
Net Phosphorus Uptake, Vertical Profiles, and Effect of Substrate Concentration... 37
Physical and Chemical Characteristics of Stream Water... 42
Sorption of Phosphorus by Suspended Sediments.... 44
Bioavailabllty of Sediment-Bound Phosphorus... 48
DISCUSSION... 52
Phosphorus Distribution and Algal Blomass... 52
N:P Ratios... 54
Algal va Bacterial Phosphorus Uptake... 5&
Analysis of Separation of Algal and Bacterial
Uptake... 56
Suspended Sediment-Phosphorus Sorption Capacity.. 59 Algal Utilization of Sediment-Bound Phosphorus... &4
Management Implications of Sediment Study
Results... 65
CONCLUSIONS... 69
LIST OF FIGURES
PAGE
Fig. 1. Map of Jordan Lake and the Haw River below Bynum, NC showing locations of sampling
stations... 13
Fig. 2. Temperature distribution in the surface waters
of Jordan Lake... 24
Fig. 3. Distribution of the IX light level in Jordan
Lake... 26 Fig. 4. Chlorophyll-a distributions in the surface
waters of Jordan Lake... 27
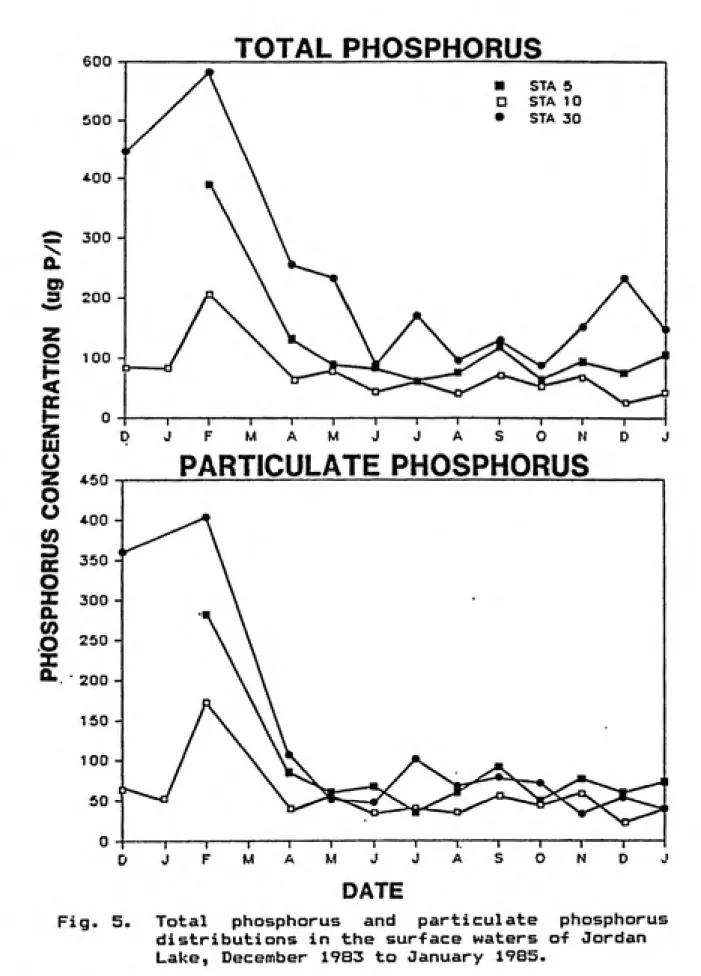
Fig. 5. Total phosphorus and particulate phosphorus
distributions in the surface waters of Jordan
Lake... 29
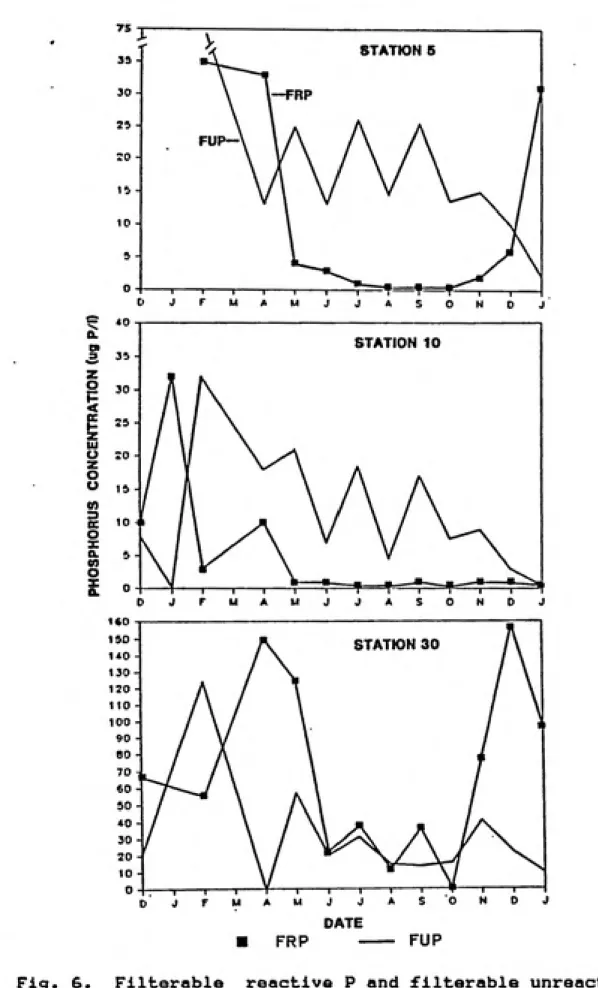
Fig. 6. Filterable reactive P and filterable unreactive
P distributions in the surface waters of Jordan
Lake... 30
Fig. 7. Filterable reactive phosphorus turnover times
in surface waters of Jordan Lake... 33
Fig. S. Total and partitioned gross uptake rates in
surface waters of Jordan Lake... 35
Fig. 9. Relative contribution of abiotic, 0.45-8.0 urn
biotic, and 8.0 urn biotic fractions to total
phosphate uptake in surface waters of Jordan
Lake... 36
Fig. 10. Phosphate sorption isotherms of suspended
sediment from the Haw River at Bynum, NC... 45
Fig. 11. Examples of growth curves of Selenastrum
S§££i52i:Qy1^y!S grown with sediment and
orthophosphate... 50
Fig. 12. Distribution of DIN:DIP ratios in surface
LIST OF TABLES
PAGE
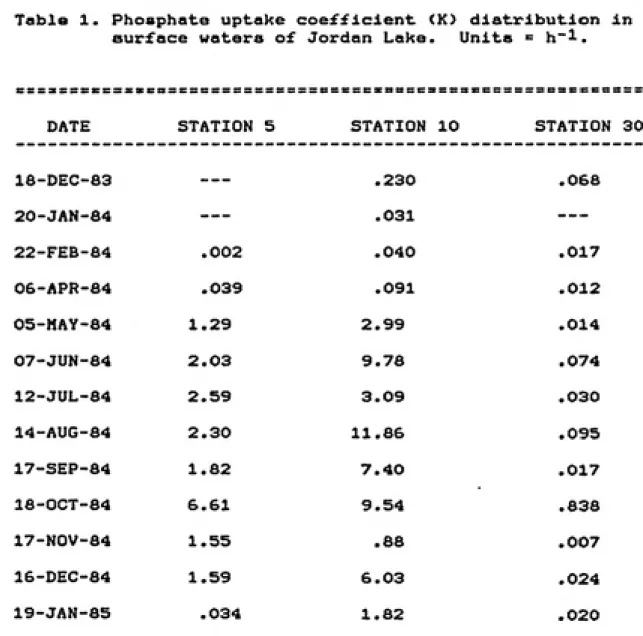
Table 1. Phosphate uptake coefficient distribution in
surface waters of Jordan Lake...32
Table 2. Effects of antibiotics and size fractionation
on biotic uptake coefficients at Station lO
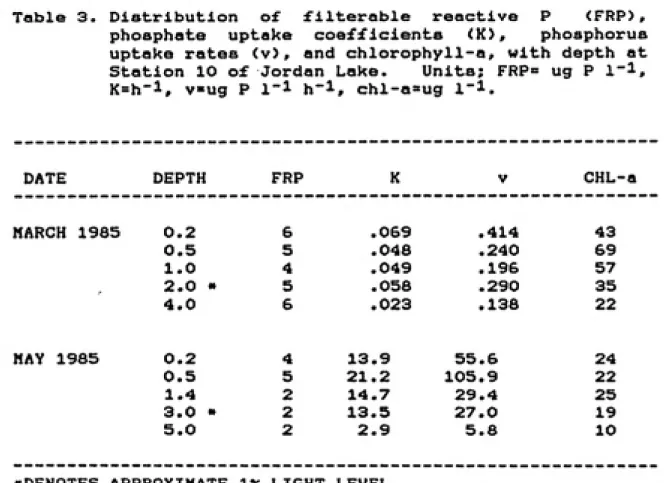
of Jordan Lake... 38 Table 3. Distribution of filterable reactive P,
phosphate uptake coefficients, phosphate uptake rates and chlorophyll-a, with depth at Station
10 of Jordan Lake... 39
Table 4. Change of filterable reactive phosphorus
concentrations during incubation of Jordan Lake
water... 41 Table 5. Temperature , instantaneous stream flow , total
and total nonfilterable residue, and % loss on ignition of sediment slurry of samples from the
Haw River at Bynum, NC, 1985... 43
Table 6. Total P, total filterable P, filterable
reactive P, and particulate P of water samples
from the Haw River at Bynum, NC, 1985... 43
Table 7. Stream and estimated lake filterable reactive phosphorus concentration, equilibrium phosphate concentration, instantaneous sorption capacity, and net potential sorption capacity of samples
from the Haw River at Bynum, NC... 46 Table 8. Blomass produced with equal amounts of sediment
and soluble phosphorus, percent sediment P bioavailable, and percent P removed via NaOH
extraction...49
Table 9. Regression analysis of particulate
P-chlorophyll relationship for surface waters of Jordan Lake from April 1984 to January 1985,
Phosphorus is generally considered to be the most important factor in the maintenance of biological cycles in freshwater systems (Schlndler 1977). In comparison to other essential nutrients, phosphorus is present in relatively small amounts and usually limits the system's productivity (Wetzel 1983). Increased loadings of phosphorus into lakes and rivers often accelerates the natural evolutionary processes, prematurely creating eutrophic conditions and associated poor water quality. Understanding of the dynamics of phosphorus in these systems is important if we hope to develop effective strategies for their management.
PHOSPHORUS CYCLING IN THE EPILIMNION
Most models of phosphorus-microorganism (phytoplankton, bacteria, zooplankton) interactions confine themselves to epillmnetic waters, where steady-state conditions are assumed to exist, at least for short time periods. In reality, steady-state conditions are rarely found, however, since the cycling of phosphorus within the epillmnion is usually rapid relative to its movement through the epillmnion, the steady-state assumption does not greatly
hinder interpretation (Rigler 1973).
phosphorus. Observation of uptake kinetics often not
consistent with the two-compartment model lead to the development of a four-compartment model by Lean (1973), consisting of particulate phosphorus, orthophosphate, a low molecular weight organic phosphorus compound (XP>, and a high molecular weight colloidal phosphorus compound. He
proposed that the majority of the exchange occurs directly
between particulate phosphorus and orthophosphate, but that a compound termed XP Is also excreted which rapidly
complexes with the large colloidal phosphorus compound,
releasing small amounts of orthophosphate. During periods
of phosphate deficiency phytoplankton and bacteria can develop phosphatase enzymes that allow for the utilization
of dissolved organic phosphorus compounds which are
analogous to the XP fraction (Kuenzler and Perras 1965;
Paerl and Downes 1978).
Physiological adaptions of microorganisms to low
ambient concentrations of phosphorus in the water column add
complexity to the phosphorus cycle. Many phytoplankton have
the ability to take up phosphorus in excess of their
metabolic needs and store it within the cell as
polyphosphate (Perry 1976). Low concentrations of
phosphorus in the water may lead to assumptions of
phosphorus limitation when, in reality, the algae may have
sufficient stores of polyphosphate for significant
additional growth. Lean et al. (1983) suggested that
despite ambient nutrient concentrations that clearly
Indicated phosphorus limitation.
Fractionation of blotlc phosphorus uptake In freshwater lakes generally Indicate that the bacterial fraction, which,
may also Include nannoplankton If separation of blotlc
uptake Is done by size fractionation (Lean 1984), dominates uptake (Rlgler 1956; Berman and Stiller 1977; Kuenzler and
Greer I960: Currle and Kalff 19d4a>. Laboratory work by Rhee <1972> and Currle and Kalff <1984b> support bacterial
superiority In competition for phosphorus, but Fuhs et al. (1972) found evidence Indicating phytoplankton should
outcompete bacteria at phosphorus concentrations typically found In nature. Field studies by Faust and Correll (1976),
Kuenzler and Greer (1980) and Lean (1984) found bacterial
domination of uptake for the majority of the year, although during periods of high algal blomass the relative fraction
of algal uptake significantly Increased.
Phosphorus regeneration by zooplankton can be an Important mechanism In the phosphorus cycle, especially when ambient phosphate concentrations are low (Lehman 1980; Rlgler 1973). Rlgler (1973) estimated that direct release
of phosphorus from ultraplankton and zooplankton excretion were equally Important.
PHOSPHORUS UPTAKE KINETICS
The application of static measurements of phosphorus
phoaphorua atom many timea before it is leaves the system, is relatively limited. Periods of maximum biotic activity often correspond with periods of low phosphorus concentrations that should, if recycling is ignored, limit further biological activity. However, the continuation of biotic activity during these periods emphasizes the importance of knowledge of the flux of phosphorus through the system. Interpretations of static measurements are also hindered by the use of operationally defined phosphorus
fractions that are often not accurate measurements of the
forms of phosphorus that are actively being cycled (Kuenzler and Ketchum 1962; Rigler 1966). Consequently, studies emphasizing flux rates and pathways of phosphorus,
in addition to measurements of concentrations, have evolved (Hutchinson and Bowen 1947; Rigler 1956).
Rates of phosphorus uptake are most often obtained
using the techniques of Rigler <1956>, which measure the
rate of disappearance of radioactive phosphate (32p) added
to water samples in amounts small enough not to affect the assumption of ateady-state. This technique measures gross rates of phosphorus uptake. Net uptake should be zero if steady-state conditions exist.
The rate of phoaphorua uptake by micro-organiams is
affected by many factors including: nutritional status (Fuhs
(Nalewa3ko et al. 19dl>; pH (Healey 1973); cell size (Fuhs 9% si.- 1972); temperature (Kuenzler St s^. 1979); diurnal cycle (Richey gfc al. 1975; Currie and Kalff 1984b>; and phosphate concentration (Fuhs et al. 1972; Halmann and Stiller 1974; Kuenzler et al. 1979). Nalewa^ko and Lean (1980) provide an extensive review of factors affecting phosphorus uptake kinetics and algal growth.
Distinct seasonal variation of phosphorus uptake has often been observed. During the winter months when algal and bacterial biomass and metabolic activity decrease, and phosphorus concentrations increase, phosphorus uptake rates are usually low (Halmann and Stiller 1974; Faust and Correll 1976; Kuenzler and Greer 1980). In summer months, rapid turnover times (1-8 minutes) are encountered in most lakes, apparently irrespective of trophic state (Rigler 1973). Algal blooms in the summer (Faust and Correll 1976> and the winter (Kuenzler gt g^. 1979) have been shown to greatly
increase uptake rates.
SUSPENDED SEDIMENT-PHOSPHORUS DYNAMICS
The input of suspended sediments often has been implicated as being important to the phosphorus cycle of lakes (Hutchinson 1941; Kuenzler and Greer 1980; Jones and Redfield 1984), especially when the sediments are fine clays
which generally have high phosphorus binding capacities and
long retention times in the water column (Golterman 1973;
Syers §t al 1973). Piedmont rivers and lakes are subject to
during heavy precipitation events. The soils of these
watersheds consist primarily of fine clays (Daniels et al.
1984) which can remain suspended in the water column for long periods of time (Williams et al. 1980). However, the relatively small amount of research which has been conducted on the biological and chemical effects of the addition of
sediment into lakes and rivers has resulted in low levels of
understanding and consequently* hindered water resource
management (Ongley et al. 1982).
The phosphorus desorption/adsorption capacity of suspended sediments, hereafter refered to simply as sorption capacity, must be understood to achieve an adequate
understanding of the phosphorus cycle (Syers fi:^ al,. 1973) .
Numerous studies have demonstrated the Importance of sorption reactions between phosphorus and bottom sediments (Olsen 1964, Pomeroy et a^. 1965, Harter 1968, Meyer 1979,
Klotz 1985) and, while much fewer in number, the importance
of suspended sediment-phosphorus exchange reactions in
rivers (Taylor and Kunishi 1971; Green et al. 197d>, in
lakes (Kuenzler and Greer 1980), and in estuaries (Carrltt
and Goodgal 1954).
While most studies have found that the sediments act as
a sink for phosphate (Syers et al. 1973), the high
complexity of the sorption reaction combined with the large
variability found within and between aquatic systems often
make generalizations concerning the sediment's role
difficult. The sorption mechanism is a function primarily
for the same reactive sites, temperature, organic substances, retention time, and particle size (Beek and
vanRiemsdijk 1982>.
The factors controlling the chemical reactions of phosphate ions with clay mineral surfaces are not well understood, especially with naturally occurring clays (Beek
and vanRiemsdijk 19d2>. Reactions are clearly associated
with the presence of aluminum hydroxides and iron oxides near the clay surface (Chen et al. 1973a; Edzwald et al.
1976), and are not necessarily based upon simple exchanges
of the phosphate ion for the hydroxide ion bound to the aluminum and iron complexes of the clay surface, as has often been suggested (Golterman 1973>. Phosphate adsorption isotherms, which relate the amount of phosphate adsorbed per gram dry matter to the concentration of phosphate in the water (Olsen 1964), are often constructed in attempts to evaluate the sorption mechanisms. These have shown the
uptake of phosphate by the clay particles to be biphasic,
consisting of a rapid initial adsorption of the phosphate
onto the reactive sites of the clay followed by a much
slower phase involving the formation of new solid phases
(Carritt and Goodgal 1954; Pomeroy et al. 19&5; Chen et al.
1973b; Edzwald et al« 1976). The initial adsorption step is
usually complete within 12 hours (Edzwald et al. 1976; Huang
et al. 1976; Green et al. 1978) and is readily desorbable
slower step can extend to over 60 days and is not easily reversed since it involves the formation of a solid phase
(Chen et al. 1973b>.
BIOAVAILABILITY OF SEDIMENT-BOUND PHOSPHORUS
Quantification of the amount of suspended
sediment-bound phosphorus that is available for algal utilization may help explain the role of these sediments in the phosphorus cycle of lakes. Estimates of the relative availability of phosphorus associated with these sediments as they enter a water body are very important if we wish to determine the most cost effective control strategies for regulating phosphorus inputs (Sonzogni et a^. 1982>. For example, an extensive study on phosphorus management strategies for the Great Lakes (PLUARG 1978), which are subject to high loading of sediment-bound phosphorus, examined the bioavailabilty of various sources of inputs. While diffuse tributary inputs of phosphorus were found to comprise up to 53 percent of the total phosphorus entering the lake, they were found to be relatively unavailable (<40X). This heavily contributed to the decision that the most cost effective management strategy would be removal of municipal point source phosphorus. The sediment entering the lakes from eroding bluffs surrounding the lake was found to be essentially unavailable and considered unimportant for phosphorus
management (Williams et gl. 1980).
phosphorus (AAP>, are also important in attempts to refine emperlcal input/output models. These models attempt to predict algal biomass based on, among other factors, total phosphorus loadings, <Vollenweider 1968; Dillon and Rigler
1974>. Nicholls and Dillon (197d> claim that the assumption behind the use of total phosphorus is that it is all
potentially available for algal utilization. The limited success of these models is possibly related to a rough
relationship between total phosphorus and AAP (Sonzogni et
al. 1982). Increased incorporation of bioavalibility values into these models, as was done by Schaffner and Oglesby (1978), should decrease some of the uncertainty associated
with their predictions.
Laboratory experiments attempting to quantify the
amount of sediment phosphorus available to algae, have
primarily used modifications of standard algal bioassay methods. Basically, algae are grown with sediments as the sole source of phosphorus while all other conditions affecting growth are kept at optimum. Consequently, the bioavailability values obtained are usually considered to represent the maximum bioavailability obtainable under
laboratory conditions (Lee et al. 1980>.
The availabity of phosphorus which ultimately results
under natural conditions is a function of a multitude of
factors including; the forms and amounts of the phosphorus
in the particulate fraction, the residence time of the particle in the lake water, the abundance, species
the solution phosphate concentration, and other factors
controlling particulate phophorus solubility such as pH and
Eh (Armstrong et al. 1979>. Other factors such as sediment
resuspension (Williams et al. 1980> and retention time in
the photic and/or mixing zone may also be important.
Measurements of AAP have shown variation between and within various sources. This is partially due to the large
number of factors affecting the actual availability but also
is related to variations of the methods used (Lee et al.
1980). Estimates of AAP have varied from O to 55 percent with an estimated mean AAP of 25 to 30 percent (Golterman et
si. 1969; Fitzgerald 1970; Chiou and Boyd 1974; Golterman
1977; Cowen and Lee 1980; Williams gt gl. 1980; Klapwi^k et
gl. 1982).
Inorganic sediment phosphorus consists of an apatite fraction and/or a non-apatite inorganic phosphorus (NAIP) fraction, which is mainly composed of phosphate adsorbed
onto oxides of aluminum and iron, but also may include
actual iron and aluminum minerals and non-apatite calcium
phosphate (Sonzogni et al. 1962). Recently, attempts have
been made to correlate AAP determined by bioassay to the presence of these fractions. Modifications of extraction
techniques initially developed by Chang and Jackson (1956>,
which were developed in an attempt to relate the phosphorus
fraction extracted to plant growth, have been used. The
apatite fraction haa often been found to be essentially
1980>, however» some studies indicate small amounts may be available (Premazzi and Zanon 1984>. In some experiments, an extraction using NaOH, which removes the majority of NAIP, has been shown to predict the AAP accurately, implicating the high availability of the NAIP (Williams at
9l. 1980; Young and DePinto 1982). However, Klapwick (1982)
found that the NaOH extraction severely overestimated
(2-10x> the AAP while Dorich et al. (1982) found the NaOH
LAKE SAMPLING AND MEASUREMENTS
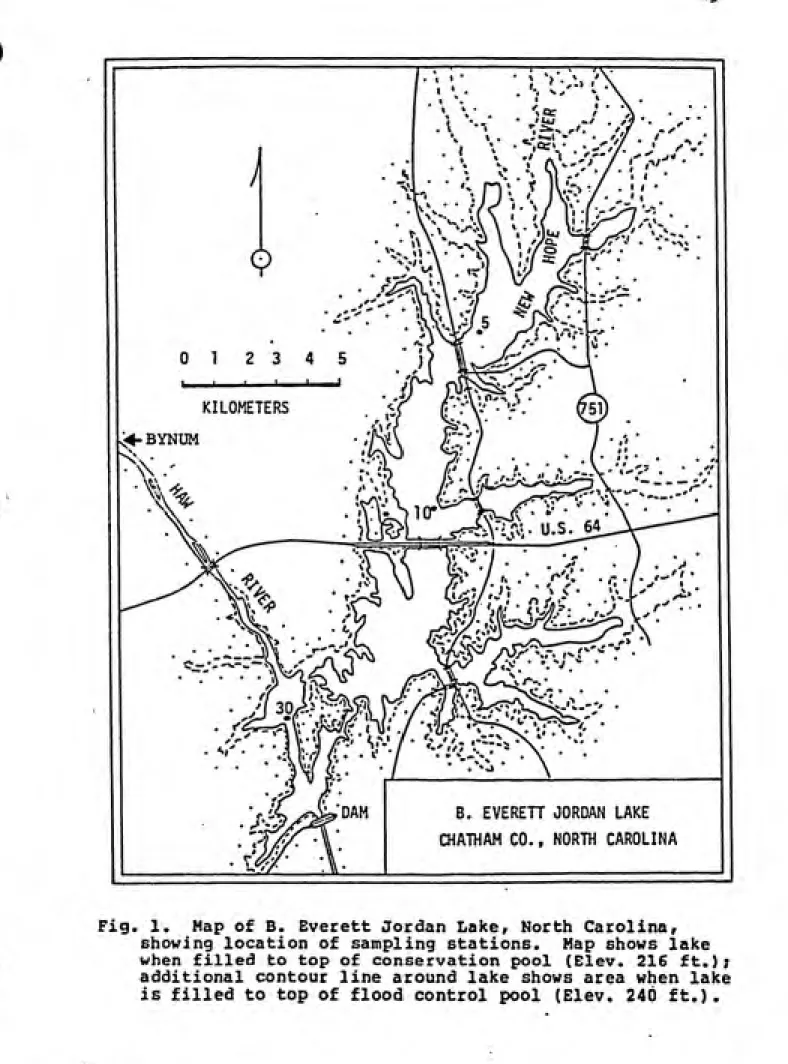
Sampling trips to Jordan Lake were made approximately
monthly; from December 1983 at Station 10 (Figure 1> and
Station 30, and February 1984 at Station 5, until January 1985. Additional intensive samplings were performed at
Station 10 in March and Hay 1985. Host samples were taken between 0800 and 1400 hours. Water was collected from 0.5
m, assumed to be representative of epilimnetic water, using
a nonmetalic pump (Jabsco Inc.) equipped with a plastic
intake hose covered with 380 um netting. Water was collected from five depths throughout the water column
during the intensive Station 10 samplings. Water was dispensed into large polyethylene carboys and shaded until
use.
At each station; air temperature, weather conditions, and time of sampling were recorded. Water depth was
measured using a Lowrance depth meter, ^n s^^u water column
measurements of temperature, conductivity, and dissolved
oxygen were made using a Hydrolab Surveyor Hodel 6D.
Underwater light intensity of photoaynthetically active
^
KILOMETERS
BYNUM
^
ͣ
S^. U.S^
B. EVEREH JORDAN LAKE
CHATHAM CO., NORTH CAROLINA
Fig. 1. Map of B. Everett Jordan Laker North Carolinar showing location of sampling stations. Map shows lake when filled to top of conservation pool (Elev. 216 ft.);
Filtrations for nutrient and pigment analyses <chlorophyll-a and phaeophytin) were done on the boat using acid-rinsed glass fiber filters (Whatman GF/F for phosphorus analyses, GF/C for nitrogen and pigment analyses). Filtered and unfiltered water samples were dispensed into acid-washed polyethylene bottles and stored on ice in the dark until return to the laboratory where they were refrigerated until analyses. Filters for pigment analyses were stored in a dessicator on ice until they could be frozen in the laboratory. Pigments were spectrophotometrically determined using an alkaline acetone extraction (Wetzel and Likens 1979).
PHOSPHATE UPTAKE
Gross phosphate uptake rates were measured aboard the
boat via the use of carrier-free 32p-iabeled orthophosphate
longer when uptake was slow. Both filters and filtrate from the 0.45 urn filters were placed in plastic scintillation vials. Upon return to the laboratory, 5 ml of
distilled-deionized water was added to the vials containing the
filters and the radioactivity of all samples was counted using Cerenkov radiation (Haberer 1965) on a Packard Tri-carb Model 3320 liquid scintillation counter.
The rate coefficient for phosphate uptake, K, is described by the equation:
-K = In <At/Ao> / t
where A© * initial activity of filterable 32p (determined
from the sum of the filter and filtrate activity from the first subsampling), At, = activity at time t, and t = elapsed time. This equation assumes that the removal of phosphate from the water is a first-order reaction and that a steady state exists between soluble and particulate phosphorus.
The rate coefficient, K (h~^>, indicates the relative
fraction of phosphate that is being transferred to particulate matter per unit time. K was estimated by calculating the slope of the regression line of the natural
logarithm of filtrate activity vs time. Often K was not linear throughout the entire experiment and an asymptote was
reached. This necessitated the use of the equation:
-K » In <<At-A=c>/<Ao-A^)>/t
phosphate turnover time <1/-K> can be generated. The turnover time is the time required for the amount of phosphate in the water to be completely replaced» assuming
steady state conditions exist.
The gross phosphate uptake rate, v (ug P 1'^ h~l>, was
calculated by multiplying the uptake rate coefficient by the ambient filterable reactive phosphorus <FRP) concentration:
V = -K • (FRP)
The phosphate uptake attributable to abiotic uptake was measured by poisoning water samples with formaldehyde (2.5 ml of 37 X formaldehyde into 100 ml sample). After 20-25 minutes, tracer was added and uptake measured as described above. Abiotic uptake was subtracted from uptake in untreated samples to estimate biotic uptake. Different pore-size filters (0.45 and 8.0 um) were used to attempt to differentiate between "large" particle (algal) uptake, and "small" particle (bacterial) uptake. At Station 10, the biotic uptake was further fractionated into eucaryotic (algal) uptake and procaryotic (blue-green algal and bacterial) uptake by treating the samples with antibiotics
(Gentamycin/Kanamycin at 300 ug-ml"!). Eucaryotic uptake
was calculated by subtracting the uptake in the killed sample from the uptake in the antibiotically treated sample; procaryotic uptake was calculated by subtracting uptake in the antibiotically treated sample from uptake in the ambient
sample.
phosphate concentration were performed twice at Station 10.
The resulting values were analyzed using the
Nichaelis-Henton equation:
Vmax • S
V =
---K« + S
where v « the measured uptake rate, Vmax = '^^^ maximum
uptake rate, and S = the phosphate (substrate) concentration, from which Ks* the half-saturation coefficient or the phosphate concentration where v ' 1/2 Vmaxr ^od calculated.
Net phosphate uptake rates were occasionally obtained by measuring the change in FRP concentration over time. Lake water samples were incubated under conditions identical to those of the tracer experiment, including equal time,
except no tracer was added. The FRP at the beginning and at
the end of the incubation was measured; the difference
between them corresponding to the net uptake or efflux by
seston.
NUTRIENT ANALYSES-LAKE WATER
Measurements of total phophorus (TP>, total filterable phosphorus <TFP>, and filterable reactive phosphorus <FRP), were spectrophotometrically determined using procedures
ug 1~^ detection limit were assigned concentrations of 0.5
ug 1~1. TP (unfiltered water) and TFP (filtered water) were
determined by digesting the samples with persulfate,
autoclaving for 1/2 hour (Wetzel and Likens 1979) and
allowing samples to sit overnight. P was then measured
using the FHP technique described above. Particulate
phosphorus (PP) was defined as the difference between TP and
TFP. Filterable unreactive phosphorus (FUP> was defined as
the difference between TFP and FRP. Nitrogen analyses were
performed by other members of the Jordan Lake project using
standard spectrophotometric techniques (Wetzel and Likens
1979).
STREAM SAMPLING AND SAMPLE PROCESSING
Water samples were collected from the Haw River at
Bynum, N.C., during five ma^or precipitation events from
January 1985 to Hay 1985. Samples were collected at
approximately the peak of the stream hydrograph. During the
storms of January 1-2, 1985 and February 1-2, 1985, the
stream was sampled twice in order to evaluate inter-event
variability. On Hay 23, 1985 the upper Haw River arm of
Jordan Lake was also sampled. Grab samples (20 1> were
obtained with polyethylene carboys at 0.5 m depth.
Samples were immediately returned to the laboratory
where they were immediately filtered through a 360 um
plankton net screening to remove large particulate material
and detritus.
suspended sediments was generally begun within 12 hours, except for the Hay 16, 1985 sample which was centrifuged after 72 hours. A Sorvall RC-5B superspeed refrigerated centrifuge equipped with a continuous flow-through unit was run at 18,200 rpm at a flow of 180 ml/min. This was found to remove approximately 90 k (by weight) of the particulate material retained on a .2 um membrane filter. The resulting slurry was stored in glass beakers in the dark at 4 C.
Total residue (TR> and total centrifugable residue (TCR) (as opposed to total filterable residue) were measured by drying 100 ml samples of unfiltered and filtered stream water respectively, in evaporating dishes for 36 to 48 hours at 104 C. Repeated weighings were later made to ensure no further decreases in weight occurred. Total noncentrifugable residue (TNCR), which is closely related to the suspended solids concentration, was calculated by the difference between TR and TCR. Loss on ignition (LOI), an estimator of organic content, was obtained by ashing the
residues for 3 hours at 550 C.
NUTRIENT ANALYSES-STREAM WATER
Total phosphorus, total centrifugable phosphorus (as oppossed to total filterable phophorus), and filterable reactive phosphorus were analyzed using methods described
earlier.
4X peraulfate in glaaa centifuge tubes. The tubes, placed
on their sides to maximize the sediment surface area in
contact with the persulfate, were autoclaved for 1 hour at
15 psi. Samples were then placed on a rotary shaker for 18
to 24 hours, centrifuged, and a 2 ml aliquot of centrifugate
was removed and diluted to 10 ml with distilled water. Samples were then analyzed for FRP. Standards and blanks
were processed in the same manner. Spikes showed good recovery, generally 90 to 110 k.
Base extractable phosphorus was measured by extracting the sediment slurry with 0.1 N NaOH in 0.1 N NaCl for 18
hours in polyethylene centrifuge tubes on a rotary shaker
(Williams et a^. 1971; Armstrong et al. 1979). Sediment (IS mg dry weight) was diluted with extraction solution to 30 ml, resulting in a sediment to solution ratio of approximately 1:2000 by weight. Following extraction, the samples were centrifuged, an aliquot of centrifugate was removed and neutralized to pH 7, FRP was then measured.
DESORPTION-ADSORPTION CHARACTERISTICS OF SUSPENDED SEDIMENTS
Experiments to determine whether sediments were acting as a source or sink for soluble phosphorus in the river and lake were performed using methods similar to those of White and Beckett (1964), Taylor and Kuniehi (1971>, and Kuenzler and Greer (1980). 50 mg (dry weight) of sediment slurry was
added to 40 ml of 0.01 H CaCl2 which contained from O to 500
ug P 1~^. Flasks containing the sediment solution were
dark for 12 hours at the approximate ambient temperature of
the stream when sampled. Samples were then centrlfuged,
filtered through a .45 um Metrical TCM membrane filter and
analyzed for FRP. The amount desorbed or adsorbed was
calculated from changes of the initial phosphate
concentrations in the flask. From the resulting curves, the
equilibrium phosphate concentration (EPO, the concentration
where no net desorptlon or adsorption occurs, was
calculated. The amount of phosphate that could be adsorbed
by the suspended sediments at the ambient stream FRP
concentrations, termed the instantaneous sorption capacity
index (ISCI), was calculated by measuring the height of the
sorption curve above the x-axis (solution phosphate
concentration). Samples from January and February 1985,
were initally used within 3 to 5 days of collection,
however, later realization that failure to maintain a
constant ionic strength in all test flasks produced errant
results, necessitated redoing the experiments on sediment
slurrys that had been stored frozen for several months. All
other sorption isotherms were performed within 3 to 5 days
of collection. On the May 3rd samples, the effects of
blotic activity were measured by poisoning the fj.asks with 5
drops of chloroform.
BIOAVAILABILITY OF SEDIMENT-BOUND PHOSPHORUS
The amount of suspended sediment-bound phosphorus
available for utilization by algae was measured via a
Algal Assay Bottle Test (Miller et al. 1978). Selenastrum
was grown with sediments as the sole source of phoshorus. The resulting growth was compared to a series of standards
grown with known amounts of orthophosphate, assumed to be
completely available. Eight- to ten- day old cultures of
§§l§QSS^£iyS were concentrated and used as innoculum.
Cultures of this age were deemed old enough to minimize carry-over of luxury phosphate but young enough to prevent any physiological damage that may occur when cells are severely phosphorus starved (Shiroyama et al. 1975).
Sediment was resuspended in P-free media to give an Initial
total-P concentration of 317 ug P 1*1 (19 ug P/60 ml).
Standards were prepared with known amounts of KH2PO4(0-50-100-150-200-250 ug P 1"^). Three or more replicate flasks
were innoculated to produce an initial algal concentration
of 1x10*^ cells/ml. Flasks were incubated at 24 C under
continous fluorescent lighting of approximately 400 foot-candles and rotated daily on the shaker table to ensure
equal light exposure. Flasks were stoppered with cotton
plugs and shaken at 110 oscillations per minute. Every
three days, at least 300 cells were counted with hemacytometer counting chambers on a American Optical microscope. Clumping of sediments frequently occurred several days after incubation began. However, counts before
and after gentle grinding with a tissue grinder showed no
significant differences. Assays were terminated after the
after 15 days.
Phosphorus limitation was ensured in the flasks by maintaining a N:P ratio of 17:1 by weight. In the sediment flasks, this ratio is maintained if the maximum phosphorus
bioavailability is 80X or less. Halone et al. (1978) found
that the minimum ratio to ensure phosphorus limitation for ^elenastrum was 10:1. Flasks were also spiked with phosphorus at the end of the assays to confirm P limitation. Sediment phosphorus bioavailability was calculated by
comparing the average number of cells produced per unit P of
PHYSICAL CHARACTERISTICS OF LAKE WATER
The surface (0.5 m> water temperature profile exhibited the characteristic sinusoidal curve (Figure 2>. Slight
spatial variability observed between stations can largely be
attributed to time of day sampled. Additionally, the different origins of the water masses. Stations 5 and 10 came primarily from the New Hope River watershed under normal flow conditions while Station 30 water originates in the Haw River watershed, was likely important. The lowest
SURFACE TEMPERATURE
i 30 28 26 24-22 20 18 16 14-12 10 8 6 A-2 0^J
/^^ v^y. 1^ F%^
> / k^^ y\:Hs^
w^^
/1^^
i4v y %r^
'•ͣ^^ .x^.x^
yx? /\y '''^Z ^'y. ''\y. ^'^< /\y /\'/, /\Z /\y. /\'/, ''^^ /\'/, /x^ Wz ͣ / /x:H /\/.\PrA STA 5
____ DATE
IS3 STA 10 P^ STA 30
temperature (4.0 C> occurred in January 1985 at Station 5
while the highest temperature recorded (29.4 C> was at
Station 30 in July 1984 after a period of prolonged warm
weather. Ice was not observed in the main water channels ofthe lake during any winter samplings. Vertical temperature
profiles <data not shown) usually exhlbit.ed little variation
<0-3 C> between surface and bottom waters during the cool
months. Stratification of varying intensity was evident from
June to August 1984 during which time anoxic conditions were
frequently observed in the hypolimnion.
Light attenuation through the water column was high as
evidenced by the shallow depths of the photic zone, which,
in this report ia defined by the depth of the ix light level
(Figure 3>. Station 5, and to a greater extent. Station 30,
were subject to heavy point source loadings of suspended
clays during the winter months, hence the shallow ix light
levels. The proximity of Stations 5 and 30 to tributary
inputs cause them to be highly influenced by hydrologic
events. Changes in the characteristics of the water at
these two stations can occur rapidly. Consequently, while
much of the data presented in this report is presented in
the form of continuous data, however, it should be
LlI
Q
LIGHT DEPTH
STA 5
DATE
ͤ
STA 10 STA 30
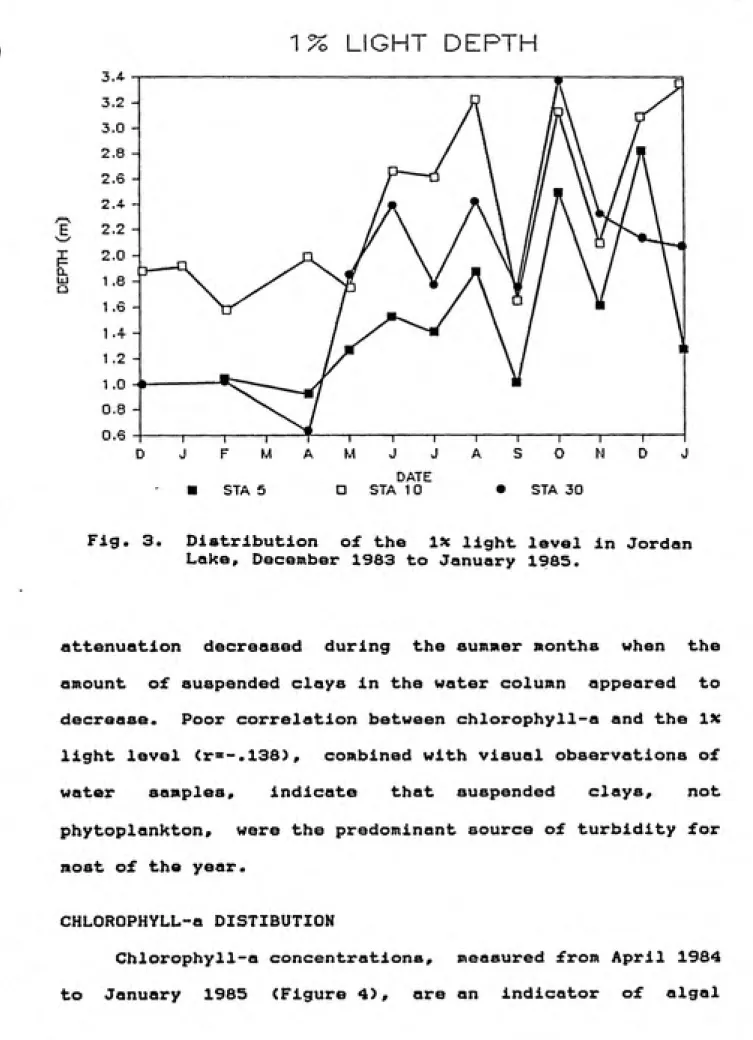
Fig. 3. Distribution of the ix light level in Jordan
Lake, December 1983 to January 1985.
attenuation decreased during the summer months when the
amount of suspended clays in the water column appeared to
decrease. Poor correlation between chlorophyll-a and the IX
light level <r''-.138), combined with visual observations of
water samples, indicate that suspended clays, not
phytoplankton, were the predominant source of turbidity for
most of the year.
CHLOROPHYLL-a DISTIBUTION
Chlorophyll-a concentrations, measured from April 1984
CHLOROPHYLL CONCENTRATIONS
d I
ͣ
STA 5
DATE
D STA 10 • STA 3D
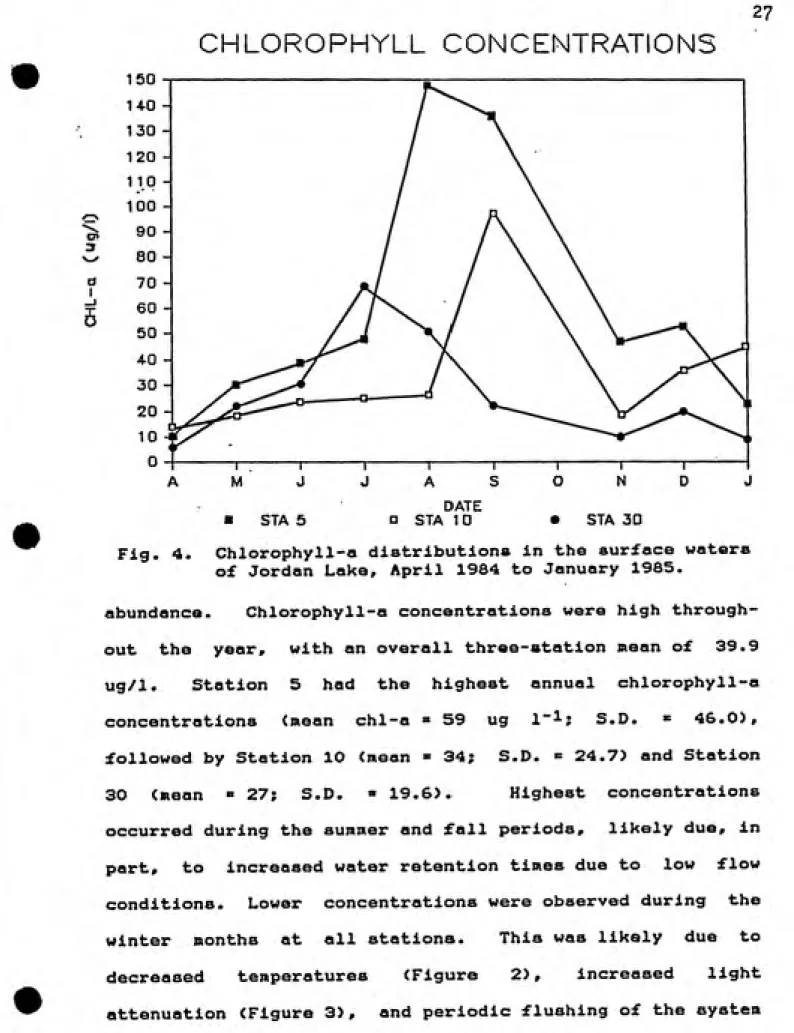
Fig. 4. Chlorophyll-a distributions in the surface waters
of Jordan Lake, April 1984 to January 1985.
abundance. Chlorophyll-a concentrations were high through¬
out the year, with an overall three-station mean of 39.9
ug/1. Station 5 had the highest annual chlorophyll-a
concentrations (mean chl-a » 59 ug 1~^; S.D. « 46.0),
followed by Station 10 (mean » 34; S.D. = 24.7) and Station
30 (mean » 27; S.D. » 19.6). Highest concentrations
occurred during the summer and fall periods, likely due, in
part, to increased water retention times due to low flow
conditions. Lower concentrations were observed during the
winter months at all stations. This was likely due to
decreased temperatures (Figure 2), increased light
during periods of heavy stream flow.
PHOSPHORUS DISTRIBUTIONS
The distribution of the phosphorus fractions in t.he
t.he lake appeared to be controlled largely by the hydrologlc
regime of the lake. During the cool season, periods of high
stream flow following heavy precipitation events delivered
nutrient-rich water into the lake, while during the warm
season periods of low flow and long retention time likely
allowed for biological uptake to reduce nutrient
concentrations. Total phosphorus (TP> averaged 120.5 ug 1~1,
clearly Indicating the eutrophic status of the lake.
Spatial varlabilty of TP was very pronounced (Figure 5).
Station 30 always had the highest TP concentrations (mean TP
« 219 ug 1~^; S.D. « 145.9>, followed by Station 5 (mean »
118; S.D. > 88.4), and then by Station 10 (mean > 72; S.D. «
43.7> indicating a general trend of increasing TP with
decreasing distance from major tributary Inputs.
Distribution patterns were dominated by high TP
concentrations during the winter of 1984 when periods of
high suspended sediment inputs occurred. Spatial and
temporal variation was less pronounced from June through
November 1984, during which time TP concentrations ranged
from 31 to 171 ug 1~1. Particulate phosphorus (PP>
concentrations (Figure 5) were high ( 22 to 404 ug 1"^,
600
500
4.00
S 300 \
O.
O)
3 200
TOTAL PHOSPHORUS
<
C
h-Z
UJ
o
z
o o
0)
3
flC
o
X
a
O
100
ͣ
STA 5 D STA 10
• STA 30
M M
PARTICULATE PHOSPHORUS
400
250
200
100
50
-DATE
Fig. 5. Total phosphorus and particulate phosphorus
distributions in the surface waters o-f Jordan
STATION 5
STATION 10
STATION 30
DATE
FRP PUP
Fig. 6. Filterable reactive P and filterable unreactive
P distributions in the surface waters of Jordan
reactive phosphorus <FRP> concentrations (Figure 6> were
high during the winter months of 1983-84 but often
decreased to 1 ug X~^ or below at Stations 5 and 10 during
the warm season. Station 30 had high FRP concentrations
throughout the sampling period but did decrease to
undetectable levels (<1 ug P I'^i in October 1984.
Filterable unreactive phosphorus (FRP) (Figure 7) usually
comprised a greater portion of the total dissolved
phosphorus component than did FRP and had less spatial
variabilty. The cycle of FUP can not be easily explained.
FRP UPTAKE COEFFICIENTS AND TURNOVER TIMES
The relative rate of FRP uptake (K) exhibited
distinctive spatial and temporal trends (Table 1)
characterized by low values during the winter at all 3
stations and high values during the warmer months at
Stations 5 and 10. The turnover time (1/k) of FRP in the
lake showed large temporal and spatial variability (Figure
7). Long turnover times, 4 to 500 h, occurred throughout
the lake from December 1983 to April 1984. Large decreases
in turnover times occurred at stations 5 and 10 from May to
December 1984, reaching a low of .06 h (3.6 min) at Station
10 in August 1984. Station 30 turnover times remained long
throughout the study period, ranging from 10.8 to 143 h,
except for one decrease to 1.2 h in October 1984 when FRP
levels dropped to less than 1 ug I'l.
Table 1. Phosphate uptake coefficient (K) distribution In surface waters of Jordan Lake. Units " h~^.
DATE STATION 5 STATION 10 STATION 30
18-DEC-83
---.230 .068
20-JAN-84
---.031
---22-FEB-S4 .002 .040 .017
06-APR-84 .039 .091 .012
05-MAY-84 1.29 2.99 .014
07-JUN-84 2.03 9.78 .074
12-JUL-84 2.59 3.09 .030
14-AUG-84 2.30 11.86 .095
17-SEP-84 1.82 7.40 .017
18-0CT-84 6.61 9.54 .838
17-N0V-84 1.55 .68 .007
16-DEC-84 1.59 6.03 .024
c c_ ~n > 2 c_ c_ > CO o z D c_ -O ͣ
1 1
10 -
100
-3 3 3 (0 P • s\\'\\'\\<\\\\VI • \ ////////\
0 M-• &
\\\\\\\\\\\\\\\l
m H
(t
sVvvvCvvvwCvv^^
0 or ~r| H» !-• XXXNXXXNJ //////]AJ
0 *1 s\\\\\\\\V\\\\\\\\\\\N
•1 • a 0
a fi
U
D (+ 7 !//. M-I\^ s.\\\\\\\\\\\\\\\\\\\\3 r <
r
• -d \/ / / / / .
^
• V
\\\
v\V\\\\\^\\\^J
o
0*0
/
0 y 1 / / /
o
0 0 0 1
iSN
v\\\\\\\\\\\\\\\V1 9 C
tr 0
<
\/ / / / / / p-l c IV n\VV\\\\\\\N
i
/U
CO < \/ / / / /
0 v\\\\\\\\\\\\\\\\V\\"l
H
f* fi o 3 (+ \\\\^^
p- \/ / ^ / /.
0 0 3 0 c 0 '»
i\
m
ͨ
1 tr
skxXXXVVxXXXXXVsXXXxXVNX-l
M-H» 3
1A \/ / / /
OD 0 sx\\\\\\\\\\\\\\\vi
Cfl c • ͨI
WWWWI
a cz:
0
0 s\\\\\\\\\\\\\\\\\M
0.007 to 9.78 ug P 1~1 h~3- (Figure 8> . The lowest and moat
nearly constant uptake rates occurred at Station 30, even
though TP concentrations were highest there. Rates at
Stations 5 and 10 had significantly more variation with time and tended to be higher during the warmer months.
GROSS ABIOTIC AND BIQTIC UPTAKE RATES
Abiotic uptake rates, defined as the rate of uptake in
formaldehyde-treated samples, were highest at Station 30
<v-1.08 ug P 1-1 h-1; S.D.»1.25)(Figure 8) likely due to the
high concentrations of suspended clays and FRP that oftenoccurred there. At Station 30, abiotic uptake was responsible for 100 percent of the total uptake in December
1983, February, May, November 1984, and January 1985 (Figure
9). Station 5 abiotic uptake (v=0.50 ug P 1~1 h"!;
S.D.=0.87> was relatively constant and low, except forslight increases in April 1984 and January 1985 (Figure 8>. Station 10 had the lowest abiotic uptake rates (\rs0.09 ug P
1~1 h~l; S.D.»0.13>. Abiotic uptake comprised less than 1
percent of the total uptake from June through October 1984,
and only once, in February 1984, did it contribute more than
50 percent of the total uptake (Figure 9).
Biotic uptake was separated into two size fractions, a
0.45 to 8.0 um fraction (small particle), assumed to
represent bacterial uptake, and > 8.0 um fraction (large
particle), assumed to represent algal uptake. Biotic uptake
was dominated by the small size fraction (Figures 8,9),
1
vi V) tn
« u • « in >M 00
tH
>. u 3 c o •-> 0 • (») JC 00 « 0^ a
• • A « E 0 (D U U 0) • Q • « C • 0 X
ͣ
H « 4J J
•H
+J c
0 •o
c o
o • o a
0)
•H
«1 (0
U) <^ r+ C » 0 0 3 0 Mr* t-a o cr CI » »-• I-- (+ 3 O H-r* < rv ͨ* 0 01 »ͣ o x- o * 0 0 n ' -o 0 :r a 9 D tt 3 f* ffl «+ a M n o o V 0*
o> c O e+ O •-• •1 » 0 X C 3 H O 3 oo I- cr o u) a H- H,
o c H- cr M O H-H> 0 0 o 3 c o
00 » 01
0 10 a «
€ 0
(+ H- O 0 o •
3 ifr o in o t+ H, o 7//y////7y7777/////y/m^ ^;nx\\ 'V///yy'/y/yyyyyyyM
•^yyyMyymmi.
"
ͣ
^77777777^^^
yyyyyyyyyyyyyyyyyy^
B
PERCENT P UPTAKE
»i u »'. m o> VI a <o o ooooooooo
,• /// /' / /• ͣ / ,ͣ /// ///// ^0
''vA^y/Z^mm
V7¥
//'/,// ͣͣͣͣ.ͣ ///////:m;:.
ͣ
////////
vz
2M
• • i ' 1 ' t • • • • t • ͣ ^ t i f t I ( t t {V^\
' f >.' ' / / ' ' ' J J
V ,^^/ y,-/// .-.ͣͣ// .ͣ.'.ͣͣ.'-X /.. ////^
-^Z^MM^^^M
ͣ
yyyyyyy^y/yyy^m
'7'/77///.'07y//////A^Wyy///Z?///<7<^'^.
mmz <- r'y.'y y/y ^T^Ty ,'y -m^
"^k^SMM^z^m.
'yy/777,'V/7//7yy/.- y/y/y^. '' -' ͣ'/yy/y/y ^ ͣ'//// '///\^:^^
//y////////y/////y/AmS.
w^^m^zmzm.
wz777m$\M
Uptake attributable to the large fraction, while always measurable, never comprised more than 20 percent of total biotic uptake at any station, except in February 1984 at Station 10 when it comprised 42 percent of the biotic uptake during a period of very low total uptake.
At Station lO, antibiotic treatment of water samples
was used in addition to size fractionation, to distinguish algal and bacterial uptake. However, since it is likely that antibiotic treatment inhibits the phosphorus uptake capabilities of blue-green algae as well as that of bacteria, a more correct differentiation of the uptake fractionation may be eucaryotic and procaryotic uptake. Eucaryotic uptake comprised from 3.5 to 99.9 percent of the total uptake and was always greater than the uptake in the large size fraction (Table 2>. Eucaryotic uptake often comprised a large percentage of uptake in the small size fraction (Table 2> indicating either the large (8.0 um> filter did not effectively retain most of the phytoplankton or the antibiotic was unsuccessful in eliminating all of
the bacterial uptake
NET PHOSPHORUS UPTAKE, VERTICAL PROFILES, AND EFFECT OF
SUBSTRATE CONCENTRATION
Table 2. Effects of antibiotics and size fractionation on biotic uptake at Station 10 of Jordan Lake. K), ie the biotic
uptake coefficient (h~^).
TREATMENT
SIZE
(um)
_____'^b__
v. of BIOTIC
UPTAKE
'/. UPTAKE
DATE EUCARYOTIC PROCARYOTIC
IB DEC AMBIENT >8 .014 7 10 90
<8 .177 93 19 81
ANTIBIOT >8 <B .0014 .0036 4 96
20 JAN AMBIENT >8 . 002 11 62 38
<8 .017 89 105 0
ANTIBIOT >8 <8 .001 .018 7 93
22 FEB AMBIENT >8 .003 42 16 84
<8 .004 58 114 0
ANTIBIOT >8 <8 .0004 .006 7 93
06 APR AMBIENT >8 .006 7 45 55
<8 .078 93 104 0
ANTIBIOT >8 <8 .003 .081 3 97
05 MAY AMBIENT >8 .347 12 4 96
<B 2.62 88 4 96
ANTIBIOT >a <B .013 .102 10 90
07 J UN AMBIENT >8 .264 3 . 27 73
<8 9.52 97 4 96
ANTIBIOT >B <8 .071 .428 14 86
12 JUL AMBIENT >8 .124 4 160 0
<8 2.97 96 97 3
ANTIBIOT >8 <8 .198 2.90 6 94
14 AUB AMBIENT >B .58 5 73 27
<8 11.28 95 32 68
ANTIBIOT >8 <8 .427 3.56 11 89
17 SEP AMBIENT >8 .544 •7 14 86
<8 6.831 93 22 78
ANTIBIOT >8 <B .078 1.517 5 93
18 OCT AMBIENT >8 .506 5 28 72
<B 9.00 95 20 80
ANTIBIOT >8 <8 . 140 1.7B 7 93
17 NOV AMBIENT >8 .125 15 163 0
<B .712 85 7i 24
ANTIBIOT >8 <8 . 204 .542 27 73
16 DEC AMBIENT >B .547 9 24 76
<B 5.46 91 8 92
Table 3. Distribution of filterable reactive P <FRP),
phosphate uptake coefficients (K), phosphorus uptake rates <v), and chlorophyll-a, with depth at
Station 10 of Jordan Lake. Units; FRP= ug P l"!, K=h-1, vug P 1-1 h-1, chl-a=ug I'l.
DATE DEPTH FRP K ^ ^y'/. CHL-a
MARCH 1985 0.2 6 .069 .414 43
0.5 5 .048 .240 69
1.0 4 .049 .196 57
2.0 • 5 .058 .290 35
4.0 6 .023 .138 22
MAY 1985 0.2 4 13 .9 55.6 24
0.5 5 21 .2 105.9 22
1.4 2 14.7 29.4 25
3.0 • 2 13 .5 27.0 19
5.0 2 2 .9 5.8 10
highest rates occurring in the surface (0.2 m) sample
<v=.414 ug P 1~1 h~l> and the lowest occurring in the deep
<4 »> sample <v=.138 ug P 1"! h"!). The May 1985 vertical
profile was characterized by very high uptake rates, especially in the upper 0.5 m of the water column where the highest FRP concentrations were present. Below the metalimnion, present at 3 to 4 m, uptake rates decreased greatly. Size fractionation was not performed at the various depths, hence relative algal and bacterial uptake can not be estimated. The uptake rates generated from these vertical profile experiments should not be compared to other rates generated throughout the study because of different incubation conditions and a different method of calculating the uptake rate (using only two points, the initial and final filtrate activities, to derive the uptake rate coefficient). The uptake rates should not be critically compared between the vertical profile experiments since
different incubation times were used, however, the order of
magnitude increase observed in the rates in Hay 1985 as compared to those in March 1985, despite lower algal biomass and similar FRP concentrations, is probably a result of increased biological metabolism, not of the different incubation times.
The effect of additional phosphate substrate on uptake rates was measured in August 1984 and May 1985 at Station
10. Increments of 1 to 20 ug P 1~1 were added to lake water
and the resulting uptake rates were measured. The uptake
of the Hichaelis-Henton equation and the half saturation
concentration <Ks), the concentration at which uptake is
equal to one-half of the maxiiRUiii uptake, was obtained. The
ks measured was 3.31 ug P 1"! in August 1984 and was 3.8 ug
P 1-1 in May 1985. Ambient FRP concentrations <0.5 and 2.0 ug P l~^f respectively) were below the Ks values on both
occasions, indicating that the rates of uptake by the biota
were limited by the phosphorus available. Additional
attempts at measuring Ks values in Hay and October 1984 were unsuccessful in that uptake rates at different phosphorus
concentrations did not conform to the Hichaelis-Henton
equation and had no clearly discernable pattern in general. Changes in the FRP concentrations over time (3-4 h) were occasionally measured to provide an indication of net phosphate uptake (Table 4). Low ambient FRP concentrations often made detection of changes in the concentration
impossible and emphasizes the inherent difficulties involved
Table 4. Change of filterable reactive phosphorus
concentrations during incubation of Jordan Lake
water. Units are ug P 1~1.
FRP
DATE STATION INITIAL FINAL CHANGE
HAY 84 10 1 1 0
AUG 84 30 36 40 4
DEC 84 10 6 5 - 1
JAN 85 10 < 1 < 1 0
High phoephorus loads were apparent i.n the Haw River presumably due to the high phosphorus content of clays in combination with the numerous agricultural and industrial sources of phosphorus in the Haw River watershed. Total phosphorus <TP> <412 to 1236 ug P l"!), and filterable
reactive phosphorus <FRP) <87 to 479 ug P 1-1> (Table 6) were both high but not correlated with each other. FRF was
inversely correlated with flow (r=-.eO p«.05).
SORPTION OF PHOSPHORUS BY SUSPENDED SEDIMENTS
All sediment samples exhibited considerable ability to adsorb phosphorus from solution (Figure 10>. The equilibrium phosphate concentration (EPO, represented by the point where the sorption isotherm curve crosses the
x-axis, ranged from 1 to 77 ug P l"! (Table 7). The EPC was
always greater than the ambient stream FRP and the estimated lake FRP, indicating that the sediments were adsorbing phosphate, acting as a sink, on all occassions.
Direct comparison of the instantaneous sorption capacity (ISO of the sediments, which estimates the amount
of phosphate that can be adsorbed per gram dry weight of
sediment at the ambient stream FRP concentration, can be
made since a constant amount of sediment (50 mg/40 ml) was used in all experiments. The average ISC of the Hay stream samplings (140 ug P/g sed) was significantly higher (p=.05) than the average ISC of the January and February samplings
techniques. In two instances, discernable changes in the
FRP concentration were measured; a decrease of 1 ug P 1~^ in December 1964 at Station 10 and an increase of 4 ug P 1~^
in August 1984 at Station 30.
PHYSICAL AND CHEMICAL CHARACTERISTICS OF STREAM WATER
Stream temperatures remained constant during the cool season samplings (January-February) at 5 C and increased during the warm season samplings (May) to range from 17 to
23 C (Table S). Estimates of the lake water temperatures at
the time of stream sampling, based on lake samplings generally within 10 days of the stream sampling, are 5 C and IS to 21 C respectively, indicating that density (mainly
temperature) differences between stream and lake water were
likely too small to prevent some mixing of the water masses.
Instantaneous flow rates of storm events (Table 5) were much
higher during January and February (ave.=15,450 cfs) than in
May (ave.=2963 cfs). Total residue (TR) and total
nonfllterable residue (TNFR) were usually high and showed
considerable variability (Table 5). Total filterable residues (TFR) remained relatively constant. The percentage
of dry weight lost upon ignition (.H LOI), an indication of
organic content, ranged from 11 to 15 x on the sediment
slurry samples used for experimentation (Table 5). X LOI waa higher on TR samples (data not shown) than on the slurry samples. Indicating a higher percentage of the organic
Table 5. Temperature (C), instantaneous stream flow (cfs),
total and total nonfilterable residue (mg 1~^),
and X loss on ignition of sediment slurry of
samples from the Haw River at Bynum, NC, 1985.
aasssssasBssSBssssssssssssssi
DATE TEMP FLOW TR TNFR X LOI
1-3 5 10,000 337
231 15
1-4 5 11,200 284
199 14
2-1 5
20,100 681 601 11
2-2 5 20,500 278
217 12
5-3 17
2,220 242 138 11
5-16 22 1,020 212
48 15
5-23 23 5,650 1333
1204 11
5-23(Lake) 23 957
820 11
Table 6. Total P, total filterable P, filterable reactive
P, and particulate P (ug P 1~1> of water samples
from the Haw River at Bynum, NC, 1985.
DATE TP TIFP
FRP PP
1-3 811
329 235 462
1-4 564
143 92
342
2-1 674
120 95 493
2-2 412 99
87 308 5-3 475 275 254 161 5-16 549 492 479 112 5-23 1236 268 195 1264
5-23(Lake> 932 300
160 120 4-80 40
13
9
(0 0
O) —
a 40 ?
3 200 I 160
g
120s
+ ..
o 80
S
40i
0O
40 III
m
g
160g
120•c
a J on
JAN 3, 1985
. MAY 3, 1985
I MAY 23, 1985*
LAKE ͤ
FEB 1,1985 ͤ FEB 2, 1985*
MAY 16, 1985
0 50 100 200 300 400 500
400
PHOSPHATE CONCENTRATION (ug P/l)
Fig. 10. Phosphate sorption isotherms of suspended sediment from the Haw River at Bynum, NC. The
concentration at which the isotherm crosses the
Table 7. Stream and estimated lake filterable reactive P
<ug P 1~^>» equilibrium phosphate concentration
(ug P 1~^>, instantaneous sorption capacity
(ug P/g sed)* and net potential sorption
capacity (ug P s~l> of samples from the Haw
River at Bynum, NC.
STREAM LAKE
DATE FRP FRP EPC ISC NPSI
03-JAN 235 200 37 52 340
01-FEB 95 125 1 52 1782
02-FEB 87 125 6 50 633
03-MAY 254 120 25 99 86
16-MAY 479 310 77 199 28
23-MAY 195 390 11 122 2351
index (NPSI>, was developed to compare the instantaneous phosphorus sorption-potentlal of the stream during different samplings (Table 7). The NPSI was calculated using the
equation:
NPSI = (ISC) (TNFR) (FLOW).
Units for NPSI are ug P (potentially sorbed) sec~l. The
high NPSI value on February 1 is largely due to high stream flow while the high NPSI on May 23 is largely due to high TNFR (Table 5). Low NPSI values occurred on May 3 and May
16 despite having high ISC values.
Two samples collected in February from the same storm event but at different periods showed relatively small
differences between the EPC and ISC (Table 7). However,
since the TNFR on February 1 was nearly three times the TNFR on February 2, and the streamflows were essentially equal, the NPSI of the February 1 sample was three times that of the February 2 sample. This emphasizes the large potential error that may occur when estimates of the net effect of suspended sediments are made using data from only one sampling during high flow conditions.
The May 23 sampling of both the stream and Haw River arm of Jordan Lake showed a relatively small decrease in the
EPC (11 vs 6) and a small increase in the SCI (122 vs 139)(Table 7). TP and TNFR decreased from the stream to the
samples must be done with the understanding that the
samples taken from the lake resulted from an earlier parcel
of stream water which may have contained sediments and water
with considerably different sorption-related character¬
istics.
The addition of chloroform to the flasks in which the
May 3rd sorption experiments were being performed resulted
in no change in either EPC or ISC, indicating that biotic
uptake of phosphate during the experiments was not
significant.
BIOAVAILABILITY EXPERIMENT RESULTS
The percentage of algal available phosphorus (AAP)
ranged from 5.1 to IS.6 percent of the total sediment
phosphorus (Table 8>. The mean AAP of the 5 stream
samplings was 11.3 percent. Selenastrum's growth curves
(Figure 11> using sediment-bound phosphorus were
characterized by an initial phase of exponential growth,
closely paralleling the growth of standards grown with
orthophosphate, which is assumed to be lOOfi available. This
initial rapid growth phase, which lasted approximately three
to six days, was usually followed by one to three days of
slower growth, after which little growth occurred. The
maximum cell numbers were reached between nine and twelve
Table 8. Biomass produced with equal amounts of
sediment-bound phosphorus and orthophosphate, percent sediment phosphorus bioavailable, and percent phosphorus removed via NaOH extraction. Standard
deviations in parentheses.
rsssssEsasss
cells/ug P <xl04) PERCENT PERCENT
DATE SEDIMENT STANDARDS BIOAVAILABLE NaOH EXTR
03-JAN 7.27 (.58) 39.1 (.27) 18.6 52.6
04-JAN 6.06 <.88> ͣͣ 15.5 51.6
01-FEB 3.86 (.30) M 9.9 52.0
02-FEB 2.92 (.41) ti 7.5 46.0
03-MAY 1.99 <.48> fli 5.1 43.2
16-MAY 5.07 (.97) ͣ• 13.0 59.5
23-MAY 4.91 (.73) 1* 12.6 46.1
10'
10«
E
(0 Ul
o
10=
10^
• ••
...5
200 ug P/l
«3-JAN
50 ug P/l
• 1-FEB
3-MAY
0 ug P/l
Fig. 11. Examples of growth curves of Sglenastrum
SaBCieernutys grown with sediment (solid lines)
bacteria were visible, but they did not appear to flourish
during the experiment. Their importance in algal
utilization of the sediment P could not be quantified but is
assumed to be minimal.
The O.m NaOH extraction removed from 43.2 to SS.S^t of
the sediment phosphorus (Table 8>. This is significantly
more than the 5.1 to 18.6X of the sediment phosphorus
utilized by the algae indicating the NaOH extraction was a
very poor indicator of AAP.
Some clumping of the sediments occurred, usually
beginning after four to seven days of incubation. Careful
pestling of the clumped samples did not significantly alter
the algal counts, indicating that direct physical contact of
the algae with the sediments may not have been an important
factor in the resulting coagulation of the suspended
PHOSPHORUS DISTRIBUTION AND ALGAL BIOMASS
Phosphorus concentrations are high in Jordan Lake
(Figures 5 and 6> and indicating eutrophic conditions.
Using the trophic state index of Vollenweider (1968>, which
is based on epilimnetic total phosphorus (TP)
concentrations. Station 10 (»ean TP«72 ug 1'^) is classified
as eutrophic while Station 5 (mean TP=118 ug 1~1} and
Station 30 (mean TP=219 ug 1~1) are hyper-eutrophic. Weiss
and Francisco (1984) using a trophic state index developed
on North Carolina lakes (Weiss and Kuenzler 1976), also
concluded that Jordan Lake is eutrophic, even when inputs
during periods of heavy tributary stream flow are
eliminated.
The high TP concentrations during the winter months at
Station 5 and Station 30 are largely attributable to the
inputs of phosphorus-rich suspended clays from the Haw River
and New Hope River, respectively (Weiss and Francisco 1984).
Station 10, being further removed from point source
discharges, ͣ is less severly impacted by high point souce
flows, as is evidenced by decreased variabilty in TP
concentrations compared to Stations 5 and 30 (Figure 5>.
Kuenzler and Greer (1980> found significantly lower values
of TP in University Lake, which, while being in close
proximity to Jordan Lake, is not subjected to the large
amounts of industrial discharges and agricultural runoff
During the summer months* increasing water residence times occur (Weiss and Francisco 1984>, allowing for the development of greater algal biomass (Figure 4>. The increase in biotic activity is likely the cause of reduction of FRP at Stations 5 and lO to low levels; however, at Station 30, inputs of Haw River water appear to maintain
significant levels of FRP throughout the warm season
(Figure 6).
Mean annual chlorophyll-a concentrations were highest
at Station 5 (x=59.3 ug 1~1) and lowest at Station 30
(xs26.5 ug 1~^}, despite the abundance of phosphorus at this
station. These patterns are similar to those found by Weiss and Francisco (1984) and indicate phosphorus limitation is
unlikely at Station 30.
Particulate phosphorus and chlorophyll-a were poorly correlated throughout the year (Table 9>, probably because the PP fraction was often composed of large amounts of suspended sediment-bound phosphorus and possibly also due to
algal storage of polyphosphates. From May to September, when algal biomass was high (Figure 4> and suspended
sediment concentrations decreased, the PP-chlorophyll correlation coeffficient increased at all stations, probably because of an increase in the relative proportion of algal
P per unit PP. Additionally, the slopes of the
chlorophyll-PP regression line at Stations 5 and 30 increased in the Hay
to September period, indicating more chlorophyll per unit
Table 9. Regression analysis of particulate P-chlorophyll relationships for surface waters of Jordan Lake from April 1984 to January 1985, and May 1984 to
September 1984.
sssssscsssSBSSSSSSSSSSXSSSassSSSSSSSSBKSSSSXZ
DATE STATION r SLOPE n
APR-JAN 5 .104 .49 9
10 .200 1.67 9
30 .379 .07 9
ALL .229 .14 27
MAY-SEP 5 .496 1.38 5
10 .495 1.51 5
30 .699 .65 5
ALL .432 .90 15
summer months (Hay to September) and the April to January
period, indicates a relatively constant chlorophyll-PP relationship, likely because of the decreased importance of suspended solids at this station. Future studies of
phosphorus dynamics in Jordan Lake and in other systems
impacted by heavy inputs of inorganic particulate phosphorus
should consider including measurements of algal phosphorus
(see Kuenzler et al 1979) to allow for more critical
analyses of phosphorus-algae dynamics.
n:p ratios
The Redfield ratio (Redfield 1954>, based on the observation that N:P ratios of oceanic waters (7.2:1 by
limitation. This approach la complicated* however, by such
factors as problems in accurately measuring orthophosphate
(Rigler 1966), phosphorus storage capabilities (Reynolds
1984>, and In variations between algal species In the
optimum N:P ratios for growth (Rhee and Gotham 1980). Based
on DINrDIP ratios <NH4+N03*N02/FRP) calculated for Jordan
Lake (Figure 12), phosphorus limitation frequently occurs at
Station 10, occasionally at Station 5, and rarely at Station
30. During the winter months, high N:P ratios frequently
occur implying a potential scarcity of phosphorus realatlve
to nitrogen, however, high concentrations of phosphorus
also prevail (Figure 6), often significantly above the
DIN/DIP RATIO
HO X C D. O Z S 35 30 -25 20 15 10 5 -0 s s s s s s s s \ s \ \ \ \ \ \ \ \ \ 7n /\
/ͣ\y
\ \ \ \ \ \ \ \ \ \ 1^ A S s s s s \ s s s ͣ \ \ \ \ \ \ \ \ r-\ ''\ y\ /N /, ^i M ri 'M \ \ \ y\ kh^ s s s s \ N \ \ \ \ \ ''\ /,
Hn^
/\ /\ /\ /\ /\ /\ /s /\ /\ /\ /\ /\ /\ /\ /\ y\ ^\ y\ y\ /\y /\y .''\y. /\'/, /\ /\ /\ /s /s /s ^\ ''\ /\ /\ ^\ /\ /\ ^\ \ \ \ \ \ V \ V s s s s s /s /s /s /s /s /\ A kt^pTT) STA 5 KS] STA 10____ DATE V7Z\ STA 30