su1..- JUL. 10. 2003~< 9:04Aivl~'~ DUKE CL!N. M!CRO. NO. 262
Neissetta menlngtttdil Outbreaks
inthe ·United States,
1994·1001By
Rich!lfd B. Brooks
A Mastu's paper 11\lbm.ltted
to
the faculty of
Ihe University cfNorth Carolina at Chapel Hill
In
partial fulfilhnent of' the
requirement
for
The deg!'ee ofMaster
ofPT.l~HcHealth in
The Public Health Leadership Program.
Chapel
Hill
2003
P. 3 ,.. - "'"'
ABSTRACT
Background: Outbreaks of meningococcal disease are infrequent but important
public health events. Epidemiological characteristics of outbreak-associated cases
compared with sporadic disease are not well described.
Methods: Outbreaks of meningococcal disease from 7/1/94-6/30/02 were
identified through state health departments, CDC records, and newspaper and
medical literature review. An outbreak was defined as three primary patients with
meningococcal disease caused by the same serogroup within 3 months in a
community, or two patients in an institution, resulting in an attack rate of
2:10/100,000 population. Cases associated with outbreaks were compared with
sporadic cases identified through population-based surveillance.
Results: We identified 76 outbreaks over the 8-year period of the study, which
gave a median of 10 outbreaks per year (annual median= 10, range 4-16) involving
a total of247 patients (annual median=30, range 8-92) from 32 states. Forty-eight
(63%) of the outbreaks were serogroup C, 19 (25%) were serogroup B, and 9
(12%) were serogroup Y. Twenty-six (34%) outbreaks occurred in communities,
representing 53% of cases; 50 (66%) outbreaks were institution-based, including
13 colleges and universities, 19 primary and secondary schools, and 9 nursing
homes. Vaccination campaigns (NC/Y/W-135 meningococcal polysaccharide
vaccine) were conducted in 34 outbreaks (30 serogroup C, 4 serogroup Y)
utilizing 2,500 doses/outbreak. After controlling for age, serogroup, and clinical
presentation, outbreak-associated cases had a higher case-fatality rate than
sporadic cases [21% vs. 11%, Odds Ratio (OR) 2.1, 95% confidence interval (CI)
1.4-3.1].
Conclusions: Certain clones of N. meningitidis with genetic factors that favor
their transmission and increase their virulence may be responsible for most
outbreaks, resulting in higher case fatality rates for outbreaks compared to
sporadic disease. However, further research is needed to elucidate the reasons for
this difference.
~--L
L
L
I
r
+---INTRODUCTION
Neisseria meningitidis is a gram negative diplococcus capable of causing
several clinical syndromes including meningitis, bacteremia accompanied by
sepsis and rash, and pneumonia.1 At any given time, N meningitidis is found
living in about 5-10% of the general population's nasopharynx.1 Most individuals
living in the United States carry non-pathogenic strains of the bacteria and will
!
not develop disease; even those carrying pathogenic strains usually do not become l
~
ill.1 Transmission occurs between humans through direct contact with respiratory
i
secretions from a nasopharyngeal carrier. 2
Infection with N meningitidis is a serious and potentially fatal disease. In
patients from whom N meningitidis is isolated from their cerebrospinal fluid,
about 13% will die; roughly 11.5% of persons who haveN meningitidis isolated
from their blood will die.3 Among patients who recover, 10-15% will have
serious sequelae, such as permanent hearing loss, mental retardation, or loss of
limbs.2 While meningococcal disease is responsive to antibiotic therapy,
potentially reducing the risk of dying to below 15%,2 it is important to start
treatment as early in the course of disease as possible since symptoms can
progress rapidly over the course of just a few hours.
Overall, an estimated 2,400 to 2,600 cases of meningococcal disease occur
;___
f--Studies have shown that the frequency of meningococcal disease outbreaks in the
U.S. increased during the first half of the 1990s.5-6 Both outbreak-associated and
sporadic meningococcal disease occur in the U.S.; however, only 2% of cases are
associated with outbreaks. 5 Infants and young children are at highest risk for
invasive disease/ and other studies have shown that college freshmen living in
dormitories are at elevated risk of disease compared to the general population. s-9
Characterized by antigenic differences in their polysaccharide capsules,
four different serogroups of N. meningitidis cause the majority of disease in the
United States: C, B, Y, and W -135.1 Serogroup A disease, which is endemic in
Africa, largely disappeared from the United States during the 1970s and 1980s.1
Between 1989 and 1991,46% of cases were caused by serogroup B, 45% by
serogroup C, 3% by serogroup W-135, and 2% by serogroup Y10 However,
surveillance between 1992 and 1996 found that the serogroup distribution had
changed: 35% of cases were caused by serogroup C, 32% by serogroup B, and
26% by serogroup Y.4 Reasons for the changing serogroup distribution are
l
unclear.
A quadrivalent vaccine consisting of purified bacterial capsular
polysaccharides from serogroups A, C, Y, and W -135 is currently available for
the prevention of meningococcal disease in the United States.3 The usefulness of
the vaccine is limited, however, due to its relative ineffectiveness in children
under 2 years of age and its short duration of protection. Antibody production
induced by serogroup A polysaccharide occurs in some children as young as 3
until4 or 5 years of age. Recipients of serogroup C vaccine less than 18 to 24
months of age do not form an adequate immune response to confer protection
against infection. In those persons who do mount an adequate immune response
to vaccination with serogroup A and C polysaccharides, measurable levels of
antibodies fall appreciably during the first three years after inoculation, especially
in infants and children. Polysaccharides from serogroups Y and W-135 are
sufficiently immunogenic and safe only in persons over 2 years of age.3
Polysaccharides for serogroup B are not included in the vaccine because these
polysaccharides fail to induce immunity, even in adults.11
Due to the limitations of the currently available polysaccharide vaccine
and the rarity of meningococcal disease, routine vaccination of the general
population is not recommended. Use of the vaccine is limited to persons traveling
to countries with hyperendemic or epidemic meningococcal disease, high-risk
groups (e.g. military personnel and immunodeficient persons), and to prevent the
spread of vaccine-preventable disease during outbreaks.3
Given that 60% of cases of meningococcal disease are caused by
serogroups covered in the currently licensed vaccine and are thus preventable,4 it
is important that surveillance of this disease be continued. This study seeks to
describe meningococcal disease occurring in the United States between 1994 and
2002, comparing clusters of outbreak disease with more common sporadic cases.
Additionally, the specificity of the threshold for detecting outbreaks of
meningococcal disease-established by current ACIP guidelines-will be
until 4 or 5 years of age. Recipients of serogroup C vaccine less than 18 to 24
months of age do not form an adequate immnne response to confer protection
against infection. In those persons who do monnt an adequate immnne response
to vaccination with serogroup A and C polysaccharides, measurable levels of
antibodies fall appreciably during the first three years after inoculation,
especially in infants and children. Polysaccharides from serogroups Y and
W-135 are sufficiently immnnogenic and safe only in persons over 2 years of age.3
+---Polysaccharides for serogroup B are not included in the vaccine because these
polysaccharides fail to induce immunity, even in adults.11
Due to the limitations of the currently available polysaccharide vaccine
and the rarity of meningococcal disease, routine vaccination of the general
L
I
Fpopulation is not recommended. Use of the vaccine is limited to persons traveling
to countries with hyperendemic or epidemic meningococcal disease, high-risk
groups (e.g. military personnel and immunodeficient persons), and to prevent the
spread ofvaccine-preventable disease during outbreaks.3
Given that 60% of cases of meningococcal disease are caused by
serogroups covered in the currently licensed vaccine and are thus preventable,4 it
is important that surveillance of this disease be continued. This study seeks to
describe meningococcal disease occurring in the United States between 1994 and
2002, comparing clusters of outbreak disease with more common sporadic cases.
Additionally, the specificity of the threshold for detecting outbreaks of
meningococcal disease-established by current ACIP guidelines-will be
METHODS
Definitions
A confirmed case of meningococcal disease was defined by isolation of N.
meningitidis from a normally sterile site in a person with clinically compatible
illness. All isolates were serogrouped. A meningococcal cluster was loosely
defined as 2 or more patients with probable meningococcal disease who were
associated by time and place and resulted in an increased attack rate compared
with that usually observed in a defined population. We then classified clusters
according to the population affected. The cluster was institutional if all of the
case patients had a common affiliation with that institution (e.g. students at a
school, residents in a nursing home) or were household contacts of persons
affiliated with the institution. If no single institutional affiliation was identified,
the cluster was classified as community-based.
In accordance with the ACIP guidelines, we defined an institutional
outbreak of meningococcal disease as the occurrence of two or more confirmed
cases of meningococcal disease of the same serogroup during a period of three
months in persons with a common affiliation, but no close contact with each
other, resulting in an attack rate of at least 10 per 100,000 population. We
defined a community-based outbreak as the occurrence ofthree or more
confirmed cases of the same serogroup during a period of three months among
persons who resided in the same geographic area, but who were not close
contacts and did not share a common affiliation, resulting in an attack rate of at
' 1
t
'L
I
least 10 per 100,000 population. Most frequently, county lines were used to
determine denominators for calculation of community attack rates; however, city,
town, zip codes, etc. were used when appropriate.
Clinical syndromes, including meningitis, meningococcemia, and
pneumonia, were assigned by clinicians at the time of presentation and were
subsequently reported by state health departments.
Data Collection
Data on clusters of meningococcal disease cases occurring between July
I, 1994 and June 30,2002 were first obtained by searching a log of
meningococcal disease cases maintained by the Centers for Disease Control and
Prevention (CDC). The purpose of this log is to maintain communication
between the CDC and public health officials in the community so that the CDC
can be aware of possible ongoing meningococcal outbreaks and give guidance
about the need for starting a vaccination campaign or initiating a more in-depth
epidemiological investigation. Outside of this log there is no systematic
surveillance for clusters of meningococcal disease. To supplement the CDC
records, reports from each state health department were requested for all cases of
meningococcal disease clustered in time and geographic location. Data for cases
that may not have been reported to state health departments or included in CDC
records were obtained by searching MEDLINE and Lexis-Nexis Academic for
case reports or media reports of cases. Indexing terms for MEDLlNE included
"Neisseria meningitidis," "meningococcal infections," "meningococcal
L_
j
f--L
L
L
meningitis," and "disease outbreaks." In Lexis-Nexis Academic, a Guided News
Search was performed within the category "U.S. News" in the sections "Midwest
Regional News," "Northeast Regional News," "Southeast Regional News," and
"Western Regional News" using the truncated term "meningococ!" in the full text
and limited to 1997 to 2002. The results of the Medline and Lexis-Nexis
Academic searches were also used to fill in any missing data from cases and
clusters provided by the state and territorial health departments. All clusters '
L
were confirmed with the state health department.
Data on sporadic meningococcal disease for comparison to
outbreak-associated cases and for evaluation of the specificity ofthe threshold were
obtained from the Active Bacterial Core Surveillance Group (ABCs ), an active,
population-based CDC surveillance system conducted throughout the course of
the study among an aggregate population of33.3 million. It consists of all
residents from three counties in California (Alameda, Contra Costa, San
L
Francisco), five counties in Colorado (Adams, Arapahoe, Denver, Douglas,
Jefferson), fifteen counties in New York (Albany, Columbia, Genesee, Greene,
Livingston, Monroe, Montgomery, Ontario, Orleans, Rennseiaer, Saratoga,
Schenectady, Schoharie, Wayne, Yates), seven counties in Tennessee (Davidson,
Hamilton, Knox, Rutherford, Shelby, Sumner, Williamson), and the states of
Threshold Evaluation
We searched the active, population-based database from the ABCs for
clusters in which at least 3 cases occurred within a 3-month time period in the
counties under surveillance. We then calculated attack rates for those clusters
using the denominators provided by the surveillance group. As the gold standard
for a meningococcal outbreak, we used the ongoing surveillance for outbreaks
declared by state health departments.
Statistical Analysis
For analyses comparing characteristics of outbreak -associated cases,
categorical data were dichotomized and risk ratios (RRs) with 95% confidence
intervals (Cis) were calculated. Patients were divided into seven age groups
based on common characteristics of social interaction: <1 year, 1-5 years, 6-17 j__
years, 18-24 years, 25-39 years, 40-64 years, and :>:65 years. For bivariable
analyses comparing outbreak-associated disease to sporadic disease, we
calculated RRs with 95~0 Cis. Con1parisons of1nedians ¥.rere 1nade using
Wilcoxon's ranked sum test. An adjusted analysis for risk of death for
outbreak-associated disease vs. sporadic disease was performed using logistic regression.
The formal model included potential confounding variables and covariates
associated with death with p<O.l on bivariable analysis. All statistical analyses
RESULTS
Active surveillance with participation from all 50 states identified 190
clusters (3,087 cases) of meningococcal disease from 43 states that occurred, at
least in part, between July 1, 1994 and June 30, 2002. Seventy-six of the clusters
involving 247 patients from 32 states met the definition for either a
community-based or institutional outbreak, which gave a median of 10 cases per year (range
4-16) and a median of30 cases per year (range 8-92), (Fig.1). Forty-eight (63%)
of the outbreaks were serogroup C, 19 (25%) were serogroup B, and 9 (12%)
were serogroup Y. No outbreaks of serogroup A, W-135, or any other serogroup
occurred in the time period of interest. Outbreaks showed a seasonal distribution
similar to that of sporadic cases, with most cases occurring in late winter to early
spnng. Outbreak cases accounted for <2% of total cases of invasive
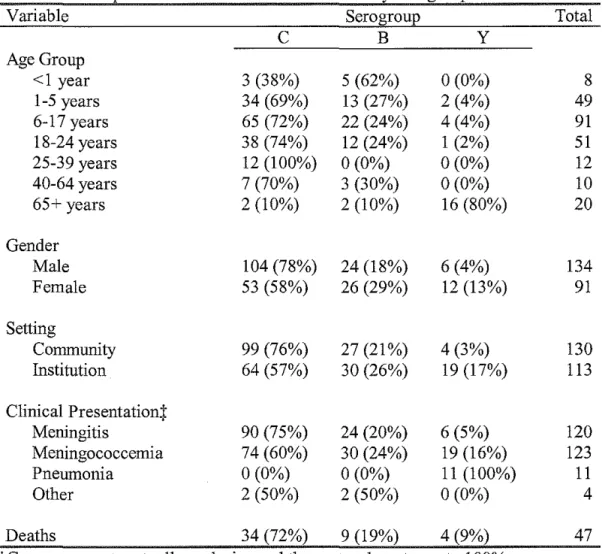
meningococcal disease each year. Table I shows characteristics of
outbreak-associated cases, stratified by serogroup.
While only 26 (34%) of the outbreaks were community-based, they
represented 53% of cases. Nineteen were serogroup C, 6 were serogroup B, and
1 was serogroup Y. The median number of cases in community-based outbreaks
was 4 (range 3-30) with 12 of26 having the minimum of3 cases. The other 50
outbreaks (65%) were institution-based, including nineteen (38%) that occurred
in primary and secondary schools, 13 (26%) in colleges and universities, and 9
(18%) in nursing homes. Other sites of institutional outbreaks included hotels
(2), a camp (1), a prison (1), a bar (1), a daycare (1), and a church (1).
Twenty-l
nine institutional outbreaks were serogroup C, 13 were serogroup B, and 8 were
serogroup Y. The median number of cases in institutional outbreaks was 2 (range
2-5) with 30 of 50 having the minimum of2 cases.
Clinical Presentation
Most cases of outbreak -associated disease presented as meningitis,
meningococcemia, pneumonia, or some combination of these syndromes. Of the
228 cases (92% of total) for which the clinical syndrome was available, 54%
presented with meningitis, 55% with meningococcemia, and 5% with pneumonia
(cases may have been diagnosed with more than one clinical syndrome). Other i
i
less common clinical syndromes included pericarditis, endocarditis, rash, and
sudden death.
Clinical presentation varied with the patient's gender and the serogroup
causing the infection. Men were more likely to present with meningitis than
women (63% vs. 47%; RR 1.3, 95% CI 1.0-1.7), and cases ofserogroup C
outbreak disease were more likely to present with meningitis than cases of
non-serogroup C disease (60% vs. 41 %; RR 1.5, 95% CI 1.1-2.0).
Few differences in clinical syndrome were noted among the different age
groups; however, patients 65 years or older were less likely to present with
meningitis than patients in other age groups (20% vs. 57%; RR 0.4, 95% CI
0.1-0.8). Additionally, all cases of pneumonia (n=ll) occurred among patients 65
Outbreak vs. Sporadic Disease
Serogroup and gender distribution differed between outbreak and
sporadic disease (Table 2). A greater fraction of outbreak-associated cases than
sporadic cases were serogroup C (67% vs. 29%; RR2.3, 95% CI 2.1-2.6),
whereas a smaller percentage of outbreak -associated cases than sporadic cases
were serogroup B (23% vs. 37%; RR 0.6, 95% CI 0.5-0.8) or serogroup Y (9% vs.
32%; RR 0.3, 95% CI 0.2-0.4). While 59% of outbreak-associated cases occurred
among males, only 51% of sporadic cases occurred among males (RR 1.2, 95%
CI 1.0-1.3).
Outbreak -associated cases and sporadic cases also demonstrated different
age distributions. Similar percentages of children 1-5 years old were infected in
outbreak and sporadic cases (20% vs. 16%; RR 1.3, 95% CI 1.0-1.6). However, a
smaller percentage of children under 1 year of age were infected in outbreaks
than in sporadic cases (3% vs. 14%; RR 0.2, 95% CI 0.1-0.5), as were adults
25-39 years old (5% vs. 9%; RR 0.5, 95% CI 0.3-0.9), 40-64 years old (4% vs. 16%;
RR 0.3, 95% CI 0.2-0.5), and 65 years or older (8% vs. 13%; RR 0.6, 95% CI
0.4-1.0). A greater percentage of children between the ages of 6 and 17 were infected
in outbreaks than in sporadic cases (37% vs. 20%; RR 1.9, 95% CI 1.6-2.3), as
were patients between 18 and 24 years of age (22% vs. 12%; RR 1.8, 95% CI
1.4-2.3). Median age for community outbreak-associated cases was 10 years, which
was lower than the median age of 18 years for sporadic cases (Wilcoxon
rank-sum, p<0.0001).
t---j
i
L
Similar rates of meningitis were seen in outbreak-associated cases and
sporadic cases (54% vs. 48%; RR 1.1, 95% CI 1.0-1.3). Pneumonia rates,
however, differed between outbreak-associated cases (5%) and sporadic cases
(9%), (RR 0.5, 95% CI 0.3-1.0). Data for clinical meningococcemia was not
available for sporadic disease.
Case-Fatality
The overall case-fatality rate for the 224 outbreak-associated cases with
available outcome data (91% of total) was 21%, regardless of whether cases were
community-associated or institution-associated. This was greater than the overall
case-fatality rate for sporadic cases (11 %), (RR 1.9, 95% CI 1.4-2.5), (Table 2).
Case fatality did not differ for the initial case in an outbreak compared to later
cases (23% vs. 20%; RR 1.2, 95% CI 0.7-2.0).
There was no difference in case-fatality rate for community-associated
outbreak cases as compared to institutional outbreak cases (20% vs. 22%; RR
1.1, 95% CI 0. 7-1.8). Considering only outbreak-associated cases, case-fatality
rates did not vary among serogroups (serogroup C 22%, serogroup B 18%, and
serogroup Y 22%), nor according to age group. Outbreak-associated cases that
presented with meningococcemia were more likely to die than
outbreak-associated cases presenting with other syndromes (31% vs. 10%; RR 3.2, 95% CI
1.6-6.2).
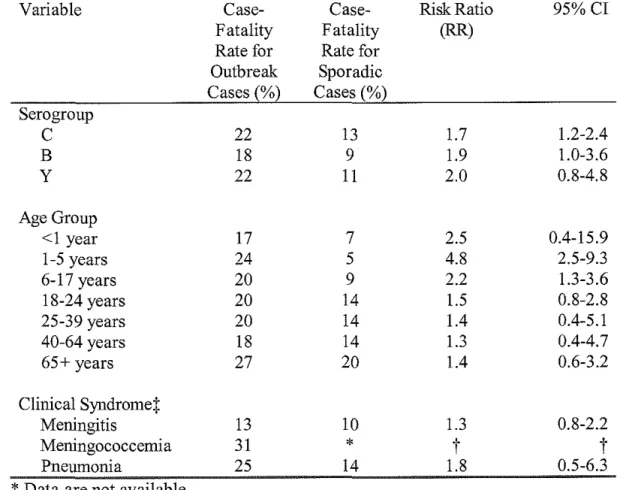
Case-fatality among serogroup C outbreak-associated cases was greater
than that ofserogroup C sporadic cases (22% vs. 13%; RR 1.7, 95% CI 1.2-2.4)
(Table 3). However, case-fatality was not greater among serogroup B outbreak
cases than serogroup B sporadic cases (18% vs. 9%; RR 1.9, 95% CI 1.0-3.6),
nor for serogroup Y outbreak cases compared to serogroup Y sporadic cases
(22% vs. 11 %; RR 2.0, 95% CI 0.8-4.8).
Case-fatality rates differed between outbreak-associated cases and
sporadic cases, according to age group (Table 3). Outbreak-associated cases
among patients aged 1-5 were more likely to die than sporadic cases among
L
patients of the same age group (24% vs. 5%; RR 4.8, 95% CI 2.5-9.3). Cases
aged 6-17 that were associated with outbreaks were also more likely to die than
sporadic cases aged 6-17 (20% vs. 9%; RR 2.2, 95% CI 1.3-3.6). Case-fatality
rates did not differ between outbreak-associated cases and sporadic cases for
other age groups. Overall, the median age of sporadic cases that had a fatal
outcome (31.3 years, interquartile range (IQR) 16.1-62.1) was greater than the
median age of community-associated outbreak cases that had a fatal outcome
(10.0 years, IQR 5.0-19.0), (Wilcoxon ranked sum, p<O.OOOl). Comparing L
outbreak-associated cases and sporadic cases, there were no differences in
case-fatality rates according to clinical syndrome.
An adjusted analysis comparing the case-fatality rate for
outbreak-associated cases with that for sporadic cases and controlling for clinical
presentation, age group, and serogroup found that the case-fatality rate was still
higher among outbreak-associated cases than among sporadic cases (adjusted
i--L
Temporal Aspects of Outbreaks
Table 4 demonstrates tbe progression of meningococcal disease outbreaks
over time by setting and serogroup. Median duration of community-associated
outbreaks (42 days, IQR 22-88 days) was longer than that of institutional
outbreaks (12 days, IQR 4-42 days), (Wilcoxon ranked sum, p=0.001). Most
cases associated with institutional outbreaks occurred during the first week,
whereas community-associated outbreaks were more prolonged. Institutional
L
outbreaks were significantly more likely to last less than 2 weeks compared to
community-associated outbreaks (52% vs. 19%; OR 2.7, 95% CI 1.2-6.2).
Median duration was equal for outbreaks of different serogroups (Wilcoxon
ranked sum, p=0.8). Serogroup C outbreaks had a median duration of23 days,
serogroup B of25 days, and serogroup Y of26 days. Additionally, 75% of
serogroup C andY outbreaks lasted fewer than 2 months, while 75% of serogroup
B outbreaks lasted fewer than 3 months.
Vaccination Campaigns
Of the 76 reported outbreaks of meningococcal disease, 57 were
serogroup C or Y, for which vaccination campaigns were considered.
Vaccination campaigns were implemented in 34 outbreaks, resulting in the use of
Threshold Evaluation
We reviewed all meningococcal cases identified through the ABC surveillance
sites and identified 149 clusters of at least 3 cases in 3 months in a single county
that occurred between June 30, 1994 and July 1, 2002. Using county populations
as denominators, 3 of the clusters met the outbreak definition by having an attack
rate of2:1 0/100,000 population. All three clusters were serogroup B and were
located in Oregon. No outbreaks were identified by the state health departments
in the surveillance area over this time period.
DISCUSSION
Active surveillance of all 50 states identified 76 outbreaks of
.
meningococcal disease, representing 247 cases. Outbreaks of Neisseria
~-meningitidis are still rare in the United States, comprising <2% of all cases.
Historically, both outbreak-associated disease and sporadic disease have been
most frequently associated with serogroup C N meningitidis.6 In the current
study, serogroup distribution of outbreak-associated cases differed from that of
sporadic cases, with outbreak-associated cases dominated by serogroup C
disease, and sporadic cases dominated by serogroup B or serogroup Y disease.
The most recent survey of sporadic meningococcal disease in the U.S. from
1992-1996 found that serogroup C disease accounted for 35% of cases, serogroup B
sporadic cases caused by serogroup C disease dropped to 29%, while the fraction
of sporadic disease caused by serogroup B increased to 37% and serogroup Y
increased to 32%.
During the eight-year time period covered by this survey, outbreaks were
reported in 32 ofthe 50 states (Fig. 1 ). Outbreaks had a broad geographical
distribution, with many outbreaks occurring in eastern Texas and central Florida.
The reason for these areas of concentration is not clear, but would seem to
suggest the introduction of more virulent clones into particularly susceptible and
immunologically na1ve populations.
Community-associated outbreaks were found to be longer in duration than
institutional outbreaks; however, this finding is likely to be an artifact of the
different definitions of community- and institution-associated outbreaks.
Community-associated outbreaks had to include 3 cases within a 3 month time
period, whereas institutional outbreaks only had to include 2 cases. If only the
first 2 cases in community-associated outbreaks with 3 cases were used to define
the duration of the outbreak, then median duration of community-associated
outbreaks dropped from 42 days to 31.5 days (IQR 11-88 days). This duration
was still longer than institution-based outbreaks, but not nearly as significantly
(p=0.04).
The greatest number of cases of outbreak-associated disease occurred in
children aged 6-17, closely followed by adults aged 18-24 and children aged 1-5.
Compared to sporadic disease, outbreaks were significantly more likely to occur
among children aged 6-17 or adults aged 18-24. Other studies have reported
]:__
I
L
similar findings for serogroup C outbreak-associated disease compared to
serogroup C sporadic disease.6 Such differences in age distribution for
outbreak-associated cases compared to sporadic cases are not surprising, given that many
people in these age groups are in primary or secondary school or college. Living
or even spending much time in such close quarters increases the ease and speed
with which infections are spread, and thus makes these individuals more likely to
contract meningococcal disease. Previous studies have shown that college
students living on campus are at increased risk of contracting meningococcal
disease. 8-9 Harrison et a!. also noted an increased frequency of meningococcal
disease among Maryland residents aged 15-24 during the first part of the 1990s.12
Gender distribution was also found to be different for outbreak -associated
cases compared to sporadic cases. Cases of sporadic disease were virtually
evenly split between men and women. However, among outbreak-associated
cases, more men than women were affected. Socialization patterns that increase
risk for contracting outbreak-associated meningococcal disease (e.g. smoking)
may be more common among men than among women and thus be responsible for
these differences.
In the current study, case-fatality rates for outbreak-associated disease
were found to be significantly higher than case-fatality rates for sporadic disease;
outbreak -associated cases were ahnost twice as likely to die as sporadic cases,
even after adjusting for age group, clinical syndrome, and serogroup. Prior
studies have reported similar associations between age, clinical syndrome, and
that certain clones of N meningitidis with genetic factors that favor their
transmission and increase their virulence are responsible for most outbreaks. A
high degree of genetic relatedness among strains of serogroup C bacteria causing
outbreaks has been reported previously;6 however, analyses of sporadic disease
have not found an association between specific enzyme types and increased
case-fatality rates.4
Multilocus enzyme electrophoresis (MEE) has historically been the
principal means of distinguishing different strains of N meningitidis from one
another; however, with the development of pulsed field gel electrophoresis
(PFGE) and polymerase chain reaction (PCR) techniques, MEE has fallen out of
favor. Due to the current lack of agreement on a standard technique for
determining bacterial strains, the current study was unable to collect data on
strains of N meningitidis implicated in the outbreaks. Once guidelines for strain
typing are established, however, studies will be able to better examine the
relationships between outbreaks and particular strains of N meningitidis.
Host factors that make certain persons more susceptible to catching
disease and dying from it may also contribute to the increased fatality rate found
among outbreak-associated cases. Another possible explanation is the existence
of an ascertainment bias--cases that have a fatal outcome are more likely to be
noticed by public health departments and thus the outbreaks related to them are
more likely to be reported. However, if such a bias existed, the frequency of death
the current study, however, initial cases were equally as likely to die as later
cases.
The importance and legitimacy of comparisons of clinical presentation are
difficult to assess given the inherently vague and subjective way in which clinical
presentation was defined. Given that many of the signs and symptoms used to
make these diagnoses are non-specific, there is a good possibility that some
patients were incorrectly diagnosed, especially iflaboratory cultures were not
drawn to back up clinical findings. Furthermore, differences seen between
patients presenting with meningitis and those presenting with meningococcemia
are suspect since patients with meningitis are presumed to have been bacteremic
at some point during the course of disease. Of course, bacteremia does not
inevitably lead to meningococcemia, so it is possible for patients to have
meningitis but not meningococcemia.
With these caveats in mind, however, distinct patterns of clinical
syndromes were noted among outbreak-associated cases. Men were more likely
to present with meningitis, while women were more likely to be diagnosed with
meningococcemia or pneumonia. Given that cases presenting with
meningococcemia were found to be at higher risk for death, it was expected that
women would be at greater risk of death; however, this expectation did not
hold~men and women were found to be equally at risk of death. All
outbreak-associated cases of pneumonia occurred among individuals over 65 years of age;
furthermore, 80% of those over 65 were women. This explains in part why
clinical syndrome would vary with gender are unclear. Such findings seem more
likely to be due to biases in the clinical care that men and women receive (and
thus differences in received tests and diagnoses) than in physiologic differences
between the two sexes.
Clinical presentation among outbreak-associated cases was also found to
vary according to serogroup, with serogroup C cases more frequently presenting
as meningitis and serogroup Y cases more frequently presenting as
meningococcemia or pneumonia. These differences may be ascribed to
differences in bacterial characteristics among the different serogroups of N
meningitidis. Different serogroups may harbor "trophic" factors that direct them
to different areas of the body. For example, serogroup C bacteria may have
genetic factors that enable them to preferentially inhabit the CSF while serogroup
Ybacteria may have ones that enable them to preferentially survive in the blood
or lungs. The association of serogroup Y disease with pneumonia has been
previously reported. 4 Alternatively, these differences may again be explained by
biased assessments and diagnoses made by clinicians.
Rates of pneumonia were found to be higher among sporadic cases than
among outbreak-associated cases. This is likely due to the fact that serogroup Y
N meningitidis, the primary cause of meningococcal pneumonia, was much more
common in sporadic disease than outbreak -associated disease.
Upon reviewing the ABC surveillance data for evaluating the threshold
definition for outbreaks, we found 3 clusters of serogroup B disease in Oregon
experiencing hyperendemic serogroup B disease in recent years (CDC,
unpublished data), the state health department did not report any clusters that
met our definitions of outbreak disease. However, the current ACIP definition
was primarily created to detect outbreaks of serogroup C disease in an effort to
establish guidelines for when to implement vaccination campaigns and prevent
the further spread of disease. Since serogroup B disease is not preventable with
the current vaccine, there was no need for the state health department in Oregon
to declare these clusters to be outbreaks once they reached an attack rate over
10/100,000 population. The fact that no other clusters of cases among the ABCs
data met the outbreak definition and no outbreaks were identified by state health
departments suggests that the specificity of the current threshold is high. It is
thus unlikely that vaccination campaigns are being initiated unnecessarily.
Current ACIP guidelines recommend initiating vaccine campaigns for
situations in which 3 or more cases of meningococcal disease have been identified
in a community or institution in :S3 months and the primary attack rate is
2::10/100,000 population. In institutional settings, however, the occurrence of
even 2 cases in a such a short time-period may warrant consideration of a
vaccination campaign, given the rarity of meningococcal disease and thus the
unlikely circumstance that the two cases are unrelated. The appropriateness of
this outbreak definition and prompt assessment of potential outbreaks are
important public health issues given the high morbidity and mortality associated
with meningococcal disease, as well as the high expense associated with
likely to be even higher in outbreaks. Given the current ACIP guidelines' high
threshold for detecting meningococcal outbreaks, we recommend their continued
use for assessing potential outbreaks and for deciding the appropriate time to
implement prophylaxis and vaccination campaigns.
REFERENCES
1
Wenger JD, Jackson LA, Raj P, Tonelli MJ. Issues in the control of
outbreaks of group C meningococcal disease in the United States. Infectious
Diseases in Clinical Practice 1994;3: 136-140.
2
Centers for Disease Control and Prevention: Division ofBacterial and
Mycotic Diseases. Disease information: meningococcal disease.
http://www.cdc.gov/ncidodldbmdldiseaseinfo/meningococcal_g.htm Accessed
March 18,2003.
3
Centers for Disease Control and Prevention. Control and prevention of
meningococcal disease and Control and prevention of serogroup C
meningococcal disease: evaluation and management of suspected outbreaks:
recommendations of the Advisory Committee on Immunization Practices
(ACIP). MMWR 1997;46(No. RR-5):1.
4
Rosenstein NE, Perkins BA, Stephens DS, et al. The changing epidemiology
of meningococcal disease in the United States, 1992-1996. J Infect Dis.
1999; 180:1894-901.
"woods CW, Rosenstein N, Perkins BA. Neisseria meningitidis outbreaks in
the United States, 1994-97. In: Abstracts of the 381h annual meeting of the
Infectious Diseases Society of America (Denver) [abstract 125FR].
6
Jackson IA, SchuchatA, Reeves MW, and Wegner JD. Serogroup C
meningococcal outbreaks in the United States: an emerging threat. JAMA.
1995;273:383-9.
7
Jackson IA, Wenger JD. Laboratory-based surveillance for meningococcal
disease in selected areas, United States, 1989-1991. MMWR CDC
Surveillance Summary. 1993;42:21-30.
8Harrison LH, Dwyer DM, Maples CT, and Billmann L. Risk of
meningococcal infection in college students. JAMA. 1999;281 :1906-10.
'13ruce MG, Rosenstein NE, Capparella JM, et al. Risk factors for
meningococcal disease in college students. JAMA. 2001;286:688-93.
10
Schuchat A, Robinson K, Wenger JD, et al. Bacterial meningitis in the
United States in 1995. NEJM. 1997;337:970-976.
11
Wyle FA, Artenstein MS, Brandt BL, et al. hnmunologic response of man to
group B meningococcal polysaccharide vaccines. J Infect Dis 1972;
126:514-21.
12
Harrison LH, Pass rnA, Mendelsolm AB, et al. Invasive meningococcal
disease in adolescents and young adults. JAMA. 2001 ;28
l
i
-
Fig. 1. Geographic Distribution of Meningococcal Outbreaks, July 1, 1994 to June 30, 2002
Mankato, MN 1995
Fon duLac Indian Reservation, MN 1998
'"
Alliance, OH 200 I qqffofumbusf OH 2000
Washington,2002 - ~\
=s;
~"£~W!lhston, ND 1999 \:
) 'i
Sacramento. L-~u
Sonoma Co., CA 2 0 0 a
-Mendacino, Ca 1995 _
=---\~
Nevada Co., CA 2000Maricopa Co, AZ I
NW New Mexico,
•
..
";'...
•
e
Community outbreakX Organization-based outbreak
Woden, TX 1995 Conroe, TX 200 I Humble, TX 200 I New Caney, TX 2001
Gregg Co, TX 1994 Worth, TX 1996 Dallas, TX 2002
::..--Massachusetts, 1995, 1997, 1998 Connecticut. 1997, 2001
· Abington, PA 2001; York Co., PA 2000;
~
Indiana University, 1995. . Mennonite
Loyola Umverslty,1997
:!Ill Virginia 1995, 1996 Settlement,
;zennessee 1996, 1997, 1997 Putnam Co., FL 1998 Hernando Co., FL 1997 '-Tropical Acres, FL 1995
Crestview, FL 1997
PA 2001
Table I. Description of Outbreak-associated Cases by Serogroup
Variable Serogroup Total
c
B yAge Group
<I year 3 (38%) 5 (62%) 0 (0%) 8
1-5 years 34 (69%) 13 (27%) 2 (4%) 49
6-17 years 65 (72%) 22 (24%) 4(4%) 91
18-24 years 38 (74%) 12 (24%) 1 (2%) 51
25-39 years 12 (100%) 0 (0%) 0 (0%) 12
40-64 years 7 (70%) 3 (30%) 0 (0%) 10
65+ years 2 (10%) 2 (10%) 16 (80%) 20
Gender '
Male 104 (78%) 24 (18%) 6(4%) 134
L
Female 53 (58%) 26 (29%) 12 (13%) 91
'
Setting
f=
fCommunity 99 (76%) 27(21%) 4 (3%) 130
Institution 64 (57%) 30 (26%) 19 (17%) 113 l
l
"'
Clinical Presentation:j:
•
Meningitis 90 (75%) 24 (20%) 6 (5%) 120
I
Meningococcemia 74 (60%) 30 (24%) 19 (16%) 123 t
Pneumonia 0 (0%) 0 (0%) 11 (100%) 11
Other 2 (50%) 2 (50%) 0 (0%) 4
Deaths 34 (72%) 9 (19%) 4 (9%) 47
:j:Groups are not mutually exclusive and thus rates do not sum to 100%
~
L
Table 2. Characteristics of Outbreak-Associated Cases Compared to Sporadic Cases
Variable No. of No. of Risk Ratio 95%CI
outbreak- sporadic (RR)
associated cases(%)
cases(%) Seroroup
c
163 (67.1) 583 (28.6) 2.3 2.1-2.6B 57 (23.4) 749 (36.7) 0.6 0.5-0.8
y 23 (9.5) 663 (32.5) 0.3 0.2-0.4
•
W-135 0 (0) 44 (2.2)
t
t
I
Male Gender 135 (59.0) 1187 (50.5) 1.2 1.0-1.3
L
Age Group
<1 year 8 (3.2) 324 (13.8) 0.2 0.1-0.5
l=
1-5 years 50 (20.2) 382 (16.3) 1.3 1.0-1.6
g-6-17 years 91 (36.8) 462 (19.7) 1.9 1.6-2 .. 3
18-24 years 53 (21.5) 286 (12.2) 1.8 1.4-2.3
k
25-39 years 12 (4.9) 216 (9.2) 0.5 0.3-0.9
40-64 years 11 (4.5) 370 (15.7) 0.3 0.2-0.5
I
65+ years 20 (8.1) 306 (13.0) 0.6 0.4-1.0
~
Clinical Presentation:j:
Meningitis 122 (53.7) 1118 (47.6) 1.1 1.0-1.3
Meningococcemia 126 (55.8)
*
t
t
Pneumonia 11 (5.1) 206 (9.2) 0.5 0.3-1.0
Death 48 (21.1) 261 (11.3) 1.9 1.4-2.5 t ~
*
Data are not availablet
Value cannot be calculatedTable 3. Case-Fatality Rate of Outbreak-Associated Cases Compared to Sporadic Cases
Variable Case- Case- Risk Ratio 95% CI
Fatality Fatality (RR)
Rate for Rate for
Outbreak Sporadic
Cases(%) Cases(%)
Serogroup
c
22 13 1.7 1.2-2.4B 18 9 1.9 1.0-3.6
y 22 11 2.0 0.8-4.8
Age Group
<1 year 17 7 2.5 0.4-15.9
1-5 years 24 5 4.8 2.5-9.3
6-17 years 20 9 2.2 1.3-3.6 •
18-24 years 20 14 1.5 0.8-2.8
~
~
25-39 years 20 14 1.4 0.4-5.1
40-64 years 18 14 1.3 0.4-4.7
65+ years 27 20 1.4 0.6-3.2 L
I
Clinical Syndrome:j:
Meningitis 13 10 1.3 0.8-2.2
,--Meningococcemia 31
*
t
t
Pneumonia 25 14 1.8 0.5-6.3
*
Data are not availablet
Value cannot be calculatedTable 4. Progression of meningococcal disease outbreaks in the United States, July l, 1994-June 30 2002
'
STATE SETTL'lG GROUP WEEKI WEEK2 WEEK3 WEEK4 WEEKS WEEK6-10 WEEK 11-15 WEEK 16-20 WEEK>20
Alaska community b 1 1 l l
California commllility b 1 1 1 2
Florida community b 4 1 l 2 1
Ge~~ci~ community b l 2
Missouri community b 1 1 1 1 1
Wisconsin community b 1 2
Arkansas institution b 2
California institution b 3 (l) 1 Connecticut institution b 1 1
Florida institution b 2 (!) 1
Florida institution b 2 2
Florida institution b 2 1
Iowa institution b 1 1
Kansas institution b 2
New Hamnshire institution b 2 1
North Carolina institution b 1 1
Vermont institution b 2
Vi;;iuia institution b 2 Washimrton institution b 5
California conununity c 1 3 2
Connecticut community c 1 1 1
Florida cormnunity c 2 2 1
Florida community c 2 I '
Florida community c 3 1 2 1
Geo-;:;ia community c 1 3
Illinois community c 4 '
Illinois connnunin. c 1 4'
Iowa community c 1 2
Kentucky community c 1 1 1
Minnesota community c 6 1* l '
Minnesota community c 1 1 2
Missouri community c 1 4(2) 1
New Mexico community c 4 2' 1 North Dakota community c 3(1)
Texas community c 1 2 *
Texas community c 2 1 2' 1 1 22
Texas community c 1 3
'
Wisconsin community c 1 1 1 1 l
California institution c 2
California institution c 3
California institution c 1 1
Colorado institution c 2
Maryland institution c 1 1'
Maryland institution c 1 2(1)
Massachusetts institution c 2
MicbJ;an institution c 2
Missouri institution c 2
New Hamoshire institution c 2(1) New York institution c 2
Ohio institution c 2 1
Pennsylvania institution c 1 1
Pennsylvania institution c 1 1
Pennsylvania institution c 1 1
South Carolina institution c 1 1 1
Tennessee !institution c 1 2 Tennessee institution c 2
Texas institution c 1 1 2'
Texas institution c I I I *
Texas institution c 3(2) '
Texas institution c 2(1) '
Texas institution c 2 ' 1
Virginia institution c 2 1 '
Virginia institution c 1 2
Virginia institution c 3
Washington institution c 1 1'
Washington institution c 1 1 1
Pennsylvania community y 2(1) 2(1)
Arizona institution y 2 I
'
Louisiana institution y 1 I
Massachusetts institution y 2(1)
New York institution y 1 I
North Carolina institution y 2
Ohio institution y 2
Ohio institution y
Virginia institution y I 1
~ Imtlatwn ofvaccmatwn campmgn