Qichen Yu. Apply Text Mining Analytics to Virtual Reference Services: A Case Study on the Email Q & A Service at an Academic Health Sciences Library. A Master’s Paper for the M.S. in I.S degree. May, 2018. 52 pages. Advisor: Fei Yu
Academic libraries receive and reply numerous of patrons’ emails via their virtual reference service, such as Ask a Librarian. This paper presented a text mining approach to analyzing one-year email records accumulated from the Ask-a-Librarian service by the Health Science Library (HSL) at the University of North Carolina at Chapel Hill. This study will help HSL improve their email service by revealing key topics from user questions and the characteristics of user information seeking behavior.
Headings:
Electronic reference services (Libraries) Email
Information visualization
by Qichen Yu
A Master’s paper submitted to the faculty of the School of Information and Library Science of the University of North Carolina at Chapel Hill
in partial fulfillment of the requirements for the degree of Master of Science in
Information Science.
Chapel Hill, North Carolina
April 2018
Approved by
Table of Contents
INTRODUCTION ... 2
LITERATURE REVIEW... 4
LIBRARY ONLINE VIRTUAL REFERENCE SERVICE ... 4
DATA MINING ... 5
TEXT MINING... 6
DATA VISUALIZATION ... 8
METHOD ... 10
DATA COLLECTION ... 11
DATA PROCESSING ... 12
DATA SELECT AND DATA CLEAN ... 12
DDTA ANALYSIS ... 14
DATASETS BUILD ... 16
TEXT MINING FOR TOPIC EXTRACTION ... 16
RESULT ... 18
BASIC STATISTICAL ANALYSIS OF EMAIL RECORDS ... 18
Q&ATEXT ANALYSIS ... 23
TOPIC EXTRACTION AND VISUALIZATION ... 28
DISCUSSION ... 40
NOTES ... 45
Introduction
The Health Sciences Library (HSL) of the University of North Carolina at Chapel Hill provides online Questions and Answers(Q&A) services to faculty, staffs, students, and researchers. The HSL supports online Q&A services in two ways, which are live chat online and emails. Large amounts of questions and answers email records have been accumulated from the HSL virtual reference services. These email records can provide librarians with useful information, such as what kinds of questions that users frequently asked, what most users want to know, etc. Information like that will be helpful for the HSL to learn about users’ information needs. However, since there are too many questions out there, it is hard for library staff to read and answer them all. What’s more, when librarians have to answer similar questions repeatedly, the online reference service becomes very time consuming.
The goal of this study is to support and improve the HSL email service by mining and analyzing the email Q&A corpus. To accomplish the research goal, this project is designed to answer the following research questions:
● What are the characteristics(affiliations, status, etc) of users that use email Q&A service?
● What kinds of topics are mostly mentioned in email Q&A records?
Literature Review
Library online virtual reference service
In recent years, more and more academic libraries have applied virtual reference like online chat reference services into practice work as alternatives to traditional face-to-face reference (Radford & Connaway, 2007). The first use of virtual reference in library was in the late 1980s, libraries adopted email as a form which allowed users to send questions to reference librarians and receive a response, usually within 24 h and often much more quickly (Lee, 2004). Virtual reference has evolved over the past decade to include e-mail, knowledge-based services, chat, SMS text-messaging, telephone and video based interactions (Yang & Dalal, 2015). Study on the virtual reference interactions can be useful for librarians to improve the web virtual service of libraries (Finnell & Fontane, 2010).
types, in the email service most questions (52%) were in-depth questions (Greenberg & Bar-Ilan, 2015).
Data mining
The rapid progress in digital data acquisition has led to the fast-growing amount of data stored in databases, data warehouses or other kinds of data repositories (Zhou, 2003). From database perspective, data mining is a kind of knowledge discovery in databases, also known as KDD (Chen, Han, & Yu, 1996). According to Fayyad et al. (Fayyad, Piatetsky-Shapiro, & Smyth, 1996) , KDD can be defined as “nontrivial process of identifying valid, novel, potentially useful, and ultimately understandable patterns in data”. The whole KDD process has several key steps: data cleaning, data reduction and transformation (data integration), data mining, pattern evaluation and then knowledge discovered (Han and Kamber, 2001). It is without doubt that data mining is considered as a central step in the process that involves extracting patterns from data (Chang and Chen, 2006).
The general definition of data mining is the application of specific algorithms to uncover useful information from a large degree of data, and its purpose is to explore interesting knowledge from a database, data warehouse, or some other large information storage repositories (Han and Kamber, 2001, Liu, H., & Motoda, H. 1998).
Data mining is motivated by the need of new techniques to help analyze,
web intelligence, etc. (Fong et al., 2002; Han and Chang, 2002; Hui and Jha, 2000, Ngai, E. W., Xiu, L., & Chau, D. C, 2009).
The common model functions in the current data mining algorithms include classification, regression, clustering, association rules, rule generation, summarization, dependency modeling, and sequence analysis (Mitra et al, 2002).
Text mining
Text mining, also known as text data mining or knowledge discovery from textual databases, refers generally to the process of extracting interesting and non-trivial patterns or knowledge from unstructured text documents. It can be viewed as an extension of data mining or knowledge discovery from (structured) databases (Fayyad, U., et al, 1996, Tan, A.-H. & Teo, C. 1998). As the most natural form of storing information is text, text mining is believed to have a commercial potential higher than that of data mining. But text mining is also a much more complex task than data mining as it involves dealing with text data that are inherently unstructured and fuzzy.
Since users require tools to compare the documents and rank their importance and relevance, text mining has become popular and an essential theme in data mining
(Rajman, M., & Vesely, M. 2004. Sirmakessis, 2004. Dörre, et al, 1999. Grobelnik, M.et al,2000.)
For now, text mining is a multidisciplinary field, involving information retrieval, text analysis, information extraction, clustering, categorization, visualization, database technology, machine learning, and data mining (Tan, A. H., 1999).
In library services, text mining is mostly used for recommending selection (Chen & Chen, 2007), Chen proposed a recommendation system architecture which can enable customized services and management in the digital library. The association rules and clustering along with the data mining methods have been applied to discovering the most adaptive readers of a book. The whole architecture includes three parts, first, records in the digital library are clustered according to the characteristics of readers. The proposed approach utilizes the automatic clustering feature of the Ant Colony Clustering
Algorithm(ACO) to form a user group with similar properties. Second, based on minimal support and confidence, the Apriori Algorithm is used to exhibit the ability of locating the associated rules between subjects to generate recommending rules. The association rules will be used to judge which books borrowed by the readers in the same cluster are used as the basis for book recommendation. Finally, an automatic online recommendation system is proposed.
In business area, text mining could be used to determine personal preference and to provide related product information in order to raise the level of consumption
(Agrawal et al., 1993). Applying data mining techniques in a digital library service is also considered a trend as it can automatically retrieve useful knowledge by user profiles and provide the function of statistical analysis. For example, filtering through popular topics from each user’s borrowing history can help promote book circulation in the library.The digital library can also use functions of statistical analysis along with data mining to provide information on books, articles, topics and other long-term personal services for promoting circulation(Chen & Chen, 2007).
Data Visualization
According to Azzam (2013), data visualization is a very broad concept. Generally, data visualization is a process based on qualitative and quantitative data, then results in an image that represents the raw data. The image is readable by viewers and supports exploration, examination and communication of the data (Kosara,2007).
As a powerful tool to present data, data visualization has been applied to numbers of fields, and a variety of tools have been invented to help with data visualization. For instance, Mallon (2015) introduced several useful visualization tools and provided examples of the usage, such as Piktochart and Mapbox. In 2017, Pomarede and his coworkers used a visualization software to help the advances of extragalactic
Method
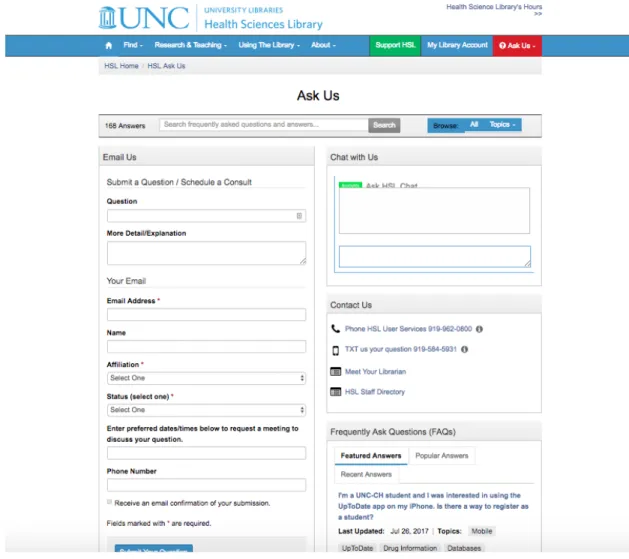
Figure 1. HSL, “Ask Us” webpage
Data collection
The email records was collected by the User Services Department at the HSL. For this project, I received a dataset including email records from January 2016 to December 2016 in .csv format.
phone number. What’s more, the records also contain other information created by
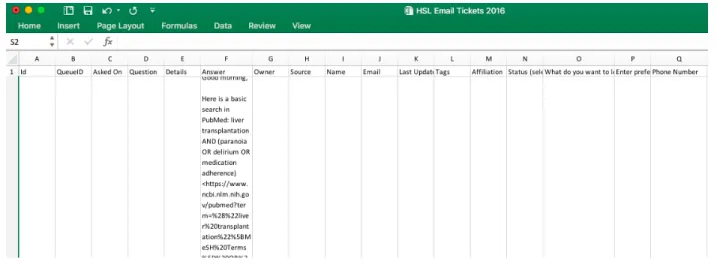
librarian, such as answers for users ‘questions, date of questions submit via Email us, etc. An example of the original email records is shown in the following screenshot (Fig.2).
Figure 2. Email records from HSL
Data processing
Data select and data clean
To address the research questions of this project, I identified the following 9 key fields in an email record (Table 1).
Table 1 Data Fields Information
Field Name Type Description
ID Number The unique identification of
system
Asked on Date The date that users send
emails to HSL, recorded by system
Question Text The subject of users’ email,
required
Details Text The main content of users’
Answer Text The content of email from
librarians
Affiliation Text The affiliation of users,
required
Status Text The status of users, required
What do you want to learn Text The brief topic of user’s question given by librarians, not required
Preferred date for meeting Text The time users want to set a meet with librarians, not required
Before data cleaning, I used python to count the word frequency of text in “Question”, “Details” and “ Answer” fields, and added high frequency but meaningless word into stop-words list imported from nltk.corpus (citation info…). For instance, “hello,” “hi,” etc. Then I used python to clean the data, including:1) transferring all letters into lower-case, 2) removing html tags and “\n”, 3) removing stop-words.
Data analysis
This section is mainly about encoding the value of “Preferred date for meeting” field. Because users can input any information or leave this field blank as they want, which is difficult for further analysis (Fig.3). Based on users input in this field (i.e., preferred data for meeting), I encoded the value into 5 categories (Table 2).
Figure 3. Examples of “Preferred date for meeting”
Table 2. Categories of “Preferred date for meeting”
Category Description
ASAP Clearly indicate that users want to meet soon Anytime Clearly indicate that users want to meet and
are flexible about the time
Time preferred1 Clearly indicate that users have requirements
No need Clearly indicate that users do not require for meeting
N/A No response of blank
Then the five categories were grouped into two clusters based on whether the users showed any desire for a meeting or not. The structure of the “Preferred date for meeting” field is as below (Fig. 4). In order to be more specific in text mining analysis, I changed the name of “Preferred date for meeting” to “Ask for meeting”, and the value of “Ask for meeting” field is Boolean type as “Yes” or “No”.
Figure 4. Structure of the “Preferred date for meeting” field
Ask for meeting
Yes
No
ASAP
Anytim
e
Time
prefered
No
Datasets build
In this section, I built several sub-datasets from the full 776 records data using OpenRefine tool2,and I only extracted “Question”, “Details” and “Answers” values
according to research purpose.
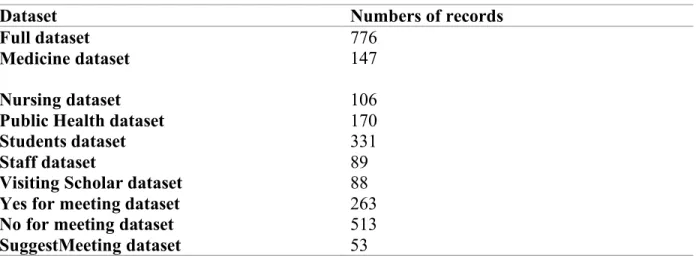
The sub-datasets were built from the three fields: Affiliation, Status, and Ask for meeting. For the Affiliation and Status fields, I built datasets of groups that obtain most numbers of records (Please see Basic statistical analysis of Email records section for more details).Thus, I got Medicine dataset, Nursing dataset, Public Health dataset, Students dataset, Staff dataset and Visiting scholars dataset. For the “Ask for meeting” field, I divided the records into two datasets based on value “Yes” or “No”, and then I extracted records from No-Dataset which librarians suggest to meet and put these records into a new dataset, named this dataset as SuggestMeeting. So, in all, I have 10 datasets for next step analysis (Table 3).
Table 3. Datasets and numbers of records
Dataset Numbers of records
Full dataset 776
Medicine dataset 147
Nursing dataset 106
Public Health dataset 170
Students dataset 331
Staff dataset 89
Visiting Scholar dataset 88
Yes for meeting dataset 263
No for meeting dataset 513
SuggestMeeting dataset 53
Text Mining for topic extraction
Python was mainly used for basic analysis of text, including average sentence length, term frequency count of each question, Details and Answers. In order to get accurate length of each sentence, I used original data version that did not gone through removing stop-words process. For the term frequency count, I used the cleaned dataset and set the number of words in a term as 2.
LightSIDE is a free and open text mining tool developed by Carolyn Penstein Rose at Carnegie Mellon University. LightSIDE provides a key enabling technology for research in the area of automated analysis of conversational interactions as well as analysis of the social aspects of text (i.e., perspective modeling, sentiment analysis, and opinion mining) LightSIDE was mainly used to see the correlation between the top 20 features selected by Python and Ask for meeting, then build a Linear regression model to predict whether a user asks for a meeting in his/her email.
VOSviewer was developed by Nees Jan van Eck and Ludo Waltman at the CWTS Leiden of Leiden University in Leiden. This software tool offers text mining functionality used to construct and visualize co-occurrence networks of important terms extracted from a body of scientific literature. I used VOSviewer to extract and visualize topics of
questions and answers from the 10 datasets mentioned in Datasets build.
Result
The result contains three parts and each part aimed to answer one research question. The first part is about the basic analysis of the email records, from which the characteristics of users that use email Q&A services can be described. The second and third parts are about topics analysis and the relationship between topics and asking for meeting.
Basic statistical analysis of Email records
In this section, I counted the numbers of the email records for each field (except Question, Details and Answers) and presented the result via charts.
1. Affiliation
The “Affiliation”field contains 9 sub-categories. I counted the number for each category and plotted a pie chart (Fig.5), a small percentage of records do not have value in “Affiliations” fields, noted as “No response”. Although the “Affiliations” field is
required for submission, the no-response-input may be caused by system error. Therefore, the records with “No response” input in the affiliation field were excluded from further analysis.
Figure 5 Distribution of Affiliations
2. Status
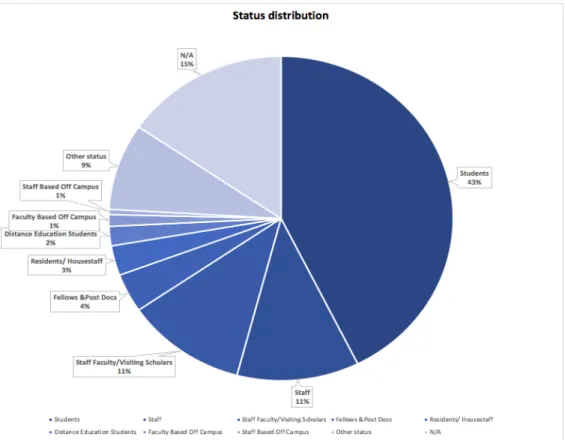
The “Status” field contains 9 groups. Figure 6 shows the distribution of each group. “N/A” means a record has no value in the “Status” fields. The records with “N/A” responses in the “Status” field were excluded from further analysis.
Figure 6 Distribution of status
3. Asked on date
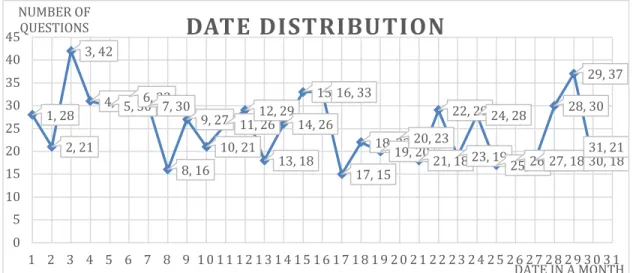
For “Asked on field, I counted the number of email records for each month (Fig.7) and the number of email records for each day in a week (Fig.8) and each day in a
month(Fig.9). Figure 7 shows that among 12 months in 2016, September was the peak month that obtains most questions via Email us service (i.e., 109 questions were
Figure 7 Numbers of questions submission in each month
Figure 8 The Distribution of question submission in a week
Figure 9 Distribution of date in a month
138 , 135 140 133
115 41 74 0 20 40 60 80 100 120 140 160
Mon. Tues. Wed. Thur. Fri. Sat. Sun.
1, 28 2, 21
3, 42
4, 315, 306, 327, 30 8, 16
9, 27 10, 21
11, 2612, 29 13, 18
14, 26 15, 3316, 33
17, 15 18, 22
19, 2020, 23 21, 18
22, 29 23, 19
24, 28
25, 1726, 1827, 18 28, 30 29, 37 30, 18 31, 21 0 5 10 15 20 25 30 35 40 45
1 2 3 4 5 6 7 8 9 1 0 1 1 1 2 1 3 1 4 1 5 1 6 1 7 1 8 1 9 2 0 2 1 2 2 2 3 2 4 2 5 2 6 2 7 2 8 2 9 3 0 3 1 NUMBER OF
QUESTIONS
DATE IN A MONTH
4. Asked for meeting
As mentioned before, I encoded “Prefer date for meeting” into “asked for meeting” structure, the count of each category is shown in Table 4. Only 263 records that clearly indicated a meeting was requested while the other 513 records either did not have value for this field or indicated no need for meeting.
Table 4. Distribution of meeting requirements
YES ASAP 13
263
Anytime 5
Special time asked 239
NO N/A 466 513
No need 47
5. “What do you want to learn”
“What do you want to learn” is a field is added by librarians to the email record dataset. Among all 776 valid records, only 356 records have values in this field. These 356 records revealed that “Consultation” and “Systematic review search” were the top topics that users want to learn. In addition, patrons usually indicated that they would like to have a meet when they submitted questions about “Consultation” and “Systematic review search” .
Table 5. Distribution of What do you want to learn
learn no)
Audio and video editing 1 1:0
CINAHL 4 2 :2
Consultation 118 82:36
EndNote 20 13:7
Online design 2 1:1
Other database 44 17:27
Poster and print design 5 3:2
Pubmed 39 25:14
Refworks 20 6:14
Systematic review
search
99 75:24
Working with images 4 2 :2
Total 356 227:129
Q & A Text analysis
1. Average sentence length
Table 6 shows the average sentence length of each text area in terms of word count. Answers have less words than Question and Details. Comparing Question and Details, sentences in Questions have more words than Details.
Text Area Average sentence length (words count)
Questions 18
Details 12.45
Answers 9.23
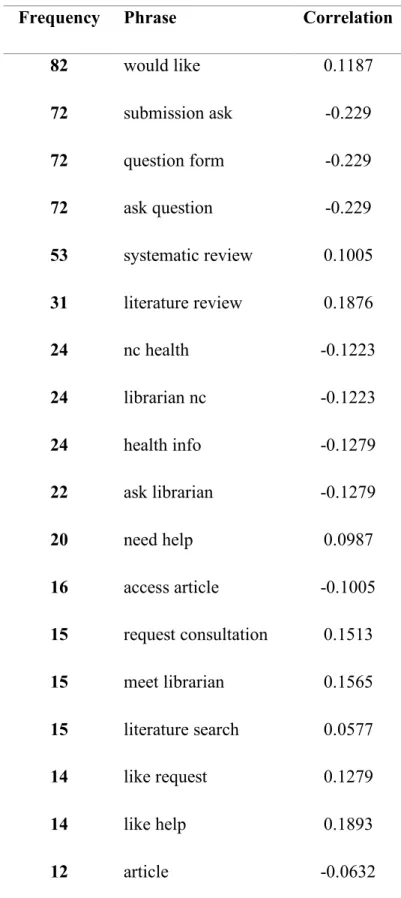
2. Correlation between text features and Ask for meeting
The occurrence frequency of top 20 phrases were extracted as examined text features. The correlation of each phrase with the indication of asking for meeting were also
examed for each text area (i.e., Questions, Details, and Answers). For the Questions, 10 phrases showed positive correlation with Ask for meeting, which means when these 10 phrases appeared in the Question area, the user tended to ask for a meeting Table 7). For the Details, only 4 phrases had positive correlation with Ask for meeting (Table 8). Comparing phrases with positive correlation with Asking for meeting in both Questions and details areas, the overlapped phrases were “would like”, “systematic review”, “literature review” and “help”. For the Answers area, 11 phrases showed positive correlation (Table 9), which is more than either Questions or Details area.
Table 7. Features of Questions and correlation with Asking for meeting
Frequency Phrase Correlation
82 would like 0.1187
72 submission ask -0.229
72 question form -0.229
72 ask question -0.229
53 systematic review 0.1005 31 literature review 0.1876
24 nc health -0.1223
24 librarian nc -0.1223
24 health info -0.1279
22 ask librarian -0.1279
20 need help 0.0987
16 access article -0.1005
15 request consultation 0.1513
15 meet librarian 0.1565
15 literature search 0.0577
14 like request 0.1279
14 like help 0.1893
11 review 0.1069
11 public health -0.0168
Table 8. Features of Details and correlation with Asking for meeting
Frequency Phrase Correlation
194 would like 0.0897
71 health -0.0007
68 sent -0.2219
68 question sent -0.2219
68 person -0.1461
68 like question -0.2219 68 libraries person -0.2219
66 visit unc -0.1602
66 systematic review 0.1731
60 email address -0.216
51 question -0.0577
46 literature review 0.0078 40 unc libraries -0.1647
38 med unc 0
36 yes where -0.1134
35 unc edu -0.0446
34 like know -0.1211
33 hill libraries -0.1509
33 help 0.0379
Table 9. Features of Answers and correlation with Asking for meeting
Frequency Phrase Correlation
330 unc edu -0.257
226 lib unc 0.007
130 http 0.0446
118 let know 0.239
92 wright mlsclinical 0.021 90 mlsclinical
librarian
0.0155
87 happy meet 0.3516
83 search -0.1397
78 librarian hsl -0.087
69 hsl 0.0515 68 rachael posey -0.0587
67 meet 0.0872
65 posey pharmacy -0.0587
64 sarah wright 0.0349
64 pharmacy librarian -0.0563
58 us know 0.07
54 happy -0.0135
52 work 0.0017
50 pm -0.1005
Topic extraction and visualization
I used VOSviewer to extract and visualize the topics of the ten datasets mentioned in Datasets Build section. In addition, I extracted and visualize topics from the combined texts of Questions, Details and Answers areas for a general analysis. for the rest nine datasets, I treated all the text area as whole record for analysis. VOSviewer visualized the key topics and generated both density maps and network maps, I used density maps to present results.
1. General analysis of Full dataset
Answers area, there are some key terms about time arrangement like “tomorrow”, “Tuesday”, and some terms about information source like “ nlm nlhgm” and “ copy article”.
Figure 11 Details topics density visualization
2. Affiliation analysis
From the Fig.13 to Fig.15 we can tell that topics like or related to “review”, “literature/literature review” , “ search/literature search”, and some terms about time arrangement like “morning”, “tomorrow” were taking big roles in these records. And there are also some medical terms like “doctor”, “patient”, etc were appeared in the results.
Figure 15 Public health datasets topics density visualization
3. Status analysis
Figure 16 Students datasets topics density visualization
Figure 17 Staff datasets topics density visualization
Figure 18 Visiting scholar datasets topics density visualization
4. Ask for meeting analysis
Discussion
Combined all the results present before, we can give answers to our research questions.
1. What characteristics of users that use email Q&A services?
Most users are from the UNC health affair schools such as School of Public Health, School of Medicine, and School of Nursing. In addition, students, staff and visiting scholars are the main users of email Q&A services in the year examined by this study. Users heavily used email Q&A services at the beginning of the spring and fall semesters (i.e., February and March in spring, September and October in the fall). Users rarely used the “ preferred date for meeting” field web to indicate their requests for meetings.
2. What kinds of topics are mostly mentioned in email Q&A records?
Overall, the topics like or related to “systematic review” , “ literature” , “search” and “endnote” are the key terms in analyzed email records. These topics are very similar to or the same as the key terms investigated in “What do you want to learn” area.
There are some key words about meeting time in Answers but not in Questions or Details. This may be considered as librarians would introduce his/her available time for
meeting in reply, however, users tend to talk more about their questions in email but not mention too much about whether they need meeting or what time is good for meeting.
department, for instance, medical related terms appeared in Nursing and Public health datasets. We could assume that users from specific affiliation tend to ask the HSL for help about finding recourses or information about their target research area.
Students’ email records have various of topics, which means for student group, they have many different kinds of questions to librarians for help. While for staff group, their topics are focused on hospital and patient stuff, we can infer that for staff of UNC, they would like to ask librarians of the HSL to help them to find information or access to get information about patient or hospitals.
3. What kinds of questions are preferred to be solved via a physical meeting instead
of virtual reference?
This study found not strong correlation between the text features of the Questions and Details areas and Ask for meetings. Relatively, user’s email contains terms like “literature review search” and “consultation” are related to higher possibility of request a physical meeting.
This study aims at helping with the HSL to improve its Q&A email service. Given all the analysis and results, there are several proposals which could be helpful for the HSL email service.
Regarding the form redesign of Email Us, I suggest to make a few changes on the required areas. The improved structure could be seen in Fig.22, to be noticed, this structure only show areas that have been studied in this project, other required
blank (for instance, use few words to describe your questions), some users tend to input the first sentence of the Detail content in the Question blank, which causes Questions part has many single long sentences. Thus, for the Questions area, I suggest to use drop-down list instead of manual inputting contents by users.The options of the drop-down list shall include the items from the present “What do you want to learn” area plus “others.” If a patron selects “others,” an input box will appear and enable patrons to type any topics that are not on the drop-down list. So, in this case, librarians could quickly determine the topic of the submitted question and organize resources accordingly.
Another suggestion is about asking for meetings. Currently, HSL only asks users to input the preferred dates/time to request a meeting, and this area is not required. Based on results, it is hard to tell whether a user needs a meeting or not. I suggest to change this field to be a required field and redesign the question. For example, first ask “Do you need a meeting with a librarian.” If a patron selects “Yes”, then, the form asks the patron to select the best time for the meeting (Figure 22).
. The question of suitable time for a meeting provides a drop-down list which contains the following options : Anytime, As soon as possible, and a specific time.
Figure 22 The suggested required areas for the Web form of Email us
The third suggestion for HSL Q&A email services is that librarians shall
strategically allocate resources and time for the Q & A email services when it reaches its peak in September. Additionally, librarians need to customize resources and services according to the specific requests from students, staff and visiting scholars from the UNC health affair schools (i.e., Public health, Medicine or Nursing ) since they are the frequent users of the Email us services. Their requested services range from information search assistance such as access to information of their own research areas to information
Notes
1If the user is ok either with meeting or not, I encoded the value as No need.
2OpenRefine . Retrieved from http://www.openrefine.org
3LightSIDE. Retrieved from http://www.cs.cmu.edu/~cprose/LightSIDE.html
References
M.L. Radford, L.S. Connaway. “Screenagers” and live chat reference: Living up to the promise Scan, 26 (1) (2007), pp. 31-39
J. Finnell, W. Fontane Reference question data mining: A systematic approach to library outreach. Reference and User Services Quarterly, 49 (2010), pp. 278-286
J. Fennewald. Same questions, different venue: An analysis of in-person and online questions. Reference Librarian, 46 (95-96) (2006), pp. 21-35
Yang, S. Q., & Dalal, H. A. (2015). Delivering Virtual Reference Services on the Web: An Investigation into the Current Practice by Academic Libraries. The Journal of Academic Librarianship, 41(1), 68–86. https://doi.org/10.1016/j.acalib.2014.10.003
I.J. Lee. Do virtual reference librarians dream of digital reference questions? A
qualitative and quantitative analysis of email and chat reference Australian Academic and Research Libraries, 35 (2) (2004), pp. 95-110
Greenberg, R., & Bar-Ilan, J. (2015). “Ask a librarian”: Comparing virtual reference services in an Israeli academic library. Library & Information Science Research, 37(2), 139–146. https://doi.org/10.1016/j.lisr.2014.09.005
M.S. Chen, J. Han, P.S. Yu. Data mining: an overview from a database perspective IEEE Transactions on Knowledge and Data Engineering, 8 (6) (1996), pp. 866-883
U.M. Fayyad, G. Piatetsky-Shapiro, P.Smyth. The KDD process for extracting useful knowledge from volumes of data Communications of the ACM, 39 (11)(1996), pp. 27-34
Liu, H., & Motoda, H. (Eds.). (1998). Feature extraction, construction and selection: A datamining perspective (Vol. 453). Springer Science & Business Media.
Tan, A. H. (1999, April). Text mining: The state of the art and the challenges. In
Proceedings of the PAKDD 1999 Workshop on Knowledge Disocovery from Advanced Databases (Vol. 8, pp. 65-70).
Chawla, N. V. (2005). Data mining for imbalanced datasets: An overview. In Data mining and knowledge discovery handbook (pp. 853-867). Springer US
Rajman, M., & Vesely, M. (2004, January). From text to knowledge: Document
Results of the NEMIS Launch Conference (Vol. 138, p. 7). Springer Science & Business Media.
Chen, C.-C., & Chen, A.-P. (2007). Using data mining technology to provide a
recommendation service in the digital library. The Electronic Library, 25(6), 711–724. https://doi.org/10.1108/02640470710837137
Borgman, C.L. (1999), “What are digital libraries? Competing visions”, Information Processing & Management, Vol. 35, pp. 227-43.
Agrawal, R., Imielinski, T. and Swami, A. (1993), “Mining association rules between sets of items in large databases”, Proceedings of the ACM SIGMOD Conference on
Management of Data, Washington, DC, pp. 207-16.
Weiss, S. M., Indurkhya, N., Zhang, T., & Damerau, F. (2010). Text Mining: Predictive Methods for Analyzing Unstructured Information. Springer Science & Business Media.
R. Bekkerman, R. El-Yaniv, N. Tishby, andY. Winter. Distributional word clusters vs. words for text categorization. Journal of Machine Learning Research, 3:1183–1208, 2003.
Creswell, C., Schwartzmyer, N., & Srihari, R. (2007). Information extraction for multiparticipant, task-oriented, synchronous, computer-mediated communication: a corpus study of chat data. In Proceedings of IJCAI 2007 on Analytics for Noisy Unstructured Text Data, (pp. 131–138). Citeseer.
Anjewierden, A., Kolloffel, B., & Hulshof, C. (2007). Towards educational data mining: using data mining methods for automated chat analysis to understand and support inquiry learning processes. CEUR Workshop Proceedings, 305, 23-32.
Anwar, T. & Abulaish, M. (2014). A social graph based text mining framework for chat log investigation. Digital Investigation, 11(4), 349–362.
Bingham, E., Kabán, A., & Girolami, M. (2003). Topic identification in dynamical text by complexity pursuit. Neural Processing Letters, 17(1), 69–83.
Azzam, T., Evergreen, S., Germuth, A. A. and Kistler, S. J. (2013), Data Visualization and Evaluation. New Directions for Evaluation, 2013: 7–32. doi:10.1002/ev.20065
Kosara, R. (2007, July). Visualization criticism—The missing link between information visualization and art. Information Visualization, IV’07. 11th International Conference (pp. 631–636). doi: 10.1109/IV.2007.2
Olsen, Kai A. "Data Visualization." Computer Sciences, edited by K. Lee Lerner and Brenda Wilmoth Lerner, 2nd ed., Macmillan Reference USA, 2013. Science in Context, link.galegroup.com/apps/doc/CV2642250148/SCIC?u=unc_main&xid=495a6d14. Accessed 6 Sept. 2017.
Kovalerchuk, B. (2017). Visual Cognitive Algorithms for High-Dimensional Data and Super-intelligence Challenges. Cognitive Systems Research.
Nicoletta Di Blas , Mirjana Mazuran , Paolo Paolini , Elisa Quintarelli , Letizia Tanca, Exploratory computing: a challenge for visual interaction, Proceedings of the 2014 International Working Conference on Advanced Visual Interfaces, May 27-29, 2014, Como, Italy [doi>10.1145/2598153.2600037]