Barriers and facilitators in meal planning strategies for glycemic control in individuals with type 1 diabetes in Beijing, China
By: Jennifer Lyu
Senior Honors Thesis
Department of Nutrition
University of North Carolina at Chapel Hill 2017
Approved: ____________________________________ Advisor: Elizabeth Mayer-Davis
ABSTRACT
Type-1 diabetes (T1D) incidence in China is one of the lowest among the world but is steadily increasing each year. Without proper matching of insulin injections with dietary intake, patients with T1D face challenges with maintaining healthy blood glucose levels. Currently, there is very limited research that has focused on the nutrition aspect of T1D self-management among patients in China. This study aims to further investigate the nutrition aspect of T1D management in China by exploring how nutrition knowledge may be influencing adherence to meal planning and carbohydrate counting among T1D patients in China. The study also aims to investigate other potential barriers that may influence adherence to meal planning and carbohydrate counting. Two online nutrition surveys were developed through Qualtrics Survey Software: one survey was targeted towards patients with T1D (n=82) and one survey was targeted towards health care providers (n=11) from Peking University People’s Hospital in Beijing, China. The mean age of patient participants was 26.0 ±7.2 years. Approximately 74.4% of
patient participants were female. Majority of patient participants were also underweight/healthy weight (BMI < 23.0), from urban residence, and have at least a college level of education. Overall, patient
This original research involved the analysis of data obtained from patients in an online T1D community in China and from providers from the Peking University People’s Hospital in Beijing, China. I would like to thank my advisor and mentors Elizabeth J. Mayer-Davis, PhD, at the University of North Carolina at Chapel Hill and Wei Liu at the Peking University People’s Hospital in Beijing, China, without whose constructive advice, support, and
TABLE OF CONTENTS
LIST OF TABLES AND FIGURE…….……..………iv
CHAPTERS I. INTRODUCTION AND STUDY AIMS…………..…….………. 1
II. LITERATURE REVIEW………...5
T1D Description………..……….………..………5
T1D Global Incidence……….……….………6
T1D Potential Etiologies………...………...……….………7
T1D Pathogenesis..………7
Environmental Triggers of Autoimmunity and T1D………...………...………..8
T1D Micro- and Macrovascular Conditions...………...………8
Psychosocial Concomitants.……….……….…………..……….…11
T1D Management……….………..………11
T1D in China.………....……….………13
III. MANUSCRIPT.……….……….………18
Abstract………..……….………19
Introduction………..………….………..20
Methods………...………...21
Results: Patient Perspective..……….25
Results: Provider Perspective ………...………...41
Discussion……….………..………...48
Strengths and Limitations………..………..50
Conclusions……….………...………50
Future Steps..………..………..51
LIST OF TABLES AND FIGURE
Table Page
Definitions of Pre-diabetes and Diabetes……….2
Basic Demographics of T1D Patients (before collapsing variables) ………30
Basic Demographics: Patients (n=82) (after collapsing of variables) ………31
Frequency of Adhering to Recommended Dietary Advice Received from Diabetes or Health Care Provider………32
Frequency of Viewing Nutrition Information on Labels by T1D Patients……….33
Barriers to Adhering to Meal Plans Among T1D Patients………...34
Demographics vs. Nutrition Knowledge Questions (Mean % Accurate) ………..35
Demographics vs. Adherence to Meal Plans and Carbohydrate Counting………36
Demographics vs. Barriers 1-3………37
Demographics vs. Barriers 4-6………38
Demographics vs. Barriers 7-9………39
Barriers 1-9 vs. Adherence to Meal Plan and Carbohydrate Counting………...40
Basic Demographics of Health Care Providers………..43
Frequency of Recommendations to T1D Patients………43
Frequency of Advising Referrals and Counseling to T1D Patients………44
Frequency of Recommending Dietary Advice to T1D Patients………44
Frequency Checking the Following Complications in T1D Patients……….45
Providers’ Perspective of What is Most Essential for T1D Management………..46
Barriers to Adherence of Meal Plans Among T1D Patients Perceived by Health Care Providers……….47
CHAPTER I
INTRODUCTION AND STUDY AIMS
Introduction
Diabetes is a chronic metabolic disease characterized by blood glucose levels that are above normal due to deficiencies of insulin production or function.1 Glucose is a simple
sugar produced by the breakdown of sugars and starches from the diet and is used for energy by the body. 2 Insulin is a hormone, released by beta cells within the islets of
Langerhans of the pancreas, that the body needs to get glucose from the blood stream into the cells of the body.3,4 When insulin binds to its receptor on the cell, it signals a cascade of
reactions that leads to the phosphorylation of
, a serine-threonine protein kinase that stimulates the translocation of glucose transporter 4 (GLUT4), found in the heart, skeletal muscles, and adipocytes, to move to the cell surface and accelerate glucose uptake.5,6 There are two major types of diabetes. Type-1 diabetes
(T1D) is characterized by body’s inability to produce insulin due to the autoimmune destruction of the beta cells in the pancreas.1 As a result, there is no insulin to bind to the
receptor, thus no AKT signaling and no translocation of GLUT4 to uptake glucose from cells. Type-2 diabetes (T2D) is characterized by impaired insulin signaling and therefore insulin resistance, in which the body requires a higher level of insulin than normal to facilitate update of glucose into cells.7 Over time, the pancreas is unable to make enough insulin to
keep blood glucose at normal levels.7 Other types of diabetes include gestational diabetes.7
Prediabetes is a term that refers to a transition state in which the amount of glucose in the blood is above the normal ranges but not high enough to be considered diabetes.8
According to the CDC, 86 million American adults- more than 1 out of 3 – have prediabetes. Of this total, 15-30% of people with pre-diabetes will develop type-2 diabetes within 5 years.9 Further, 9 out of 10 people do not know they have prediabetes.9
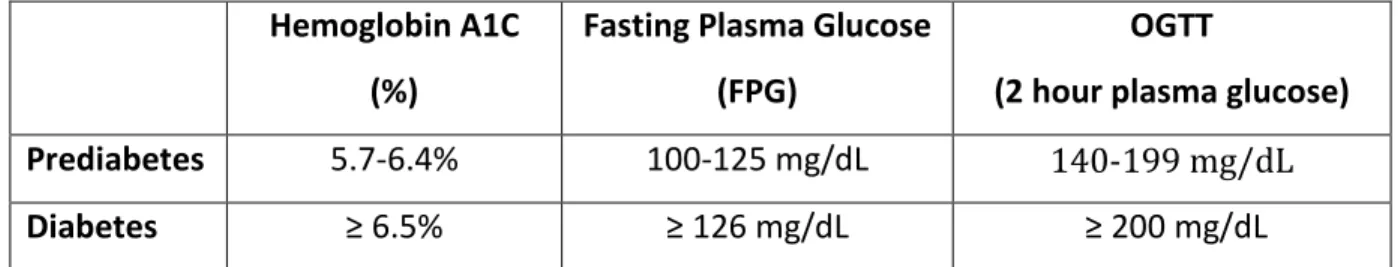
Diabetes may be diagnosed by measuring hemoglobin A1C levels (A1C), fasting plasma glucose (FPG), and by an oral glucose tolerance test (OGTT) (Table 1).8 The A1C test
Prediabetes is diagnosed at an A1C between 5.7% and 6.4%.8 For the FPG test, fasting is
defined by not having anything to eat or drink (except water) for at least 8 hours before the test.8 This test is usually done first thing in the morning before breakfast. Diabetes is
diagnosed at fasting blood glucose of greater than or equal to 126 mg/dl.8 Prediabetes is
diagnosed at fasting blood glucose of 100 mg/dL to 125 mg/dL.8 The OGTT is a two hour
test that checks your blood glucose levels before and two hours after you drink a special sweet drink.8 This test signifies how your body processes glucose. Diabetes is diagnosed at
2 hour blood glucose of greater than or equal to 200 mg/dL.8 Prediabetes is diagnosed at 2
hour blood glucose of 140 mg/dL to 199 mg/dL8 The focus of this investigation will be
type-1 diabetes.
Table 1. Definitions of Prediabetes and Diabetes8
Hemoglobin A1C (%)
Fasting Plasma Glucose (FPG)
OGTT (2 hour plasma glucose)
Prediabetes 5.7-6.4% 100-125 mg/dL 140-199 mg/dL
Diabetes ≥ 6.5% ≥ 126 mg/dL ≥ 200 mg/dL
According to the International Diabetes Federation, in 2015, there were 415 million people worldwide living with diabetes.10 By 2040, this number is projected to increase to 642
million people.10 Of this total amount, the Western Pacific region of the world accounts for
the highest rates of diabetes with 153.2 million people living with the disease in 2015 and 214.8 million people projected to have the disease by 2040.10 Compared to T2D, which
accounts for about 90% to 95% of all diagnosed cases of diabetes, T1D accounts for only about 5%. 11 Among the Western Pacific region, an estimated 60,700 children under the age
of 15 have type 1 diabetes, with approximately 10,000 newly diagnosed in 2015. Over 30,000 of these children are in China, supporting the evidence that China consists of the largest number of people with T1D in this region.10,12 Although evidence suggests the
incidence of T1D in China is increasing, knowledge on T1D care in China is severely
2002 found that children and adolescents with T1D in China had the lowest mean daily insulin dose and the lowest frequency of self-monitoring of blood glucose among Western Pacific countries.13 This may explain the high HbA1C level for the sample, a mean of 80.3
mmol/mol (9.5%). 12,13
Diabetes requires meticulous treatment and care that involves regular blood glucose checking and management of insulin dosing regimens unique to each individual. The coordination of insulin with dietary intake is essential among people with T1D so as to maintain near-normal blood glucose levels and prevent micro- and macrovasuclar complications, including neuropathy, retinopathy, kidney disease, ketoacidosis, hypertension, stroke, and heart disease.12,14 This integration is achieved through
individualized diabetes nutrition therapy, which typically involves one of two approaches: (1) fixed daily insulin doses matched to consistent carbohydrate intake with respect to time and amount or (2) flexible daily insulin doses accommodating variability in food intake, typically using carbohydrate counting.12 There is not a ‘one-size-fits-all’ eating
pattern for diabetes. Healthcare providers and dietitians should collaboratively develop eating plans with each individual with diabetes and provide ongoing implementation support.
In China, dietitians are largely absent from continuing diabetes education for individuals with T1D in China, and few patients regularly practice self-monitoring of blood glucose or carbohydrate counting.12 Barriers to improving T1D care in China include the high cost of
blood glucose strips and blood glucose meters, both of which are not covered by health insurance. 12 On average, one-third of an urban family’s income is spent on care for patients
with T1D in China.12 Further, the lack of diabetes education and the common requirement
for inpatient admission to receive diabetes education serve as major barriers. Other barriers include misconceptions relating to Chinese traditional medicine, time limitations of healthcare providers, and discrimination against individuals with T1D.12
specific needs T1D patients are lacking currently in order to best formulate effective resolutions to improve treatment and management.
STUDY QUESTIONS AND AIMS
This proposed project plans to employ standard quantitative and qualitative data collection methods to address the following research questions:
1. Does nutrition knowledge influence adherence to recommended meal plan and carbohydrate counting among patients with T1D in Beijing, China?
2. What are other perceived challenges that influence adherence to recommended meal plans and carbohydrate counting among patients with T1D in Beijing, China?
To address these questions, the research study will investigate two main aims as described below:
AIM 1:Use quantitative methods to assess nutrition knowledge among T1D patients and to describe perceived barriers by T1D patients in order to investigate two associations: (a.) the association between nutrition knowledge and adherence to meal planning and carbohydrate counting and (b.) the association between total number of barriers perceived and adherence to meal planning and carbohydrate counting.
Data collection occurred through distribution of a personal link to an online survey to interested T1D patients that were part of a T1D online community in China.
For Aim 1, there were three hypotheses:
1. There is a positive association between nutrition knowledge and adherence to meal planning and carbohydrate counting among T1D patients in China.
2. There is a negative association between total number of barriers perceived and adherence to meal planning and carbohydrate counting.
AIM 2: Use survey methods to assess perspectives from healthcare providers on major barriers to T1D patients in Beijing, China.
Data collection occurred through distribution of an anonymous link to an online survey to health care professionals (physicians, nurses, and registered dietitians) that provide clinical care to patients with T1D at Peking University People’s Hospital in Beijing, China.
I hypothesized that health care providers from the Peking University People’s Hospital believe a rigid meal plan to be a common and major barrier for T1D patients in China..
Chapter II LITERATURE REVIEW
T1D Description
Type 1 diabetes (T1D) is a chronic disease characterized by the body’s inability to produce insulin due to the autoimmune destruction of beta cells in the pancreas.1 Insulin is an
important hormone in our body because it exerts a wide variety of biological actions, including regulation of glucose metabolism and protein synthesis.3 Once insulin binds to an
extracellular insulin receptor, a number of cellular substrates are phosphorylated, leading to the activation of multiple downstream signaling pathways.3 Most specifically, the
phosphorylation of phosphatidylinositol (PIP2) by phosphatidylinositol-3-kinase (PI3K) leads to the phosphorylation of AKT, a serine-threonine protein kinase that stimulates the translocation of glucose transporter 4 (GLUT4), found in the heart, skeletal muscles, and adipocytes, to move to the cell surface and accelerate glucose uptake.15,16 AKT also plays a
more direct role in signaling protein synthesis and glucose metabolism for energy. Therefore, lack of insulin secretion inhibits the downstream cascade of substrate
T1D Global Incidence
Reports on global variation in incidence, prevalence, and temporal trends in type 1 diabetes (T1D) are largely based on findings from large T1D registry studies, such as the World Health Organization Multinational Project for Childhood Diabetes (DIAMOND), EURODIAB, and the SEARCH for Diabetes in Youth (SEARCH) study.17
In 2006, the DIAMOND project examined the trends in incidence of T1D (per 100,000 a year) from 1990-1999 in children aged < or = 14 years from 114 populations in 57 countries. Out of a total of 84 million children, 43,013 cases of T1D were diagnosed, and over this time period, the average annual increase in incidence was 2.8%, with a slightly higher rate of 3.4% from 1995-1999 compared to a rate of 2.4% from 1990-199417,18.
These estimated trends showed statistically significant increases across continents (4.0% in Asia, 3.2% in Europe, and 5.3% in America), except in Central America and the West Indies where the trend showed a decrease of 3.6%.17,18 The DIAMOND project concluded
that such increases in incidence reports during this short period of time is less likely a result of genetic shifts, but rather environmental factors and the interactions between genes and the environment.17,18
From 1989-94, the EURODIAB Ace Study group reported 16, 362 cases of T1D in 44 centers throughout Europe and Israel covering a population of approximately 28 million children.19
Similar to the DIAMOND project, the standardized annual incidence rate varied greatly from 3.2/100,000 person years in Macedonia to 40.2/100,000 person years in Finland.17,19
During this time period, there was an annual increase in T1D incidence of 3.4%, and in some central regions of Europe, this rate has been reported to be higher.17,19 Additionally,
the rates of increase were found to be highest in the youngest age group: ages 0-4 years (6.3%, 95% CI 1.5-8.5%), which suggests an immediate challenge to caring for T1D in a toddler and an earlier onset of T1D also implies a longer burden of disease.17
T1D Potential Etiologies
The explanation for the wide disparities in T1D incidence between populations and ethnic groups may involve variance in the distribution of genetic susceptibility markers,
differences in the distribution of environmental disease determinants, or the combination of both. 21 When looking at genetic susceptibility markers, the most important genes are
located within the major histocompatibility complex (MHC) HLA class II region on chromosome 6p21 (Insulin-dependent diabetes mellitus, IDDM1), accounting for about 45% of genetic susceptibility for T1D.22 While these genes carry an immune response
function involving the presentation of antigenic peptides to T-lymphocytes, their specific contribution to the pathogenesis of T1D remains unclear.23 Further, T1D represents a
heterogeneous and polygenic disorder with approximately 40 non-HLA loci contributing to disease susceptibility already identified, but only two with known functions.15 IDDM2 on
chromosome 11p5.5 contributes about 10% towards disease susceptibility.23 This locus is a
polymorphic region that maps to a variable number of tandem mini-satellite repeats (VNTR), with short class 1 VNTR alleles predisposing to T1D.23 Another locus associated
with T1D is IDDM12 on chromosome 2q33, which has an apparent action on the cytotoxic T-lymphocyte-associated protein (CTLA-4), that is associated with immune
responsiveness.23
T1D Pathogenesis
In the 1980s Eisenbarth’ proposed a model that postulates that everyone is born with a degree of susceptibility to develop type 1 diabetes: for some this susceptibility is high, for others very low.1 Susceptibility is largely inherited, residing predominantly in the HLA
genotypes DR and DQ, and to a lesser extent in a host of other genetic loci (IDDM) susceptibility genes.1 The HLA locus is thought to confer about 50% of the genetic
susceptibility, roughly 15% from two other genes – insulin-VNTR (IDDM-2) and CTLA-4 (IDDM12) – with minor contributions from the other IDDM genes.1 These susceptibility
genes are thought to be important regulators of the immune response. Other genes
Environmental triggers may then alter immune function and initiate β-cell destruction. Putative triggers include viruses, environmental toxins, or foods (early exposure to cow’s milk proteins, cereals, or gluten).1 A close relation has been identified only with congenital
rubella. Supportive evidence for the autoimmune pathogenesis of T1D comes from the susceptibility of these individuals to other autoimmune conditions including Hashimoto’s thyroiditis, Graves’ disease, Addison’s disease, coeliac disease, myasthenia gravis, and vitiligo.1 Although recent knowledge has contributed to our understanding of the
pathogenesis of T1D, there remains no unifying theory of disease causation. However, the hygiene hypothesis has shown to partly align with type 1 diabetes. This hypothesis stems from observations that atopic disorders such as asthma are more common in affluent than in traditional societies, their prevalence rising with increasing modernization, and that such disorders are less frequent in children in large families or those families receiving day care than in children in small families or those not in day care. These findings suggest that children in these circumstances are less exposed to infections or other immune challenges early in life that act as protective environment influences.1 This hypothesis however lacks
credible scientific support in the causation of T1D.
Environmental Triggers of Autoimmunity and T1D
Ecological correlation between incidence and various environmental, health, and economic indicators suggest that differences in environmental risk factors, such as nutrition and lifestyle may be important in determining country’s incidence rate.16 Environmental risk
determinants for T1D may also be classified into three groups: viral infections, early infant diet (e.g. breastfeeding versus early introduction of cow milk’s components), and toxins.23
Further, The Environmental Determinants of Diabetes in the Young (TEDDY) study is a multicenter, multinational, epidemiological study that aims to identify infectious agents, dietary factors, or other environmental exposures that are associated with increased risk of autoimmunity and T1D.24 This study also aimed to identify the factors influencing specific
phenotypic manifestations such as early age of onset of T1D.24 Psychosocial stress was also
explored as a potential trigger for T1D.24 In one finding of the study related to infant
increased, by using hydrolyzed compared with nonhydrolyzed cow's milk-based infant formula as the first formula in infants at increased genetic risk for T1D.25 Thus, while the
TEDDY study looks at many ecological evidence for triggers of T1D, it also suggests there are other environmental factors that may greatly be contributing to T1D development and progression. These factors, however, are still being explored and researchers are further investigating if there are specific genetic susceptibilities involved among different groups of individuals.24
T1D Complications: Micro- and Macrovascular Conditions
Long –term diabetes-related complications may be characterized as both microvascular and macrovascular conditions, which account for most of the increased morbidity and mortality associated with the disease.1Microvasuclar complications include retinopathy,
nephropathy, and neuropathy. Diabetic nephropathy is the most common cause of renal failure in the developed world. Diabetic nephropathy progresses through a series of recognizable steps from subclinical disease, to the earliest detectable phase of
microalbuminuria (defined as a urinary albumin excretion rate >20<200 μg per day) to overt nephropathy or macroalbuminuria (>200 μg per day) with renal dysfunction and eventual end-stage renal disease. Macrovascular complications include cardiovascular, cerebrovascular, and peripheral vascular disease.1 Screening of individuals with T1D for
microalbuminuria should be instituted early in the course of their disorder: the Canadian Diabetes Association suggests annual screening every year with a random urine albumin-creatine ratio in post pubertal individuals with diabetes of duration 5 years or greater. Positive screening tests should be confirmed with further random albumin-creatinine ratios or timed urine collections for 2-3 months. Persistent positive results require introduction of renoprotective measures, including further intensification of glycaemic control and control of hypertension or hyperlipidaemia, or both, if present. First-line drugs of choice include angiotensin-converting enzyme inhibitors or angiotensin
Microvascular conditions
Diabetic retinopathy is the most common cause of acquired blindness in the western world, with a prevalence rate of proliferative retinopathy of about 20-25% in T1D. It also
progresses through recognizable stages from early non-proliferative changes, previously called background retinopathy (microaneurysms, exudates, and hemorrhages), which appear in almost all individuals with T1D by about 20 years’ duration, to preproliferative retinopathy and then to proliferative retinopathy and macular oedma.1 Screening for
diabetic retinopathy should begin 5 years after diagnosis in individuals of 15 years of age or older and be done yearly.1The presence of diabetic retinopathy requires enhanced
attention to glycaemic, blood pressure, and lipid control, with laser therapy in sight-threatening diabetic retinopathy.
Diabetic neuropathy refers to a complex group of conditions falling into two major categories: focal and generalized.1 Focal neuropathies include carpal tunnel syndrome,
peroneal nerve and third cranial nerve palsies, and diabetic amyotrophy (proximal nerve conditions). The most common generalized neuropathy is sensorimotor polyneuropathy, which often first presents as a peripheral neuropathy alone, but often also affects the autonomic system with cardiac dysfunction, gastroparesis, and erectile dysfunction.1
Peripheral neuropathy, in conjunction with peripheral vascular disease, can lead to skin ulceration of the lower limbs, poor healing and gangrene, and amputation.1 Good foot care
may greatly lower the risk of these outcomes. Screening for neuropathy should also being about 5 years after type 1 diabetes diagnosis with appropriate methods: testing at the great toe with a 10 gauge monofilament to detect loss of sensitivity, and clinical assessment for the other manifestations. Attention to glycaemic control represents the first step in management; if unsuccessful in controlling symptoms, referral to a specialist is recommended. Attention to preventive foot care is also essential.1
Macrovascular complications
The relative risk of cardiovascular disease in T1D can be as much as 10-fold greater than that in non-diabetic individuals.1 Risk factors for cardiovascular disease in type 1 diabetes
(weight control and physical activity), smoking avoidance, with optimum glycaemic, blood pressure (<130/80 mmHg in adults), and lipid control.1
Psychosocial concomitants
Past research has shown children from single parent families and low socioeconomic status are more likely to present in diabetic ketoacidosis at disease onset, have more episodes of diabetic ketoacidosis during the course of their diabetes, attend clinic less frequently, and are less likely to maintain good glycaemic control than those from two-parent and well-off families.1 Other researchers have also reported an increased prevalence of depression in
adults with type 1 diabetes.1 Type 1 diabetes have also been shown to be associated with
eating disorders, and are often associated with insulin omission to control weight through induced glycosuria, poor glycaemic control, and early onset of diabetes-related
complications.1
T1D Management: Insulin
Insulin was first discovered in 1921 and was initially thought to represent a cure for T1D. However, acute morbidity and mortality as well as a series of chronic complications still occur.23 The Diabetes Control and Complications Trial (DCCT) research group showed the
importance of strict metabolic control for the delay and prevention of chronic complications.23 Devices that promote home blood glucose monitoring and routine
determination of HbA1c are important for individuals to have euglycaemia without risk of severe hypoglycaemia.23 Most individuals in more developed countries are now treated
with recombinant human insulin, which has allowed the ability to alter the insulin molecule for improved pharmacokinetics. Thus, insulin analogues are now available that can be absorbed more rapidly and that can decrease the variability of insulin absorption. In many diabetes centers, it is recommended that rapid-acting insulin be administered with each meal, either with insulin pens or with pumps. The availability of rapid-acting insulin has also contributed to the greater use of insulin pumps. These pumps, although expensive, allow for the setting of multiple basal rates of insulin administration and bolus
There are now also devices that sample interstitial glucose by placement of a subcutaneous sensor, or use of an electric current to bring glucose to the skin surface by iotophoreses. One device uses a subcutaneous sensor and provides up to 3 days of glucose monitoring. Continuous monitoring with alarms for high glucose and low glucose concentrations, as well as allowing patients to modify their insulin administration (with multiple injections of rapid-acting insulin or insulin pumps) in real-time on the basis of glucose values is most ideal.23
Some other types of insulin pumps are programmed to release different amounts of insulin based on the time of the day. For example, basal insulin is the continuous release of small doses of insulin, while bolus insulin is a ‘surge’ of insulin released close to the consumption of a meal in order to control for the increase in blood glucose.26
T1D Management: Nutrition and Dietary Intake
In addition to insulin treatment, dietary adjustments are an essential regulator of blood glucose. The American Diabetes Association (ADA) published nutrition recommendations emphasizing individualization of dietary advice with a focus on the effects of nutrition therapy on metabolic control.1 The most recent ADA recommendations reiterate that there
is no “one-size-fits-all” diet for individuals with diabetes and that food choices should only be limited when supported by scientific evidence.27 In the United States, one study reported
that adults with T1D had a higher mean percentage of energy from fat and protein and a lower mean percentage of energy from carbohydrates compared to controls.27 A similarly
higher mean percentage of energy from fat compared to controls has also been observed in several small samples of youth T1D in the U.S. and in Europe.20,27
In contrast to fixed insulin dosing, carbohydrate counting is one meal planning approach that promotes a flexible insulin-dosing regime, allowing for the adjustment of the prandial insulin dose for actual carbohydrate intake in T1D patients.28 Carbohydrate counting
requires T1D patients to be educated on how to calculate carbohydrate amounts in each meal in order to predict the correct insulin dose required to maintain a normal
postprandial blood glucose level.28 Carbohydrate counting has been shown to reduce
T1D Management: Transplantations
Other forms of treatment include pancreas and more specifically islet transplantation. Limitations of this treatment however include the reliability of organ donors and the need for continuous immunosuppression. The immunosuppression is needed not only to
prevent rejection, but also to block recurrent autoimmune islet destruction.23
T1D Management: Gene Therapy
Gene therapy might be promising for promotion of euglycaemia. Two recent studies, one using gut K cells and the other involving liver cells, showed that the insulin gene delivery could be both glucose responsive and establish euglycaemia. 23
Further, drugs for prevention of specific complications include ACE inhibitors for
nephropathy, rigorous control of lipids with new generation statins, and protein kinase C inhibitors.23
T1D IN CHINA
T1D in China: Incidence and Temporal Trends in China
According to a recent systematic review and meta-analysis of incidence and temporal trends of type 1 diabetes in China, the overall incidence of type 1 diabetes (per 100 000 person-years) in mainland China has increased rapidly from 0.57 (95% CI 0.43-0.75) in 1990 to 1.04 (0.64-1.68) in 2000 and 3.36 (1.66-6.82) in 2010 (p<0.0001).29 The mean
annual increase in incidence was 9.0% (5.1-15.9), and the increase was numerically higher in boys (10.6%, 95% CI 4.7-23.6) than in girls (7.2%, 2.7-18.8) 29. Incidence was
significantly higher in girls than in boys (IRR 1.23, 95% CI 1.12-1.36; p < 0.0001) and this disparity was most profound in children aged 5-9 years (1.71, 1.27-2.29; p=0.00036).29 The
IRR for urban versus rural areas was 1.82 (1.37-2.41; p=0.0001).29
Another study investigating childhood type-1 diabetes incidence trend in Shanghai, China reported the incidence to have a mean annual increase of 14.2% per year during 1997-2011.27 The study suggested that if this increasing trend continues, the number of new type
Another study looked at type 1 diabetes incidence rates and trends among children and adolescents aged 0-19 in rural Zhejiang province.30 This study reported an average annual
increase of 12% over the course of the study period from 2007-2013, as well as a steep a rise of 33.6% in diabetes incidence in children under the age of 5 years old.30
In mainland China, the overall incidence of T1D was 0.74 (95% CI 0.55-1.00) per 100,000 person years between 1980 and 2013.29 Although the incidence rates in China are
relatively low compared to the United States and Northern regions of Europe, China has the largest number of people with T1D in the Western Pacific Region.31 Within China, the
highest incidence was found in the region of Wuhan (4.6 per 100,000 per year) and lowest in Zunyi (0.1 per 100,000 per year).32 Further, in one recent study, T1D is characterized by
different geographical distributions, with the North region having the highest prevalence of 120.5 per 100,000 persons, then the East following with 80.0 per 100,000 persons, and finally the Southwest region with 59.8 per 100,000 persons.33 The colder climate,
high-sugar diet, higher fat composition, and less dietary fiber found in northern regions of China may explain the higher incidence found.33
As incidence of T1D in China is expected to continue rising, it is important for researchers to take into account the environmental factors, such as diet, that plays an important role in diabetes self-management.
T1D in China: Self-management
Currently, data on T1D care outside the United States and Europe are limited. Between 2001-2002, the International Diabetes Federation conducted a cross-sectional study on glycemic control and diabetes self-management, and found that children and adolescents with T1D in China had the lowest mean daily insulin dose and the lowest frequency of self-monitoring blood glucose (SMBG) among Western Pacific countries.12,13 This low SMBG
frequency poses a significant barrier for physicians in China as well, who cannot advise patients appropriately with respect to diet because of a lack of SMBG information (most patients do not bring SMBG results to their outpatient visits).12 In a recent study performed
SMBG information deficits including 50.9% of participants not understanding the meaning of high blood sugar before exercises and 47.3% not understanding the kind of food that should be taken when blood sugar was low.34 In addition, one-fifth of participants did not
understand the different meanings of HbA1c and SMBG results and the necessity to practice both.34 The lack of diabetes educators in China and the common requirement of
inpatient admission to receive diabetes education are major barriers to proper T1D patient self-management.12 Other motivation obstacles included 85.5% of participants viewing the
cost of testing to be “too expensive” or adhering to doctor’s recommendations to be “painful” (72.7%).34 Although insulin is covered in part by most health insurance policies,
insulin injection tools, blood glucose testing strips and blood glucose meters are not
covered by insurance.12 Behavioral limitations involved 63.6% of participants feeling it was
difficult to discuss diabetes with workmates and friends, and 58.2% finding it challenging to buy test strips conveniently.12 These findings suggest possible reasons for study’s low
compliance rate (36.4%) of the American Diabetes Association recommendation to test blood glucose three times daily.34 These results based on the IMB framework are important
findings that may provide potential-focused education targets for diabetes health care providers.34
T1D in China: Nutrition Therapy
In 2014, the first study to assess the integration of diabetes nutrition therapy,
self-management practices, and dietary intake among T1D patients in a developing country was conducted in China.12 Researchers of this study found that there was a low frequency of
diabetes nutrition therapy approaches, such as carbohydrate counting.12 Instead, data from
the study suggest majority of diabetes nutrition therapy consists of matching fixed insulin doses to a diet that is rigid with respect to amount and timing.12 This method of nutrition
therapy makes it difficult for some T1D patients to adhere to due to the desire to consume a more flexible and diverse diet.
Further, the study showed that fewer than half of participants had ‘ever’ met with a dietitian, and it suggested that dietitians are only used in high-risk situations.12 Only 18%
an eating plan given to them by their healthcare provider.12 This is notably in contrast to
youth with T1D in the US, where 97% have been taught carbohydrate counting and 86% report using this method ‘often.’ 12 As a result, lack of nutrition education from this study
indicated an insufficient foundation among type 1 diabetes patients to implement changes to their diet.12 From the study, 74% of participants desired to learn more about how food
interacts with their diabetes care.12 Therefore, there is a strong need in China for more
integration of nutrition education by trained clinical dietitians during routine patient care.
T1D in China: Dietary Patterns
A recent study that compared the dietary intakes of individuals with T1D to individuals to that of individuals without T1D, found most participants to follow a fixed insulin regimen matched with a rigid meal plan, with respect to timing and amount of food.35 Overall,
compared to individuals without T1D, individuals with T1D in China had a lower mean percentage of energy from carbohydrates and a higher mean percentage of energy from fat and protein.35 Additionally, participants who were on fixed insulin regimens had higher
intake of wheat products and consumed less fruit, but more high-fat cakes and dairy compared to those without T1D.35 Higher consumption of high-fat cakes was suggested to
be a result of sugar-free cakes tending to be higher in fat, and patients may have been instructed to focus on low-sugar, low-carbohydrate foods, rather than fully comprehend the totality of the nutritional information.35 However, in a later study it was found that
consumption of high-fat cakes was inversely associated with HbA1c levels in T1D participants and consumers of wheat products had significantly lower LDL cholesterol compared to non-consumers.36 Individuals with T1D on fixed insulin regimen also
restricted fruit intake, which suggests another result of focusing on low, sugar or low-carbohydrate intake without considering the aspects of an overall healthy, balanced diet.35
Lack of physician-patient time and dietitian involvement in T1D care in China may be potential barriers to comprehensive educational nutrition counseling.35 On the other hand,
participants on basal-bolus regimens were less likely to consume fried foods and more likely to consume fish/shellfish.35 This group also consumed more protein than those with
T1D on a fixed insulin regimen.35 Thus, given the lower amounts of fried foods consumed,
fixed insulin regimen. It was therefore suggested that T1D patients on a basal-bolus insulin regimen are likely more motivated to adhere to self-management relating to dietary intake and nutrition.35In both insulin regimen groups, participants with T1D had an overall higher
intake of vegetables, fungi/seaweed, and low-fat cakes compared to individuals without T1D. Fungi is often used as an example for a “sugar free” food during diabetes education courses and the increased intake of low-fat cakes, such as biscuits/crackers is often consumed to treat hypoglycemia in China. 35 The study also found that participants with
T1D overall consumed less dietary fiber than non-T1D participants, and further found that mean fiber intakes were below the recommended level of 14 g/1000 kcal.35 Thus, given
that fiber is associated with reduced all-cause mortality and reduced cardiovascular disease risk among individuals with diabetes, there is a need to identify strategies to help promote an increase in dietary fiber intake in future research.35
T1D in China: Stigma
A major barrier to improving care for individuals with type 1 diabetes is the stigma that exists towards the disease, which has led to stereotyping, labeling, and devaluing of individuals with T1D.37 One of the reasons underlying this stigma may be the extremely
low incidence of the disease.18,37 Its rarity establishes those with T1D to be portrayed as
unusual, or ‘monsters’ by society.37 The stigma surrounding T1D in China has led to
difficulties for individuals to establish friendships and relationships with others.37 Further,
there is a government regulation that states individuals with ‘severe endocrine and metabolic diseases’ should not be admitted to universities or junior colleges, or employed by the government. The resulting structural discrimination has caused individuals with T1D to hide their diabetes in order to gain acceptance into colleges or jobs.37 This stigma
has also prevented many individuals to seek proper treatment, or sufficiently adhere to treatment plans in fear of having to inject their insulin dose in a public setting. 37 Health
care providers should therefore take a holistic, rather than solely biomedical approach, when advising patients with T1D, in order to account for how stigma may have a
ABSTRACT
Type-1 diabetes (T1D) incidence in China is one of the lowest among the world but is steadily increasing each year. Without proper matching of insulin injections with dietary intake, patients with T1D face challenges with maintaining healthy blood glucose levels. Currently, there is very limited research that has focused on the nutrition aspect of T1D self-management among patients in China. This study aims to further investigate the nutrition aspect of T1D management in China by exploring how nutrition knowledge may be influencing adherence to meal planning and carbohydrate counting among T1D patients in China. The study also aims to investigate other potential barriers that may influence adherence to meal planning and carbohydrate counting. Two online nutrition surveys were developed through Qualtrics Survey Software: one survey was targeted towards patients with T1D (n=82) and one survey was targeted towards health care providers (n=11) from Peking University People’s Hospital in Beijing, China. The mean age of patient participants was 26.0 ±7.2 years. Approximately 74.4% of
patient participants were female. Majority of patient participants were also underweight/healthy weight (BMI < 23.0), from urban residence, and have at least a college level of education. Overall, patient
INTRODUCTION
In China, the incidence of T1D is very low, but is continuing to increase each year. The overall incidence of T1D (per 100 000 person-years) increased from 0.57 in 1990 to 1.04 in 2000, to 3.36 in 2010.38 In one Shanghai study, the incidence in childhood T1D had a
mean annual increase of 14.2% per year during 1997-2011.38 If this increasing trend
continues, the number of T1D cases is expected to double from 2016 to 2020 and prevalent cases are expected to sextuple by 2025.38 This growing incidence calls for a greater need
of proper T1D treatment and management.29 While there is currently very limited research
that has specifically investigated meal planning strategies and T1D self-management in China, few studies have shown an overall poor T1D management among patients.12 One
study suggested a limited education on diabetes and nutrition are likely contributors to this poor management.12 Past research has also found that majority of T1D participants in the
study matched fixed insulin doses to a diet that is rigid with respect to amount and timing, rather than practiced a flexible insulin dosing regime with carbohydrate counting in which patients injected differing amounts of insulin according to the calculated amounts of carbohydrates consumed in the meal.12 It is likely that low adherence to recommended
meal plans may be a result of the rigid diet that makes it difficult for patients to eat what they desire.12 Lack of education regarding flexible insulin dosing regimens may explain
why there are very few T1D patients in China who follow this approach. Additionally, there exists an overarching stigma towards T1D in China that may ultimately play a role in preventing many individuals with T1D to actively seek care or adhere to specific dietary recommendations.37 Thus, it is also necessary for health care providers to be aware of this
METHODS
The Partner Study
This study is a cross-sectional study that was conducted alongside a partner study titled
Development of Type 1 Education Materials for Use by Patients Living in China. The focus of this partner study was to develop a Chinese, culturally adapted T1D educational material, based on a commonly used T1D education book in the United States called, A First Book for Understanding Diabetes (FBUD). This adaptation was based on information collected from T1D patients and health care providers at the Peking University People’s Hospital in
Beijing, China. Patients and caregivers were asked to read the current FBUD adaptation and after reading each chapter of the book, were asked to evaluate the content for its clarity and helpfulness. These chapter evaluations were accomplished through the completion of a brief survey and further feedback and suggestions for revisions of the adaptation were provided through focus group interviews with patients and caregivers. Health care
providers at the Peking University People’s Hospital were also asked to complete a survey aimed at collecting information on current clinical practices for T1D patient treatment and management.
Patient participants in this partner study included 3 main groups: adult patients (≥18 years) classified as having T1D by the endocrinology specialists at the Peking University People’s Hospital based on diabetic ketone acidosis at the onset of the disease (and the age of onset at less than 35 years of age), adolescents with T1D (12-17 years), and adult
caregivers of children with T1D who are < 18 years of age. Healthcare providers
participating in this study include endocrinologists, nurses, and dietitians at the Peking University People’s Hospital.
challenges that patients are facing in relation to adherence to meal planning strategies and T1D care.
Development of Study Materials: Patient and Provider Nutrition Online Surveys
Two online nutrition surveys were developed for this study: one survey was targeted towards patients with T1D in China and one survey was targeted towards health care providers at the Peking University People’s Hospital in Beijing, China. The patient nutrition survey included questions regarding basic demographics, nutrition knowledge,
recommendations received by providers regarding T1D management, adherence to meal plans, and perceived barriers when managing their diet with their T1D care. Questions for this survey were translated and modified from the 3C Nutrition Ancillary Study
Supplemental Questionnaire, and the Nutrition Knowledge Survey (NKS)12,39. The nutrition
knowledge questions included in the Patient Nutrition Survey were divided into two categories: Healthy Foods (non-label) Questions and Nutrition Label Questions. The Healthy Foods (non-label) Questions involved general questions regarding foods included in a healthy diet, as well as some dietary questions specifically for T1D patients related to certain foods’ effects on the rate of blood glucose levels and estimated number of
carbohydrates contained in certain foods. The Nutrition Label Questions assessed the patients’ ability to read and understand food labels.
The provider survey included questions regarding the providers’ basic demographics (i.e. sex, occupation, years of experience, etc.), recommendations given to type-1 patients, as well as the frequency of providing these recommendations. This survey also asks providers what they perceived were their patients’ most challenging barriers to adhering to meal planning strategies, as well as what they saw were the most helpful factors to promoting patient self-care. Baseline demographic questions were taken and modified from the Survey of Attitudes and Practices Among Family Physicians.40
Participants: Patient Recruitment
allows for networking and group communications. This app is used as a platform to promote motivation, encouragement, and assistance among type-1 diabetes patients in China. An advertisement for the study was posted on this online community and interested members of this community were instructed to contact a member of the UNC research team by email (a separate email account was created for the purposes of this study) and with a standard message written in Chinese on the advertisement that instructed how participants should express their interest to join the study. Once email of interest was received, the UNC researcher generated a personal link to the online survey through Qualtrics Survey Software for each interested participant patient. This personal link was different for each participant and could only be used once. This prevented the link from being massively distributed across the web. The personal link also allowed for the respondent’s data to be automatically saved as the participant progressed through the survey. If the participant needed to leave the survey before finishing, they could return to the last question they left off at any time on any device. The UNC researcher then
responded to each participant’s email of interest with a standard message translated in Chinese that thanked the participant for his/her interest and included the personal link to the survey. The message also noted that if the participant were to have any further
questions regarding the study, to email Dr. Wei Liu (WL). Each response message with the personal link was also sent to WL to ensure all communications between the patient and UNC researcher were clear and no possible questions by the patient were left unanswered. For members of the online community who had trouble sending their email of interest direclty to the UNC researcher’s email account due to technical difficulties, these members contacted WL. WL then forwarded the “WeChat” usernames of these individuals to the UNC researcher who kept a working list of these usernames. A list of personal links were
Participants: Provider Recruitment
Providers (n=11) recruited for this study included endocrinologists, nurses, and dietitians from the Peking University People’s Hospital. An anonymous link was distributed by email to these providers by Dr. Liu. Multiple survey takers can use one anonymous link, which differs from the personal link, which only allows for one user. Since these providers are trustworthy colleagues of Dr. Liu and given the anticipated smaller sample pool, an anonymous link was utilized for efficiency.
Study Incentives
Once the survey was completed, both patients and providers were given a $2 telephone gift card, transmitted electronically within 24 hours.
All procedures were approved by the University of North Carolina Office of Human Research Ethics and the Peking University Biomedical Institutional Review Board, and all participants provided online informed consent prior to taking the online survey.
Statistical Analyses
Data collected from the survey was organized in a Microsoft Excel spreadsheet through double entry and validation for controlling possible errors in translating the information. The variables were coded in accordance with the response and, whenever possible, were categorized to facilitate the analysis and understanding of results. Data analysis regarding the associations between nutrition knowledge and demographic variables utilized T-tests to assess for significance. A Chi-Square test (Fisher’s Exact test for n≤5) and Yate’s
RESULTS: PATIENT PERSPECTIVE Patient Responses
There was a total of n=99 initial responses to the patient survey. Of this total, 91 participants agreed to the consent form and continued to take the survey, while 8
participants disagreed to give consent and therefore did not take the survey. The following questions in survey displayed a decrease in participant number where from questions 1-32, there were n=88 participants who responded and remained in response until questions 14-32, where this number decreased to n=82 participants responding. Thus, all data that was analyzed for this study utilized the sample size of 82 to represent all participants who completed the entirety of the survey in order to maintain a sense of consistency during analysis of the data. The survey was set up such that participants had to complete the previous questions before moving on to the next set of questions. Therefore, this decrease in participant response may be a result of patients completely exiting out of the survey, possibly due to length or technical difficulties. However, reasons for the survey
incompletion are not certain.
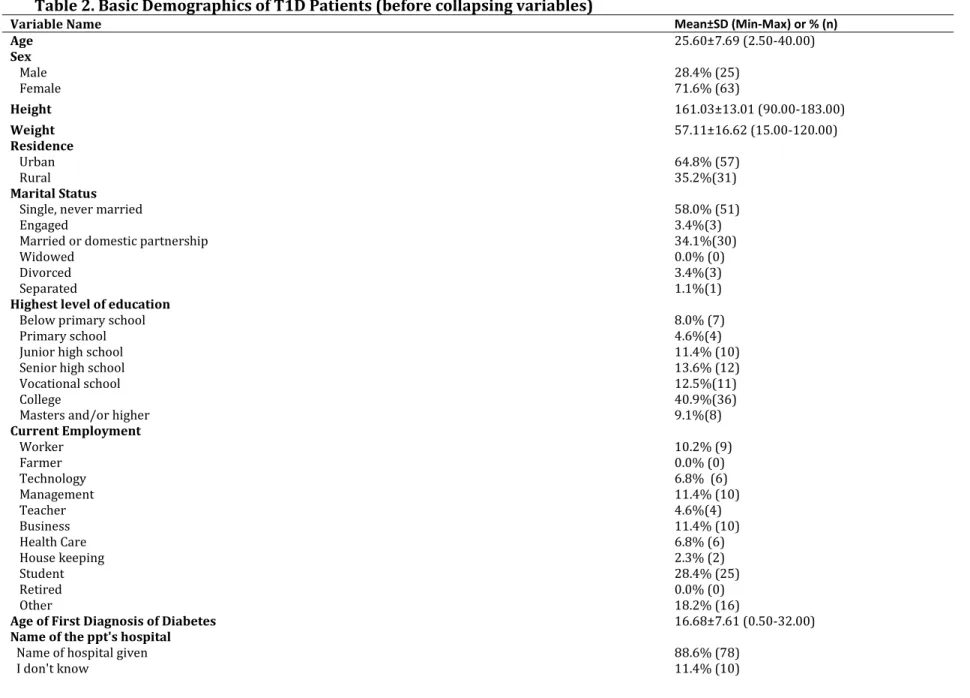
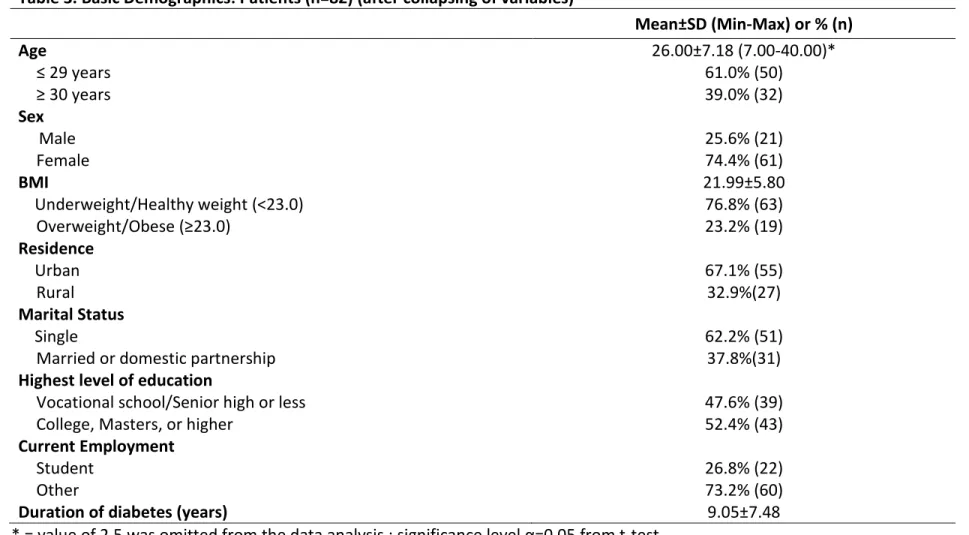
Patient Descriptive Statistics Patient Demographics
Table 2 shows the original basic demographic data collected from the Patient Nutrition Survey. Due to the small sample sizes found within each of the demographic variable categories, variables that included more than two groups were dichotomized for the purposes of later data analysis (Table 3).
Diabetes and Meal Planning Education
Data from the Patient Nutrition Survey showed 75.0% of patient participants reported receiving previous diabetes education, with approximately 83.3% of participants reported receiving this education from a physician. Further, approximately 72.7% of participants have been given an eating plan by their physician or dietitian. Of this percentage, when asked in how many of the past seven days they adhered to this meal plan, approximately 31.7% reported adhering for seven days, yet 15.0% adhered none of the days. Additionally, when asked from what source participants receive information about managing their diet with diabetes, 84.2% reported receiving information from the internet/web.
Frequency of Adhering to Recommended Dietary Advice Received from Dietitian or Health Care Providers
Counting carbohydrates (CC) is one meal-planning tool utilized by T1D patients that involves adjusting the amount of insulin injected to the amounts of carbohydrates consumed.28 For this study, 32.9% of participants reported either never counting
carbohydrates or only CC when blood glucose was abnormal (Table 4). The remainder 67.1% of participants reported CC every day or some days. More than half of participants also reported choosing low glycemic index foods, limiting sweets, and eating more fruits and vegetables ‘Every Day’ (Table 4). About 40.2% of participants also reported ‘Never’ to to using dietary exchanges for their T1D management.
Awareness of Dietary Intake Amount among T1D Patients
Approximately 87.8% of T1D participants reported that they knew how much they should be eating; however 39.0% reported eating more than they should. Further, more than half of participants (56.1%) disagree with the survey statement, “I eat until I feel full.”
Frequency/Motivation of Reading Food Labels
Patient Perceived Barriers
The most common major barrier reported by approximately 62.2% of patient participants in relation to managing one’s dietary intake with their T1D was the challenge of wanting to eat more than what the doctor recommended (Table 6). The second most common barrier was reported by 37.8% of participants that wanted to read the food labels but could not because many of the foods they ate did not have food labels. The third most popular barrier was reported by 23.2% of patient participants that claimed they wanted to read the food label but could not because the food label was hard to understand.
Patient Data Analysis
Nutrition Knowledge Trends
Overall, patient participants scored higher in accuracy on the ‘Nutrition Label’ (NL)
questions (70.6% ± 20.2) than on the ‘Healthy Foods (non-label)’ (HFNL) questions (60.9% ± 17.1). A T-test was utilized to assess significance between demographic variables and the two categories of nutrition knowledge questions (Table 7). The data shows females scoring significantly higher than males on the HFNL questions (p=0.031). Likewise, on the same HFNL questions, participants who had a higher education level (“College, Masters degree or higher”) scored higher than participants who had a senior high school education or less (p=0.014). On the NL questions, students scored higher than the other occupations (p=0.045).
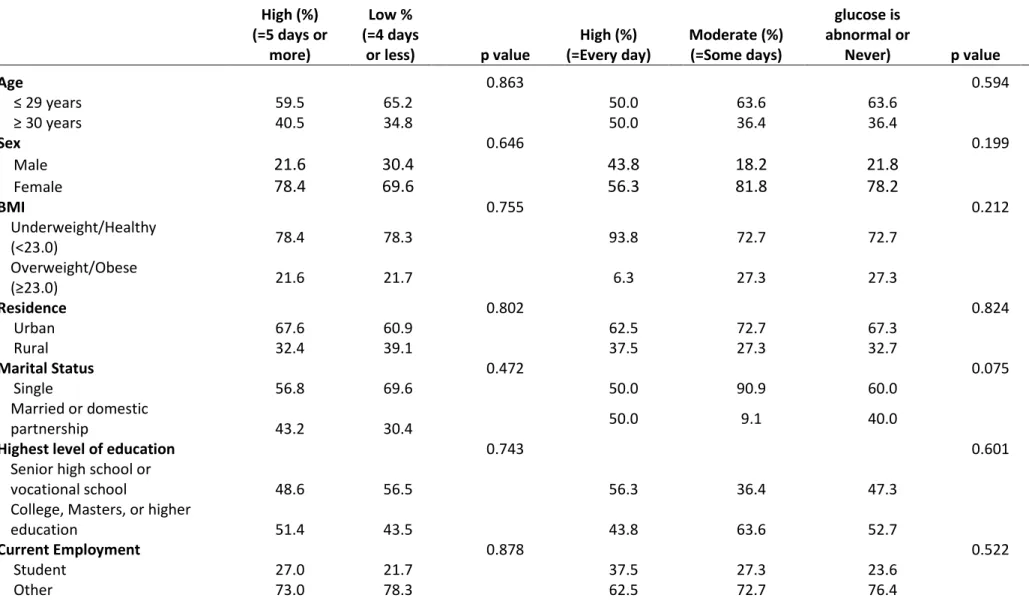
Nutrition Knowledge and Adherence
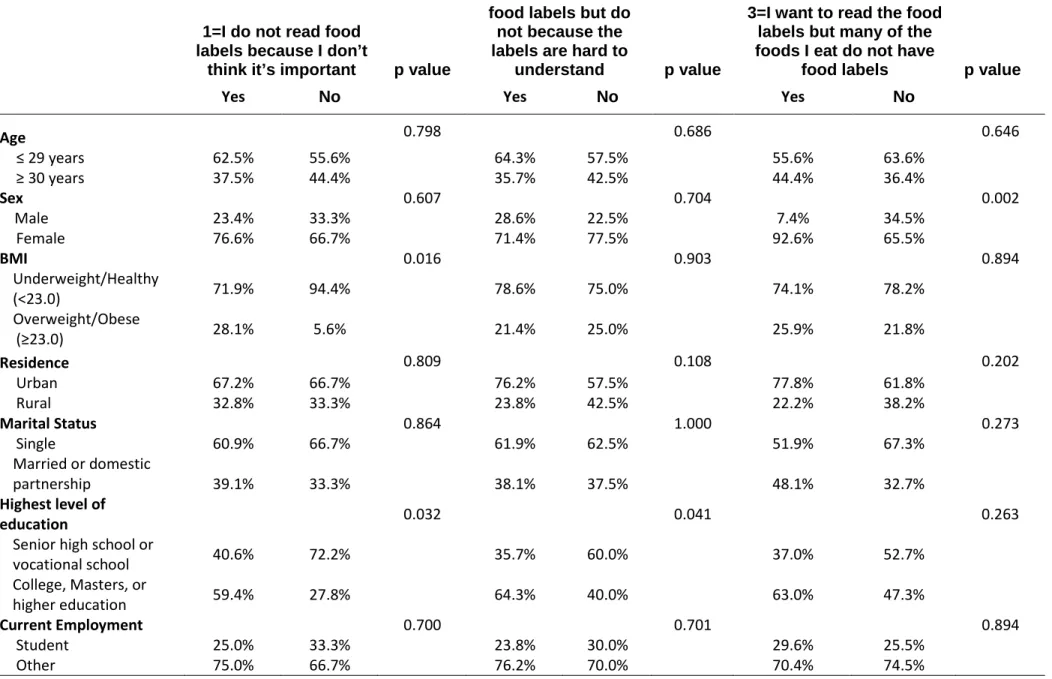
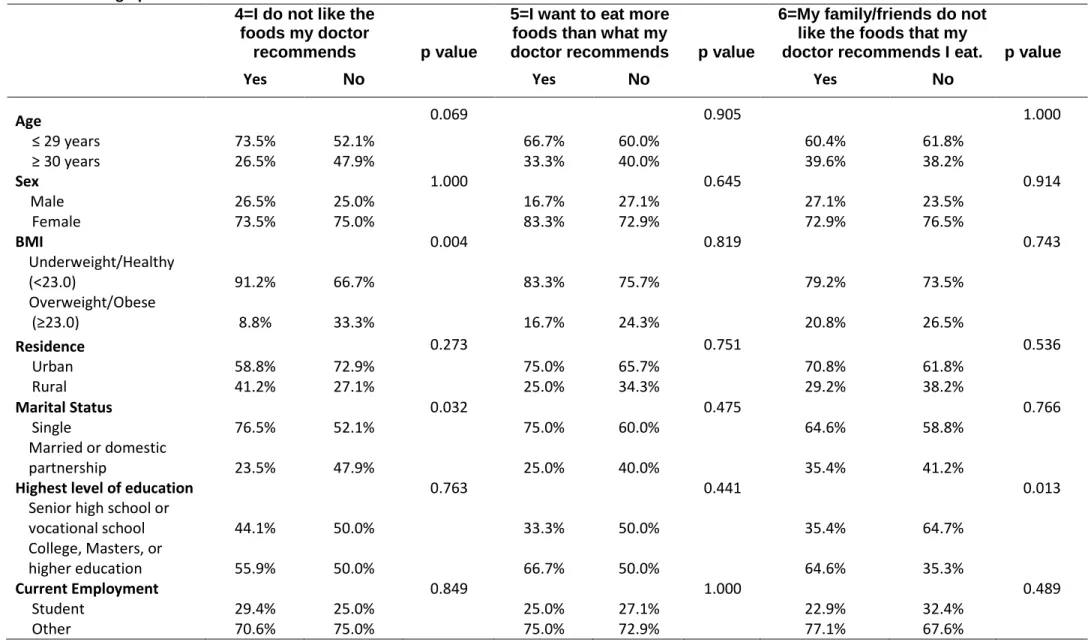
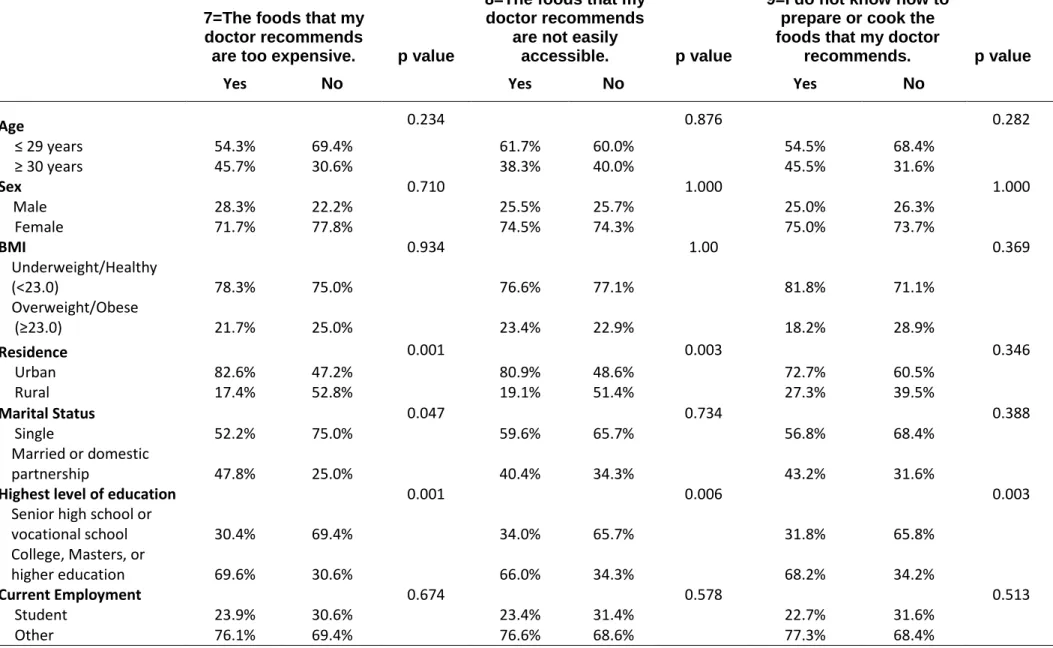
Barriers Perceived By T1D Patients
Tables 10a, 10b, and 10c show all nine barrier statements included in the patient survey crossed with demographic variables. A two-sample proportions test was utilized to test for significance. The results show there was a significantly higher percentage of
underweight/healthy weight than overweight/obese for both agreement and disagreement with the statement, ‘I do not read food labels because I don’t think it’s important.’ For this same barrier statement, it was also found that there was a significantly higher percentage of participants with a college education or higher versus those with a senior high school education or less who reported in agreement with this statement (p=0.032). Participants with a college education or higher also showed a significantly higher percentage in
perceiving food labels being hard to understand as a major barrier (p=0.041). For the third barrier statement, regarding many of the foods participants consume do not have food labels, females showed a significantly higher percentage than males for both agreement and disagreement with this experiencing this barrier (p=0.002). There was also a
college education level that perceived accessibility (p=0.006) and knowing how to cook or prepare the foods their doctor recommends (p=0.003) as majors barrier.
Barriers and Adherence
The study found that wanting to eat more food than what the doctor recommends was significantly associated with a lower meal plan adherence among the T1D patients
Table 2. Basic Demographics of T1D Patients (before collapsing variables)
Variable Name Mean±SD (Min-Max) or % (n)
Age 25.60±7.69 (2.50-40.00)
Sex
Male 28.4% (25)
Female 71.6% (63)
Height 161.03±13.01 (90.00-183.00)
Weight 57.11±16.62 (15.00-120.00)
Residence
Urban 64.8% (57)
Rural 35.2%(31)
Marital Status
Single, never married 58.0% (51)
Engaged 3.4%(3)
Married or domestic partnership 34.1%(30)
Widowed 0.0% (0)
Divorced 3.4%(3)
Separated 1.1%(1)
Highest level of education
Below primary school 8.0% (7)
Primary school 4.6%(4)
Junior high school 11.4% (10)
Senior high school 13.6% (12)
Vocational school 12.5%(11)
College 40.9%(36)
Masters and/or higher 9.1%(8)
Current Employment
Worker 10.2% (9)
Farmer 0.0% (0)
Technology 6.8% (6)
Management 11.4% (10)
Teacher 4.6%(4)
Business 11.4% (10)
Health Care 6.8% (6)
House keeping 2.3% (2)
Student 28.4% (25)
Retired 0.0% (0)
Other 18.2% (16)
Age of First Diagnosis of Diabetes 16.68±7.61 (0.50-32.00)
Name of the ppt's hospital
Name of hospital given 88.6% (78)
Table 3. Basic Demographics: Patients (n=82) (after collapsing of variables)
Mean±SD (Min-Max) or % (n)
Age 26.00±7.18 (7.00-40.00)*
≤ 29 years 61.0% (50)
≥ 30 years 39.0% (32)
Sex
Male 25.6% (21)
Female 74.4% (61)
BMI 21.99±5.80
Underweight/Healthy weight (<23.0) 76.8% (63)
Overweight/Obese (≥23.0) 23.2% (19)
Residence
Urban 67.1% (55)
Rural 32.9%(27)
Marital Status
Single 62.2% (51)
Married or domestic partnership 37.8%(31)
Highest level of education
Vocational school/Senior high or less 47.6% (39)
College, Masters, or higher 52.4% (43)
Current Employment
Student 26.8% (22)
Other 73.2% (60)
Duration of diabetes (years) 9.05±7.48
Table 4. Frequency of Adhering to Recommended Dietary Advice Received from Dietitian or Health Care Providers
% (n)
Every Day Some days Only when blood glucose is abnormal
Never
Keep track of calories 29.3% (24) 37.8% (31) 8.5% (7) 24.4% (20)
Count carbohydrates 35.4% (29) 31.7% (26) 13.4% (11) 19.5% (16)
Choose low glycemic index
foods (foods that tend to raise blood sugar slowly i.e. non-fat
milk or yogurt, whole grains, beans, green vegetables, tomatoes)
65.9% (54) 24.4% (20) 8.5% (7) 1.2% (1)
Use dietary exchanges 22.0% (18) 32.9% (27) 4.9% (4) 40.2% (33)
Keep track of fat grams 39.0% (32) 30.5%(25) 11.0% (9) 19.5% (16)
Limit sweets 59.8% (49) 25.6% (21) 8.5% (7) 6.1%(5)
Limit high fat foods (ex: deep fried) 50.0% (41) 34.2% (28) 8.5% (7) 7.3%(6)
Choose 'healthy' fats and oils (ie. vegetable oil, olive
oil) 30.5%(25) 41.5% (34) 7.3% (6) 20.7%(17)
Drink more milk 50.0% (41) 32.9% (27) 6.1%(5) 11.0% (9)
Eat more fruits and vegetables 78.1% (64) 17.1% (14) 2.4% (2) 2.4% (2)
Eat more fiber and whole grains 48.8% (40) 39.0% (32) 3.7% (3) 8.5% (7)
Eat foods high in protein 37.8% (31) 48.8% (40) 6.1%(5) 7.3% (6)
Table 5.Frequency of Viewing Nutrition Information On Labels By T1D Patients
% (n)
All the time Most of the time Sometimes Rarely Never
Calories 25.6% (21) 12.2% (10) 29.3% (24) 18.3%(15) 14.6% (12)
Carbohydrates 62.2% (51) 19.5% (16) 11.0% (9) 2.4% (2) 4.9% (4)
Saturated fat 29.3% (24) 14.6% (12) 20.7%(17) 24.4% (20) 11.0% (9)
Trans fat 35.4% (29) 12.2% (10) 20.7%(17) 18.3%(15)
13.4% (11)
Sugar 68.3% (56) 22.0% (18) 7.3% (6) 1.2% (1) 1.2% (1)
Sodium
14.6% (12) 18.3%(15) 15.9% (13) 31.7% (26) 19.5% (16)
Cholesterol 14.6% (12) 17.1% (14) 28.1% (23) 24.4% (20) 15.9% (13)
Fiber 20.7%(17) 18.3%(15) 28.1% (23) 23.2% (19) 9.8% (8)
Protein 24.4% (20) 29.3% (24) 19.5% (16) 14.6% (12) 12.2% (10)
Table 6. Barriers to adhering to meal plans among T1D patients
Statements % (n)
I do not like the foods my doctor recommends.
Strongly Agree 6.1%(5)
Agree 12.2% (10)
Neutral 40.2%(33)
Disagree 30.5%(25)
Strongly Disagree 11.0% (9)
I want to eat more foods than what my doctor recommends.
Strongly Agree 20.7%(17)
Agree 41.5% (34)
Neutral 23.2% (19)
Disagree 13.4% (11)
Strongly Disagree 1.2% (1)
My family and/or friends do not like the foods that my doctor recommends I eat.
Strongly Agree 4.9% (4)
Agree 9.8% (8)
Neutral 26.8%(22)
Disagree 41.5% (34)
Strongly Disagree 17.1% (14)
The foods my doctor recommends are too expensive.
Strongly Agree 4.9% (4)
Agree 9.8% (8)
Neutral 26.8%(22)
Disagree 41.5% (34)
Strongly Disagree 17.1% (14)
The foods that my doctor recommends are not easily accessible.
Strongly Agree 4.9% (4)
Agree 9.8% (8)
Neutral 26.8%(22)
Disagree 41.5% (34)
Strongly Disagree 17.1% (14)
I do not know how to prepare or cook the food that my doctor recommends.
Strongly Agree 4.9% (4)
Agree 9.8% (8)
Neutral 26.8%(22)
Disagree 41.5% (34)
* = value of 2.5 was omitted from the data analysis ; significance level α=0.05 from t-test
Table 7. Demographics vs. Nutrition Knowledge Questions (Mean % Accurate) Healthy Foods (non-labels)
Nutrition Knowledge Questions Nutrition Labels-Nutrition Knowledge Questions
Mean Percentage % Correct (±S.D.) p-value Mean Percentage % Correct (±S.D.) p-value
Age 0.841 0.868
≤ 29 years 61.2±17.2 70.9±20.2
≥ 30 years 60.4±17.3 70.1±20.6
Sex
Male 54.0±15.0 0.031 63.9±24.2 0.083
Female 63.3±17.3 72.8±18.4
BMI 0.797 0.344
Underweight/Healthy weight
(<23.0) 61.2±18.4 69.4±21.0
Overweight/Obese (≥23.0) 60.0±12.4 74.4±17.5
Residence 0.692 0.378
Urban 60.4±16.2 71.9±19.0
Rural 62.0±19.2 67.7±22.6
Marital Status 0.736 0.860
Single 60.4±16.8 70.9±20.4
Married or domestic partnership 61.7±17.9 70.0±20.3
Highest level of education 0.014 0.685
Vocational school/Senior high or
less 56.1±18.1 69.6±20.5
College, Masters, or higher 65.3±15.2 71.4±20.2
Current Employment 0.148 0.045
Student 56.4±16.4 77.9±15.1
Meal Plan Adherence Carbohydrate Counting Adherence
High (%) (=5 days or
more)
Low % (=4 days
or less) p value (=Every day) High (%) Moderate (%) (=Some days)
Low (%) (=Only when blood
glucose is abnormal or
Never) p value
Age 0.863 0.594
≤ 29 years 59.5 65.2 50.0 63.6 63.6
≥ 30 years 40.5 34.8 50.0 36.4 36.4
Sex 0.646 0.199
Male 21.6 30.4 43.8 18.2 21.8
Female 78.4 69.6 56.3 81.8 78.2
BMI 0.755 0.212
Underweight/Healthy
(<23.0) 78.4 78.3 93.8 72.7 72.7
Overweight/Obese
(≥23.0) 21.6 21.7 6.3 27.3 27.3
Residence 0.802 0.824
Urban 67.6 60.9 62.5 72.7 67.3
Rural 32.4 39.1 37.5 27.3 32.7
Marital Status 0.472 0.075
Single 56.8 69.6 50.0 90.9 60.0
Married or domestic
partnership 43.2 30.4 50.0 9.1 40.0
Highest level of education 0.743 0.601
Senior high school or
vocational school 48.6 56.5 56.3 36.4 47.3
College, Masters, or higher
education 51.4 43.5 43.8 63.6 52.7
Current Employment 0.878 0.522
Student 27.0 21.7 37.5 27.3 23.6
Other 73.0 78.3 62.5 72.7 76.4
* = value of 2.5 was omitted from the data analysis ; significance level α=0.05 from chi-square test (Fisher’s exact test for n≤5); Yate’s correction factor applied to samples of n ≤ 10
Table 9a. Demographics vs. Barriers 1-3
1=I do not read food labels because I don’t
think it’s important p value
2=I want to read the food labels but do
not because the labels are hard to
understand p value
3=I want to read the food labels but many of the foods I eat do not have
food labels p value
Yes No Yes No Yes No
Age 0.798 0.686 0.646
≤ 29 years 62.5% 55.6% 64.3% 57.5% 55.6% 63.6%
≥ 30 years 37.5% 44.4% 35.7% 42.5% 44.4% 36.4%
Sex 0.607 0.704 0.002
Male 23.4% 33.3% 28.6% 22.5% 7.4% 34.5%
Female 76.6% 66.7% 71.4% 77.5% 92.6% 65.5%
BMI 0.016 0.903 0.894
Underweight/Healthy
(<23.0) 71.9% 94.4% 78.6% 75.0% 74.1% 78.2%
Overweight/Obese
(≥23.0) 28.1% 5.6% 21.4% 25.0% 25.9% 21.8%
Residence 0.809 0.108 0.202
Urban 67.2% 66.7% 76.2% 57.5% 77.8% 61.8%
Rural 32.8% 33.3% 23.8% 42.5% 22.2% 38.2%
Marital Status 0.864 1.000 0.273
Single 60.9% 66.7% 61.9% 62.5% 51.9% 67.3%
Married or domestic
partnership 39.1% 33.3% 38.1% 37.5% 48.1% 32.7%
Highest level of
education 0.032 0.041 0.263
Senior high school or
vocational school 40.6% 72.2% 35.7% 60.0% 37.0% 52.7%
College, Masters, or
higher education 59.4% 27.8% 64.3% 40.0% 63.0% 47.3%
Current Employment 0.700 0.701 0.894
Student 25.0% 33.3% 23.8% 30.0% 29.6% 25.5%
Other 75.0% 66.7% 76.2% 70.0% 70.4% 74.5%