By Alex Doherty
Senior Honors Thesis Department of Nutrition
Gillings School of Global Public Health University of North Carolina at Chapel Hill
April 3, 2019
Approved:
____________________________________ Barry Popkin, Thesis Advisor
Introduction
From 1999-2000 to 2015-2016, the prevalence of adult obesity has significantly increased from 30.5% to 39.6% along with that of youth obesity from 13.9% to 18.5%1. More specifically,
the prevalence of young adult and adolescent obesity remains high at 35.7% and 20.6%,
respectively1. Neither age group has experienced a decrease in obesity prevalence and are higher
than the Healthy People 2020 goals of 14.5% for youth and 30.5% for adults, despite public health efforts to combat the obesity epidemic2. Increasingly, one method of tackling the obesity
epidemic has been the reduction of sugar sweetened beverages (SSBs). The consumption of SSBs is associated with higher caloric intake because individuals who consume any calorie-containing beverage do not tend to compensate by reducing food intake3-8. Additionally, SSB
calories do not fully explain the higher energy intake of a SSB consumer’s diet, indicating that excess calories are partially due to some dietary component independent of the SSBs
themselves6,8-12. Furthermore, high SSB consumption is associated with measures of poor dietary
quality such as low micronutrients, low fruit and vegetable consumption and lower scores on the Health Eating Index (HEI) 13-17. However, knowledge of the association between SSB
consumption and specific nutrients and food groups is limited. Further research is needed to understand the association between SSB consumption and the quality of the rest of the diet (hereafter referred to as the SSB diet). Without understanding the healthfulness of the non-SSB diet, it is unclear if recent declines in non-SSB consumption18-21 and the continued targeting of
SSBs will be sufficient to improve overall dietary quality of current SSB consumers.
Although declining SSB consumption has led to reductions in added sugar intake among adolescents and young adults, this age group still remains an important group to target for dietary interventions because they are the highest heavy consumers of SSBs (>500kcal/day).22 They are
also exposed to obesogenic environments where access to solid fats and added sugars (SoFAS, or empty calories) are easily accessed in schools, stores, and fast food restaurants23, which may
contribute to poor quality of the non-SSB diet. Furthermore, it is important to understand variation within different race/ethnic groups. The prevalence of obesity for both adults and youth are significantly higher for non-Hispanic Blacks and Hispanics when compared to non-Hispanic Whites1. African Americans and Hispanics are more likely to consume SSBs when compared to
have lower Healthy Eating Index (HEI) scores as well as lower mean adequacy ratios for several micronutrients when compared to non-Hispanic Whites25, while Hispanics have higher fruit and
vegetable consumption than African Americans and Whites26. Given these dietary differences
between race/ethnic groups, it is necessary to assess the relationship between SSB consumption and the non-SSB diet within these subpopulations.
The primary objective of this study is to evaluate differences in diet quality among SSB consumers and non-consumers in adolescents and young adults using 2009-2014 data from the National Health and Nutrition Examination Surveys (NHANES). The secondary objective is the assessment of these associations within race/ethnic subgroups.
Methods
Study Design and Population
The study population was composed of 6,426 adolescents (12 to 18 years) and young adults (19 to 29 years) from the 2009-2010, 2011-2012, and 2013-2014 waves of the National Health and Nutrition Examination Survey (NHANES). NHANES is a nationally representative, cross-sectional study of the noninstitutionalized United States population with a stratified, four-stage probability sampling design27. Certain subpopulations are oversampled including
Hispanics, non-Hispanic blacks, and lower income individuals. Diet data across all three waves of NHANES were combined to ensure a large enough sample size.
Dietary Data
Dietary data was obtained from the Diet Examination Survey28-30, where one to two 24
hour recalls are administered in a subsample of the surveyed population. Data was collected using the multiple pass method with day one from an in-person interview and day two from a telephone interview about 7-10 days later. When available, both days of dietary data were used. SSB Exposure
fruit drinks and nectars, sports drinks, energy drinks, and alcoholic beverages including beer, wine, liquor, and mixed beverages. Individuals were categorized as high or low SSB consumers based on their added sugar intake from SSBs as a percent of total calories. Data for added sugar for each beverage was obtained by linking the NHANES Dietary Data to the USDA’s Food Patterns Equivalents Database31. For each individual, added sugar was summed across all SSBs,
converted to calories by multiplying grams of added sugar by 4 kcal, and dividing by the total calories consumed. For individuals with two days of dietary data, the added sugar calories from SSBs for both days were summed and divided by the sum of the total calories consumed over both days. This method is consistent with how component scores are calculated for the simple HEI algorithm used later to measure non-SSB dietary quality32. To distinguish high and low
consumers, the 2015 World Health Organization’s (WHO) added sugar recommendation was used as a guideline. The WHO suggests adults and children reduce their free sugar intake to less than 10% of total daily calories33. Therefore, high SSB consumers included those who consumed
10% or more of their total daily calories as added sugar from SSBs. Low consumers included those who consumed between 1% and less than 10% of their total daily calories as added sugar from SSBs. Non-SSB consumers included those who consumed less than 1% of their total daily calories as added sugar from SSBs. Since the WHO guideline pertains to added sugar in the entire diet, our thresholds will conservatively categorize individuals who are “high” SSB consumers.
Non-SSB Diet Quality
Dietary quality was measured using the 2015 HEI. HEI in this study was calculated without calories or added sugar from SSBs to analyze the quality of the rest of the diet, which will be referred to as the non-SSB HEI or non-SSB diet quality. The non-SSB HEI is calculated by summing thirteen component scores, where a higher score indicates a healthier diet. Further details on the 2015 HEI are published elsewhere34. NHANES provided data for calories,
by summing the amount and dividing by the total calories across two days before applying the HEI algorithm.32 Only one day of dietary data was used to calculate the non-SSB HEI for those
individuals who did not respond to the telephone interview. For unadjusted analysis, dietary outcomes included total non-SSB HEI score and select non-SSB HEI component scores, including whole fruits, total vegetables, whole grains, saturated fat, and added sugar, while the dietary outcome for adjusted analysis was the total non-SSB HEI score.
Covariate Data
Covariate data was obtained from the NHANES Demographic questionnaires35-37. The
multivariate regression model included age, sex, race/ethnicity (Non-Hispanic Whites (referent), Non-Hispanic Blacks, and Hispanics including Mexican Americans and other Hispanics), poverty income ratio (family income as a percent of the federal poverty level), and parental education (less than high school, high school (referent), some college, and college). Instead of using individual education level for young adults (ages 19-29), no education covariate was used in the regression to avoid misclassification, as those individuals who were part way through a four-year bachelors program at the time of the survey would be grouped with those who went to college and did not complete their degree.
Statistical Analysis
All analyses were performed using NHANES dietary day 1 sample weights to derive nationally representative estimates. Since data was pooled across three waves from 2009-2014, the weights were recalculated by dividing by three38. Two-sample t-tests were used to compare
the differences between the weighted proportions of sociodemographic characteristics among SSB consumers. Linear regression models examined the association between SSB consumer type and non-SSB dietary quality while controlling for the covariates mentioned previously. The sample was stratified to separately analyze adolescents and young adults. To assess differences within race/ethnic groups, race/ethnicity was interacted with SSB consumption and tested using the Wald test. Statistical analyses were performed using STATA SE 15. Estimates were
using STATA margins and contrast postestimation commands. All hypothesis testing was two-sided with a significance level of p < 0.05.
Results
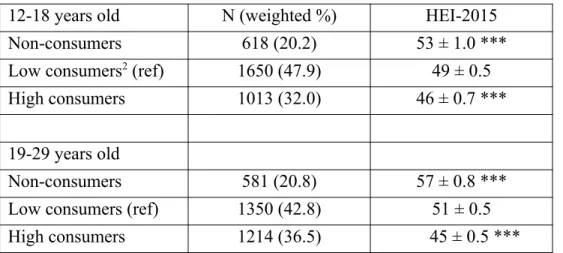
Of the 3,281 adolescents (ages 12-18) in the sample, 20.2% were non-consumers, 47.9% were low SSB consumers, and 32.0% were high SSB consumers (Table 1). Young adults (ages 19-29) show a similar pattern where, of the 3,145 individuals, non-consumers comprised 20.8% of the sample, low SSB consumers comprised 42.8%, and high SSB consumers comprised 36.5%. Non-consumers for both age groups were more likely to be female, identify as non-Hispanic white, and have a household income greater than or equal to 185% of the federal poverty level, while high consumers of either age group were more likely to be male, identify as non-Hispanic black, and have a household income less than 185% of the federal poverty level. Of the adolescents, non-consumers were more likely to have a head of household with at least one college degree. Conversely, young adult high consumers were more likely to have a head of household with, at most, a high school diploma.
In unadjusted models for both adolescents and young adults, high and low SSB
consumers consumed a greater amount of non-SSB calories when compared with non-consumers (Table 2). However, low SSB consumers were found to have a greater total energy intake even compared to high SSB consumers. Non-SSB HEI decreased as SSB consumption increased for both adolescents and young adults as well. The component that contributed most to improving non-SSB HEI scores was the score for added sugar, indicating that added sugar consumption in the non-SSB diet falls within the 2015 US Dietary Guidelines. As SSB consumption decreased, the component scores for added sugar, saturated fat, whole fruit, total vegetables, and whole grains increased for both males and females.
non-SSB HEI for high consumers was 3 points lower (p < 0.001). The predicted non-SSB HEI for young adult non-consumers was 6 points higher (p < 0.001) than low consumers, and that for high consumers was 6 points lower (p < 0.001).
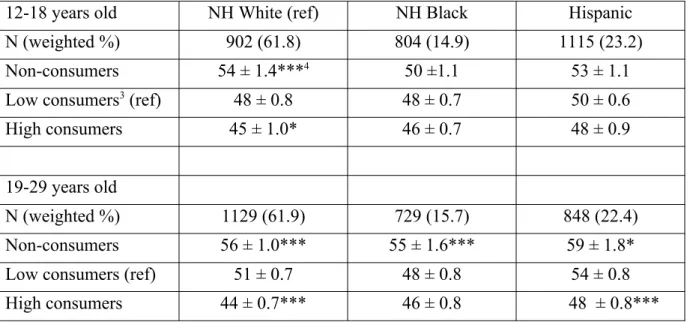
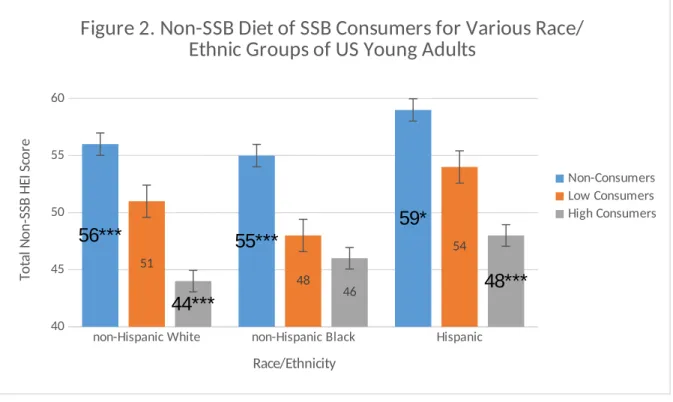
Further analysis included interactions between race/ethnic groups to assess potential disparities in non-SSB HEI scores. Similar patterns of non-SSB HEI scores in relation to SSB consumption were found for non-Hispanic Whites (NHW) when compared to the overall study population, although they vary among non-Hispanic Blacks (NHB) and Hispanics. NHW adolescents and young adults both have significantly different SSB HEI scores for non-consumers and high SSB non-consumers when compared to low SSB non-consumers (p < 0.001). Notably, NHW young adult high consumers had the lowest predicted non-SSB HEI when compared to all other groups, with a score of 44. NHB non-consumers predicted non-SSB HEI score was significantly higher from low consumers for young adults by 7 points (p < 0.001). Hispanic and NHB adolescent predicted non-SSB HEI scores were not associated with SSB consumption. Hispanic young adults, on the other hand, had predicted non-SSB HEI scores that were significantly different for SSB consumer groups. Non-consumers had a predicted score 5 points higher (p < 0.05) than low consumers and the score for high consumers was 6 points lower (p < 0.001) than low consumers. The highest predicted score was 59 points for Hispanic young adult non-consumers.
Discussion
This study examines the association between SSB consumption and the quality of the non-SSB diet among adolescents and young adults using the 2015 HEI and the most current dietary data from NHANES. In general, for both adolescents and young adults, as SSB consumption increased there was a significant decline in the total non-SSB HEI score. Adolescent non-SSB HEI scores ranged from 54 for non-consumers to 45 for high SSB
The results of this study have implications for obesity and chronic disease prevention in adolescents and young adults. Reducing SSB consumption has been suggested as an effective, stand-alone strategy to decrease total caloric intake and/or improve the quality of the diet40.
Although current SSB consumption is high, SSB consumption among adolescents and young adults has been declining18-21,41. Whether this decline is sufficient to improve diet depends on the
quality of the remainder of SSB consumers’ diets. This study suggests that while targeting SSBs alone may lead to some improvement in diet quality, it will not be a sufficient strategy due to the consistently low non-SSB HEI scores across all age and race/ethnic groups. Poor non-SSB HEI scores are driven by low HEI component scores for total vegetable, total fruit, and whole grain consumption (Table 2) indicating that these are aspects of the diet that could also benefit from targeted interventions. Future interventions for obesity and chronic disease should take this into consideration and target both reduced SSB consumption and the increased consumption of total vegetables, total fruit, and whole grains.
When non-SSB HEI scores were compared by race/ethnicity, patterns emerge for each group that have distinct implications for potential nutrition interventions. Similar to patterns found in the overall sample, there is a strong association between SSB consumption and quality of the rest of the diet among NHW, where non-SSB HEI scores decreased as SSB consumption increased. Additionally, both adolescent and young adult NHW high consumers had the poorest dietary quality across all race/ethnic groups, making NHWs the highest risk group22. Therefore,
interventions targeting SSB consumption only could possibly lead to improvement of diet quality if a reduction in SSB intake causes the non-SSB diet of high consumers to converge with that of consumers. However, it is important to note that even NHW consumers have poor non-SSB HEI scores.
In comparison, there is not a strong association between SSB consumption and non-SSB diet quality among NHBs. Among adolescents, there is no significant difference between non-consumers and low non-consumers’ non-SSB HEI scores, nor with low non-consumers and high consumers. This suggests NHB have poor overall diet quality regardless of their SSB consumption. Therefore, interventions targeting SSB consumption should also equally
Among Hispanics, results differed between adolescents and young adults. For Hispanic adolescents, there is no association between SSB consumption and dietary quality, while there is a significant association among young adults. Notably, Hispanic young adults who are high SSB consumers have a higher non-SSB HEI score than both NHW and NHB young adult high SSB consumers. In addition, Hispanic young adults were found to have some of the highest total non-SSB HEI scores when compared to NHW and NHB adolescents and young adults. This will be important for future interventions targeting Hispanic young adults’ SSB consumption. If SSBs are removed from the diet and the rest of the diet tends to be of better quality than the rest of the population, then this group may benefit solely from SSB focused interventions. Furthermore, the dietary patterns of young adult non-consumers could be used to inform culturally-relevant interventions in adolescents.
The negative association between SSB consumption and non-SSB dietary quality is consistent with previous research. Only one other study has examined the quality of the non-SSB diet, finding increased SSB consumption to be associated with lower 2010 HEI scores in both overall diet quality and the non-SSB diet for adolescents in the US42. The present study adds to
this body of literature by excluding SSBs from the diet quality calculations in a broader age group and using the most recent NHANES dietary data with the 2015 HEI. In addition, previous research has found that Hispanics have higher fruit and vegetable consumption which leads to higher total HEI scores and although they are some of the highest SSB consumers when
compared to NHW, the quality of the rest of the diet is independent of that22,24,26. It has previously
been observed that NHB have both a higher consumption of SSBs and lower total HEI scores when compared with NHW22,24,25. In addition, no other study to the best of our knowledge has
examined variation in the association between SSB consumption and non-SSB dietary quality by race/ethnic group. This study adds that the poor quality of the rest of the diet is not associated with high SSB consumption for NHB, and the quality is still poor even without the inclusion of SSBs in the score calculation.
There are several limitations to this study. The data used from a 24 hour recall is prone to recall bias and self-reported dietary data is often misreported, where energy intake and foods that are considered to be “less healthy” are underreported 43,44. This may lead to lower reporting of
overestimate non-SSB HEI scores. Additionally, only two days of dietary recall were used for this study which may incorrectly classify non-consumers or be sensitive to outliers if individuals consume foods outside of their normal dietary patterns on interview days. However, the NCI method of averaging two days of dietary data was utilized in order to limit misclassification bias when calculating SSB consumption and non-SSB HEI scores. Lastly, only 3 race/ethnic groups were used in due to small samples sizes for other races. Further research is needed to inform targeted public health interventions in other race/ethnic groups.
Despite these limitations, there are several strengths to this study. Recall data allows all foods consumed by an individual to be captured in the analysis. NHANES is a nationally representative survey which allows for conclusions to be drawn about the US population of adolescents and young adults. Some race/ethnic groups are oversampled in NHANES in order to increase sample size. This provides enough data to evaluate the association between SSB
consumption and diet quality among age and race/ethnic subpopulations which adds to the current literature on these associations and helps inform more targeted public health interventions.
Conclusions
References
1. Hales CM, Carroll MD, Fryar CD, Ogden CL. Prevalence of Obesity Among Adults and Youth: United States, 2015-2016. NCHS data brief. 2017(288):1-8.
2. Hales CM, Fryar CD, Carroll MD, Freedman DS, Ogden CL. Trends in Obesity and Severe Obesity Prevalence in US Youth and Adults by Sex and Age, 2007-2008 to 2015-2016Trends in Obesity Prevalence in US Youth and Adults, 2007-2008 to 2015-2016Letters. Jama. 2018;319(16):1723-1725.
3. DellaValle DM, Roe LS, Rolls BJ. Does the consumption of caloric and non-caloric beverages with a meal affect energy intake? Appetite. 2005;44(2):187-193.
4. Mattes RD. Dietary compensation by humans for supplemental energy provided as ethanol or carbohydrate in fluids. Physiology & behavior. 1996;59(1):179-187.
5. Mattes RD. Beverages and positive energy balance: the menace is the medium. International Journal Of Obesity. 2006;30:S60.
6. Mourao DM, Bressan J, Campbell WW, Mattes RD. Effects of food form on appetite and energy intake in lean and obese young adults. International journal of obesity (2005). 2007;31(11):1688-1695.
7. Reid M, Hammersley R, Hill AJ, Skidmore P. Long-term dietary compensation for added sugar: effects of supplementary sucrose drinks over a 4-week period. The British journal of nutrition. 2007;97(1):193-203.
8. DiMeglio DP, Mattes RD. Liquid versus solid carbohydrate: effects on food intake and body weight. Int J Obes Relat Metab Disord. 2000;24(6):794-800.
9. Bleich SN, Wolfson JA. U.S. adults and child snacking patterns among sugar-sweetened beverage drinkers and non-drinkers. Preventive medicine. 2015;72:8-14.
10. Piernas C, Mendez MA, Ng SW, Gordon-Larsen P, Popkin BM. Low- and calorie-sweetened beverages: diet quality, food intake, and purchase patterns of US household consumers. The American journal of clinical nutrition. 2014;99(3):567-577.
11. Piernas C, Ng SW, Mendez MA, Gordon-Larsen P, Popkin BM. A dynamic panel model of the associations of sweetened beverage purchases with dietary quality and food-purchasing patterns. American journal of epidemiology. 2015;181(9):661-671.
12. Ruff RR, Akhund A, Adjoian T, Kansagra SM. Calorie intake, sugar-sweetened beverage
consumption, and obesity among New York City adults: findings from a 2013 population study using dietary recalls. Journal of community health. 2014;39(6):1117-1123.
13. O'Neil CE, Nicklas TA, Liu Y, Franklin FA. Impact of dairy and sweetened beverage consumption on diet and weight of a multiethnic population of head start mothers. Journal of the American Dietetic Association. 2009;109(5):874-882.
14. Frary CD, Johnson RK, Wang MQ. Children and adolescents' choices of foods and beverages high in added sugars are associated with intakes of key nutrients and food groups. The Journal of adolescent health : official publication of the Society for Adolescent Medicine. 2004;34(1):56-63. 15. Mullie P, Deliens T, Clarys P. Relation Between Sugar-Sweetened Beverage Consumption,
Nutrition, and Lifestyle in a Military Population. Military medicine. 2016;181(10):1335-1339. 16. Sharkey JR, Johnson CM, Dean WR. Less-healthy eating behaviors have a greater association
17. Rodriguez-Artalejo F, Garcia EL, Gorgojo L, et al. Consumption of bakery products, sweetened soft drinks and yogurt among children aged 6-7 years: association with nutrient intake and overall diet quality. The British journal of nutrition. 2003;89(3):419-429.
18. Ng SW, Slining MM, Popkin BM. Turning point for US diets? Recessionary effects or behavioral shifts in foods purchased and consumed. The American journal of clinical nutrition.
2014;99(3):609-616.
19. Powell ES, Smith-Taillie LP, Popkin BM. Added Sugars Intake Across the Distribution of US Children and Adult Consumers: 1977-2012. Journal of the Academy of Nutrition and Dietetics. 2016;116(10):1543-1550.e1541.
20. Slining MM, Popkin BM. Trends in intakes and sources of solid fats and added sugars among U.S. children and adolescents: 1994-2010. Pediatric obesity. 2013;8(4):307-324.
21. Welsh JA, Sharma AJ, Grellinger L, Vos MB. Consumption of added sugars is decreasing in the United States. The American journal of clinical nutrition. 2011;94(3):726-734.
22. Han E, Powell LM. Consumption patterns of sugar-sweetened beverages in the United States. Journal of the Academy of Nutrition and Dietetics. 2013;113(1):43-53.
23. Poti JM, Slining MM, Popkin BM. Where are kids getting their empty calories? Stores, schools, and fast-food restaurants each played an important role in empty calorie intake among US children during 2009-2010. Journal of the Academy of Nutrition and Dietetics. 2014;114(6):908-917.
24. Poti JM, Mendez MA, Ng SW, Popkin BM. Highly Processed and Ready-to-Eat Packaged Food and Beverage Purchases Differ by Race/Ethnicity among US Households. The Journal of nutrition. 2016;146(9):1722-1730.
25. Raffensperger S, Kuczmarski MF, Hotchkiss L, Cotugna N, Evans MK, Zonderman AB. Effect of race and predictors of socioeconomic status on diet quality in the HANDLS Study sample. Journal of the National Medical Association. 2010;102(10):923-930.
26. Hiza HA, Casavale KO, Guenther PM, Davis CA. Diet quality of Americans differs by age, sex, race/ethnicity, income, and education level. Journal of the Academy of Nutrition and Dietetics. 2013;113(2):297-306.
27. Johnson CL, Dohrmann SM, Burt VL, Mohadjer LK. National health and nutrition examination survey: sample design, 2011-2014. Vital and health statistics Series 2, Data evaluation and methods research. 2014(162):1-33.
28. Centers for Disease Control and Prevention (CDC). National Center for Health Statistics (NCHS). National Health and Nutrition Examination Survey Data. Hyattsville, MD: U.S. Department of Health and Human Services, Centers for Disease Control and Prevention, 2009-2010
https://wwwn.cdc.gov/Nchs/Nhanes/2009-2010/DR1IFF_F.htm.
29. Centers for Disease Control and Prevention (CDC). National Center for Health Statistics (NCHS). National Health and Nutrition Examination Survey Data. Hyattsville, MD: U.S. Department of Health and Human Services, Centers for Disease Control and Prevention, 2011-2012
https://wwwn.cdc.gov/Nchs/Nhanes/2011-2012/DR1IFF_G.htm.
30. Centers for Disease Control and Prevention (CDC). National Center for Health Statistics (NCHS). National Health and Nutrition Examination Survey Data. Hyattsville, MD: U.S. Department of Health and Human Services, Centers for Disease Control and Prevention, 2013-2014
https://wwwn.cdc.gov/Nchs/Nhanes/2013-2014/DR1IFF_H.htm.
https://www.ars.usda.gov/northeast-area/beltsville-md-bhnrc/beltsville-human-nutrition-research-center/food-surveys-research-group/docs/fped-overview/. Accessed December 2018.
32. National Cancer Institute. The Healthy Eating Index – Scoring Algorithm Method.
https://epi.grants.cancer.gov/hei/hei-scoring-method.html. Updated Feb 12, 2018. Accessed December 2018.
33. Guideline: Sugars intake for adults and children. Geneva: World Health Organization; 2015. 34. Krebs-Smith SM, Pannucci TE, Subar AF, et al. Update of the Healthy Eating Index: HEI-2015.
Journal of the Academy of Nutrition and Dietetics. 2018;118(9):1591-1602.
35. Centers for Disease Control and Prevention (CDC). National Center for Health Statistics (NCHS). National Health and Nutrition Examination Survey 2009-2010 (Demographics). Hyattsville, MD: U.S. Department of Health and Human Services, Centers for Disease Control and Prevention. https://wwwn.cdc.gov/Nchs/Nhanes/2009-2010/DEMO_F.htm. Accessed December 2018. 36. Centers for Disease Control and Prevention (CDC). National Center for Health Statistics (NCHS).
National Health and Nutrition Examination Survey 2011-2012 (Demographics). Hyattsville, MD: U.S. Department of Health and Human Services, Centers for Disease Control and Prevention. https://wwwn.cdc.gov/Nchs/Nhanes/2011-2012/DEMO_G.htm. Accessed December 2018. 37. Centers for Disease Control and Prevention (CDC). National Center for Health Statistics (NCHS).
National Health and Nutrition Examination Survey 2013-2014 (Demographics). Hyattsville, MD: U.S. Department of Health and Human Services, Centers for Disease Control and Prevention. https://wwwn.cdc.gov/Nchs/Nhanes/2013-2014/DEMO_H.htm. Accessed December 2018. 38. Johnson CL, Paulose-Ram R, Ogden CL, et al. National health and nutrition examination survey:
analytic guidelines, 1999-2010. Vital and health statistics Series 2, Data evaluation and methods research. 2013(161):1-24.
39. Hurley KM, Oberlander SE, Merry BC, Wrobleski MM, Klassen AC, Black MM. The healthy eating index and youth healthy eating index are unique, nonredundant measures of diet quality among low-income, African American adolescents. The Journal of nutrition. 2009;139(2):359-364. 40. Wang YC, Orleans CT, Gortmaker SL. Reaching the Healthy People Goals for Reducing Childhood
Obesity: Closing the Energy Gap. American journal of preventive medicine. 2012;42(5):437-444. 41. Poti JM, Popkin BM, Mendez MA, Miles DR, Sotres-Alvarez D. Persistent disparities over time in
the distribution of sugar-sweetened beverage intake among children in the United States. The American journal of clinical nutrition. 2018;109(1):79-89.
42. Leung CW, DiMatteo SG, Gosliner WA, Ritchie LD. Sugar-Sweetened Beverage and Water Intake in Relation to Diet Quality in U.S. Children. American journal of preventive medicine.
2018;54(3):394-402.
43. Rasmussen LB, Matthiessen J, Biltoft-Jensen A, Tetens I. Characteristics of misreporters of dietary intake and physical activity. Public Health Nutrition. 2007;10(3):230-237.
doi:10.1017/S136898000724666X.
Table 1. Weighted1 Proportions of Demographic Descriptive Statistics for Sugar Sweetened Beverage Consumers using the NHANES 2009-2014 population aged 12-29 years.
Consumer Type (%)
N Non-consumer Low-consumer High-consumer
Ages 12-18 n = 618 n = 1650 n = 1013
Gender
Male Female
1681 1600
17.9 ac
22.4 ac 49.5
b
46.2 b 32.531.4
Race/Ethnicity2 Hispanic Non-Hispanic White Non-Hispanic Black 1115 902 804
14.7 ac 22.7 ac 13.5 ac
57.1 b 43.0 b 50.5 b
28.1 34.3 35.9 Household Income
as % of Poverty
< 185 % ≥ 185 %
1714 1567
16.6 ac 22.8 ac
48.3 b 47.6 b
35.1 29.7 HH Education
Less than High School
High School Some College College or higher
371 1241
902 666
11.4 ac 16.4 ac 20.5 ac 26.7 a
55.9 b 45.2 46.4 b 49.5 b
32.8 38.4 33.1 23.8
Ages 19-29 n = 581 n = 1350 n = 1214
Gender
Male Female
1553 1592
18.8 ac 22.9 ac
43.8 b 41.7 b
37.5 35.5 Race/Ethnicity Hispanic Non-Hispanic White Non-Hispanic Black 848 1129 729
13.0 ac 24.6 ac 13.0 ac
45.1 41.8 b
42.1
41.8 33.7 44.8 Household Income
as % of Poverty
< 185 % ≥ 185 %
1729 1416
17.6 a 23.6 ac
42.4 43.0 b
40.0 33.3
1. Data collected from NHANES 2009-2014 and corrected for complex survey design using day one dietary sample weights.
2. Excluded from the demographics were other race/ethnicities such as Asians, American Indians, etc. due to low sample size.
a. Proportions are different when compared between non-consumers and low consumers at p < 0.05*
c. Proportions are different when compared between non-consumers and high consumers at p < 0.05*
Table 2. Unadjusted 2015 Healthy Eating Index scores and Total Energy Intake for Sugar Sweetened Beverage Consumers using the NHANES 2009-2014 population aged 12-29 years1
Non-consumer Low-consumer High-consumer All consumers
Ages 12-18 Male Female Male Female Male Female Male Female
n = 300 n = 318 n = 846 n = 804 n = 535 n = 477 n = 1681 n = 1599
Total energy Non-SSB kcal
SSB kcal
1850 ± 100
1.6 ± 0.5
1495 ± 59
1.5 ± 0.5
2066 ± 44
130 ± 4.1
1629 ± 31
103 ± 3.1
1703 ± 55
383 ± 18
1198 ± 44
287 ± 11
1909 ± 34
189 ± 8.5
1463 ± 25
138 ± 6.3
Added Sugar Score (out of 10) Density (%)
Saturated Fat Score (out of 10) Density (%)
Whole Fruit Score (out of 5) Servings (cup. eq)
Total Vegetables Score (out of 5) Servings (cup. eq)
Whole Grains Score (out of 10) Servings (cup. eq)
8.7 ± 0.1 8.0 ± 0.4
5.3 ± 0.3 11.7 ± 0.3
2.9 ± 0.2 0.4 ± 0.0
2.7 ± 0.1 0.6 ± 0.0
3.2 ± 0.3 0.5 ± 0.0
8.4 ± 0.2 8.8 ± 0.4
5.1 ± 0.3 11.9 ± 0.3
3.1 ± 0.2 0.5 ± 0.0
2.9 ± 0.1 0.7 ± 0.0
3.4 ± 0.3 0.6 ± 0.1
8.5 ± 0.1 8.5 ± 0.2
4.6 ± 0.2 12.4 ± 0.2
2.5 ± 0.1 0.3 ± 0.0
2.3 ± 0.1 0.5 ± 0.0
2.8 ± 0.2 0.5 ± 0.0
8.3 ± 0.1 9.2 ± 0.3
4.7 ± 0.2 12.4 ± 0.2
2.3 ± 0.1 0.3 ± 0.0
2.7 ± 0.1 0.7 ± 0.0
2.7 ± 0.1 0.4 ± 0.0
8.7 ± 0.1 7.7 ± 0.3
4.3 ± 0.2 12.7 ± 0.2
1.6 ± 0.1 0.2 ± 0.0
2.5 ± 0.1 0.6 ± 0.0
2.2 ± 0.2 0.4 ± 0.0
8.6 ± 0.1 8.2 ± 0.3
4.7 ± 0.2 12.5 ± 0.3
1.6 ± 0.2 0.3 ± 0.0
2.7 ± 0.1 0.7 ± 0.0
1.8 ± 0.2 0.3 ± 0.0
8.6 ± 0.1 8.2 ± 0.2
4.6 ± 0.2 12.4 ± 0.1
2.2 ± 0.1 0.3 ± 0.0
2.4 ± 0.1 0.6 ± 0.0
2.7 ± 0.1 0.4 ± 0.1
8.4 ± 0.1 8.8 ± 0.2
4.8 ± 0.1 12.3 ± 0.1
2.3 ± 0.1 0.3 ± 0.0
2.8 ± 0.1 0.7 ± 0.0
2.6 ± 0.1 0.4 ± 0.1
Total HEI 52.9 ± 1.3 53.2 ± 1.2 48.5 ± 0.6 49.2 ± 0.6 46.0 ± 0.6 45.7 ± 1.2 48.5 ± 0.4 49.0 ± 0.5
Ages 19-29 n = 259 n = 322 n = 682 n = 668 n = 612 n = 602 n = 1553 n = 1592
Total energy Non-SSB kcal
SSB kcal
1904 ± 85
2.3 ± 0.7
1504 ± 48
2.1 ± 0.9
2263 ± 62
150 ± 5.7
1754 ± 36
119 ± 5.0
1865 ± 50
455 ± 14
1379 ± 32
344 ± 12
2046 ± 37
237 ± 8.3
1564 ± 22
172 ± 6.4
Added Sugar Score (out of 10) Density (%)
Saturated Fat Score (out of 10) Density (%)
Whole Fruit
9.4 ± 0.1 5.5 ± 0.3
5.4 ± 0.3 11.5 ± 0.3
8.9 ± 0.1 7.3 ± 0.3
5.9 ± 0.3 11.1 ± 0.3
9.3 ± 0.1 6.1 ± 0.2
5.0 ± 0.2 12.0 ± 0.2
8.8 ± 0.1 7.7 ± 0.2
5.2 ± 0.2 12.0 ± 0.2
9.1 ± 0.1 6.2 ± 0.3
4.4 ± 0.2 12.6 ± 0.2
8.7 ± 0.1 7.6 ± 0.3
4.8 ± 0.2 12.4 ± 0.2
9.2 ± 0.1 6.0 ± 0.1
4.9 ± 0.1 12.1 ± 0.1
8.8 ± 0.1 7.5 ± 0.2
Score (out of 5) Servings (cup. eq)
Total Vegetables Score (out of 5) Servings (cup. eq)
Whole Grains Score (out of 5) Servings (cup. eq)
2.4 ± 0.2 0.4 ± 0.1
2.9 ± 0.1 0.7 ± 0.0
3.1 ± 0.3 0.5 ± 0.0
3.1 ± 0.2 0.6 ± 0.1
3.4 ± 0.1 0.9 ± 0.0
3.9 ± 0.3 0.7 ± 0.1
1.8 ± 0.1 0.2 ± 0.0
3.0 ± 0.1 0.7 ± 0.0
2.1 ± 0.1 0.3 ± 0.0
2.5 ± 0.1 0.4 ± 0.0
3.3 ± 0.1 0.8 ± 0.0
2.6 ± 0.1 0.4 ± 0.0
1.1 ± 0.1 0.1 ± 0.0
2.8 ± 0.1 0.7 ± 0.0
1.7 ± 0.1 0.3 ± 0.0
1.4 ± 0.2 0.2 ± 0.0
3.1 ± 0.1 0.8 ± 0.0
1.9 ± 0.2 0.3 ± 0.0
1.6 ± 0.1 0.2 ± 0.0
2.9 ± 0.1 0.7 ± 0.0
2.1 ± 0.1 0.3 ± 0.0
2.2 ± 0.1 0.3 ± 0.0
3.2 ± 0.0 0.8 ± 0.0
2.6 ± 0.1 0.4 ± 0.0
Total HEI 54.8 ± 1.1 57.7 ± 0.9 50.5 ± 0.7 52.3 ± 0.6 45.0 ± 0.6 46.2 ± 0.6 49.2 ± 0.4 51.4 ± 0.4
1. Data collected from NHANES 2009-2014 and corrected for complex survey design using day one dietary sample weights. Results are predicted means and are not adjusted for relevant sociodemographic covariates.
Table 3. Non-SSB Diet Quality of SSB Consumers by Age Group1
12-18 years old N (weighted %) HEI-2015
Non-consumers 618 (20.2) 53 ± 1.0 ***
Low consumers2 (ref) 1650 (47.9) 49 ± 0.5
High consumers 1013 (32.0) 46 ± 0.7 ***
19-29 years old
Non-consumers 581 (20.8) 57 ± 0.8 ***
Low consumers (ref) 1350 (42.8) 51 ± 0.5
High consumers 1214 (36.5) 45 ± 0.5 ***
1. Data collected from NHANES 2009-2014 and weighted proportion is adjusted for complex survey design using day one dietary sample weights. Results are adjusted for relevant sociodemographic covariates.
2. SSB consumption was categorized as non-consumers, low consumers, and high consumers where non-consumers consume less than 1% of their total daily calories as added sugar from SSBs, low-consumers consume between 1% and less than 10% of their total daily calories as added sugar from SSBs, and high-consumers consume 10% or more of their total daily calories as added sugar from SSBs.
Significant when compared to low SSB consumers (referent) at p < 0.05*, p < 0.01**, or p < 0.001***
Table 4. Non-SSB Diet Quality of SSB Consumers for Various Race/Ethnic Groups1, by Age
Group2
12-18 years old NH White (ref) NH Black Hispanic
N (weighted %) 902 (61.8) 804 (14.9) 1115 (23.2)
Non-consumers 54 ± 1.4***4 50 ±1.1 53 ± 1.1
Low consumers3 (ref) 48 ± 0.8 48 ± 0.7 50 ± 0.6
High consumers 45 ± 1.0* 46 ± 0.7 48 ± 0.9
19-29 years old
N (weighted %) 1129 (61.9) 729 (15.7) 848 (22.4)
Non-consumers 56 ± 1.0*** 55 ± 1.6*** 59 ± 1.8*
Low consumers (ref) 51 ± 0.7 48 ± 0.8 54 ± 0.8
High consumers 44 ± 0.7*** 46 ± 0.8 48 ± 0.8***
1. Model was fitted using interaction terms between SSB Consumers and Race/Ethnicity 2. Data collected from NHANES 2009-2014. Results are adjusted for relevant
sociodemographic covariates as well as complex survey design using day one dietary sample weights
3. SSB consumption was categorized as non-consumers, low consumers, and high consumers where non-consumers consume less than 1% of their total daily calories as added sugar from SSBs, low-consumers consume between 1% and less than 10% of their total daily calories as added sugar from SSBs, and high-consumers consume 10% or more of their total daily calories as added sugar from SSBs.
4. 2015 Healthy Eating Index Total score ± SD
Significant when compared to low SSB consumers (referent) within same race/ethnic group at p < 0.05*, p < 0.01**, or p < 0.001***
non-Hispanic White non-Hispanic Black Hispanic 40
45 50 55 60
54***
50
53
48 48 50
45* 46 48
Figure 1. Non-SSB Diet Quality of SSB Consumers for Various
Race/Ethnic Groups of US Adolescents
Non-Consumer Low Consumer High Consumer
Race/Ethnicity
To
ta
l N
o
n
-S
SB
H
EI
S
co
re
1. Model was fitted using interaction terms between SSB Consumers and Race/Ethnicity 2. Data collected from NHANES 2009-2014. Results are adjusted for relevant
sociodemographic covariates as well as complex survey design using day one dietary sample weights
3. SSB consumption was categorized as non-consumers, low consumers, and high consumers where non-consumers consume less than 1% of their total daily calories as added sugar from SSBs, low-consumers consume between 1% and less than 10% of their total daily calories as added sugar from SSBs, and high-consumers consume 10% or more of their total daily calories as added sugar from SSBs.
4. 2015 Healthy Eating Index Total score ± SD
Significant when compared to low SSB consumers (referent) within same race/ethnic group at p < 0.05*, p < 0.01**, or p < 0.001***
non-Hispanic White non-Hispanic Black Hispanic 40
45 50 55 60
56*** 55*** 59*
51
48
54
44*** 46
48***
Figure 2. Non-SSB Diet of SSB Consumers for Various Race/
Ethnic Groups of US Young Adults
Non-Consumers Low Consumers High Consumers
Race/Ethnicity
To
ta
l N
o
n
-S
SB
H
EI
S
co
re
1. Model was fitted using interaction terms between SSB Consumers and Race/Ethnicity 2. Data collected from NHANES 2009-2014. Results are adjusted for relevant
sociodemographic covariates as well as complex survey design using day one dietary sample weights
3. SSB consumption was categorized as non-consumers, low consumers, and high
consumers where low consumers were defined as those who consumed between 1% and < 10% of their total daily calories in added sugar from SSBs
4. 2015 Healthy Eating Index Total score ± SD
Significant when compared to low SSB consumers (referent) within same race/ethnic group at p < 0.05*, p < 0.01**, or p < 0.001***