Variation of annual effective dose from external
ionizing radiation among radiation workers of
Bahawalpur Institute of Nuclear Medicine and
Oncology (BINO), Pakistan
INTRODUCTION
The ionizing radiation sources involving
X-rays, gamma rays and beta particles, being
used for cancer diagnosis and its treatment.
Bahawalpur Institute of Nuclear Medicine &
Oncology (BINO), is one of the institutes
working under the umbrella of Pakistan
Atomic Energy Commission (PAEC). BINO has
acquired its repute as an active operational
treatment in the region. The radiation
equipment
amenities
entail;
cobalt-60
teletherapy unit, super+icial X-rays machine,
high dose rate Brachytherapy, single-photon
emission
computed
tomography,
dose
calibrator, mammography, conventional
X-rays, dexa unit and unsealed radioactive
sources such as Technetium-99 m,
Iodine-131, Iodine-125.
In this study the relative distribution in
M.A. Gadhi
1,4*, Sh. Fatmi
1, M.Sh. Gadhi
2, U. Mahmood
1, M. Shakil
3,
S.A. Buzdar
41Bahawalpur Institute of Nuclear Medicine and Oncology (BINO), Pakistan Atomic Energy Commission Bahawalpur, Pakistan
2Institute of Geology, University of the Punjab, Lahore, Pakistan 3Department of Physics, University of Gujrat, Pakistan
4Medical Physics Research Group, Department of Physics, the Islamia University of Bahawalpur, Pakistan
ABSTRACT
Background: The aim of the study was to analyze the effec ve dose record of occupa onally exposed radia on workers at Bahawalpur Ins tute of Nuclear Medicine and Oncology department. Materials and Methods: Annual effec ve doses of occupa onally exposed workers were measured by film badge dosimetry by sending the dosimeters to Radia on Dosimetry Laboratory (RDL), Pakistan Ins tute of Nuclear Science and Technology (PINSTECH), Islamabad, Pakistan. 46 Radia on workers dose records were studied for a period of 14-years (2000-13). Professionally exposed radia on workers were divided into groups depending upon their professions. Results: Average effec ve doses of oncologists, nuclear physicians, medical physicists, radia on technologists, nurses and other suppor ng staff were in the range of 0.64-1.86, 0.61-2.27, 0.63-1.74, 0.67-2.53, 0.65-2.31 and 0.68-1.79 mSv respec vely. The highest annual dose received by radia on technologist was 4.95 mSv. Nobody received the radia on dose greater than 5 mSv in any year and no overexposure case has been no ced throughout the study period. Conclusion: The results revealed that occupa onally exposed individuals received doses lower than the recommended annual limits of 20 mSv y-1. This study provides basis to set up ac on level that is obligatory by Pakistan Nuclear Regulatory Authority, Pakistan.
Keywords:Effective dose, occupational exposure, dose limits, ionizing radiation.
*Corresponding author:
Dr. Muhammad Asghar Gadhi, Fax: +92 62 9255331
E-mail: asghargadhi@gmail.com
Revised: Sept. 2015
Accepted: Nov. 2015
Int. J. Radiat. Res., July 2016; 14(3): 229-235
►
Original article
DOI: 10.18869/acadpub.ijrr.14.3.229
occupational radiation doses received by the
health staff was observed. The dose intervals
are prede+ined by United Nation Scienti+ic
Committee on the Effects Atomic Radiation
(UNSCEAR) for each major practice involving
ionizing radiations. This evaluation suggests an
approximation of the average individuals risk
in the occupational workforce. It also serves
to establish action level for regulatory
purposes.
The Basic Safety Standard (BSS)
(1, 2)has
prescribed individual monitoring employed
to work in the controlled areas and who may
receive signi+icant exposure. Professionals
that
mainly
concerned
are
radiation
oncologists, diagnostic radiologists, medical
physicists, radiographers, technicians and
other
supportive
staff
(3, 4).
Several
regulatory bodies at international and
national level have provided guidelines for
radiation safety and protection of both
radiation staff and the public. These include
International
Commission
for
Radiation
Protection (ICRP)
(5), International Atomic
Energy Agency (IAEA)
(6)and at national
level, Pakistan Nuclear Regulatory Authority
(PNRA)
(7). PNRA has adopted dose limits of
occupational exposure for radiation workers
as recommended by ICRP and IAEA
(1, 8).
Occupational exposure of all the registered
radi-ation workers is measured on routine
basis for main-taining the dose record. It is an
essential part of the process of monitoring the
exposure of individuals to radiation and
supports the overall objectives of monitoring.
Records provide support for decision-making,
demonstrate
and
facilitate
regulatory
compliance. ‘Exposed workers’ refer to all
workers who are subject to individual radiation
dose assessment
(9).
The main objective of this analysis is to
determine
the
radiation
safety
and
protection status of occupationally exposed
staff at BINO within the past 14-years of
activities and to compare the +indings with
dose limits stated by international safety
standards
(1, 8)and other published work. All
exposed individuals received dose less than 5
mSv for reported period. No overexposure
recorded in the analysis period (2000-13). The
current investigation includes the overall status
of radiation protection measures and safety of
workers during the time period (2000–13). In
this study, the data of 46 employees working in
BINO has been analyzed for 2000-2013.
MATERIALS
AND METHODS
Medical physicist has a fundamental role in
the implementation of radiation protection in
all radiological activities in an institute
(10-12).
Medical
physicist
(Radiation
Protection
Of+icer (RPO)) in BINO has assigned the task
of personal and area monitoring to make sure
the radiological safety of occupational personnel
and to ensure that the limits recommended by
PNRA are not surpassed. In this regard, on the
whole 46 occupationally exposed workers
engaged in nuclear medicine, radiation therapy
and radiology at BINO has been analyzed. The
radiation worker, who served for whole
calendar year are included in this analysis. The
details about number of occupational workers
serving in the reported years are presented in
results.
Film
Badge
Dosimetry
(FBD)
method
presents an economical solution with the
provision to maintain permanent record of
doses in the form of processed +ilms
(13). A single
piece of +ilm is capable of recording radiation
exposure due to beta, gamma and X-rays over
a wide range of energies covering a wide doses
range from 0.1 mSv to 18 Sv
(14). The
calibration of +ilms has been done by the
Secondary Standard Dosimetry Laboratory
(SSDL) on cubical polymethyl methacrylate
water phantom using gamma sources (cobalt-60
and cesium-137). The evaluation of whole-body
effective dose is carried out by using the dose
assessment algorithm
(15). RDL is responsible for
providing personal dosimetry services at
national level. Both the RDL and the SSDL are
bound to regularly take part in inter comparison
services regarding personal dosimeters planned
by IAEA and IAEA (RCA) at the international and
regional level. The results are in consistency
with the standards and remain within the
proclaim curves made available by the IAEA for
personal dosimetry purposes
(16).
Film dosimeters are used for monitoring of
occupational exposure to radiation workers at
BINO. Each +ilm is assigned a unique ID, wearer’s
name and designation for traceability. These
dosimeters are obtained from RDL, Islamabad in
last week of every month. These are replaced to
all radiation workers on +irst calendar date and
used dosimeters are sent back to RDL for dose
assessment. The results are maintained at
RPO of+ice since 2000 to date. In case of high
dose of an individual, concerned individual and
radiation safety committee at the institute are
conversant thus to look into the causes of high
dose and to verify its realness. If the realness is
not established, the said dose is obliterated from
the dose record. Each worker is instructed to
wear the +ilm badge on the upper torso. An
awareness drive has been initiated in 2012.
The statistical software like Microsoft Excel &
SPSS 16.0 was used for statistical data
analysis. End note was used for reference
management. Average annual effective dose, std.
deviation were the statistical test.
RESULTS
PNRA has adopted in Pakistan the effective
dose limit (20 mSv y
-1) for uniform whole body
exposure for occupational workers as allowed
by ICRP and IAEA
(1, 8). The average annual
collective effective dose per worker was
remained in the range 0.66 -2.09 mSv. The
distribution of the annual individual doses in
the years 2000-13 and separately in 2013 is
depicted in table 1.
The 17%, 81% and 2% of workers remained
in 0-0.99, 1-2.99 and 3-4.99 mSv effective dose
ranges respectively whereas when separately
analyzed for 2013, it was found that 97% and
only 3% of workers remained in 0-0.99 and
1-1.99 mSv respectively. The analysis of the data
has indicated a signi+icant improvement in
radiation protection status in the institute
during 2013.
The result of annual average effective dose
(AAED) is a sign of general tendency of
occupational exposure in a particular type of
radiation work during a year. In table 2,
distributions of annual average effective
doses of occupational groups are presented
for investigated years. The range for
oncologists, nuclear physicians, medical
physicists, radiation technologists, nurses
and other supportive staff are 0.64-1.86,
0.61-2.27, 0.63-1.74, 0.67-2.53, 0.65-2.31
and 0.68-1.79 mSv respectively. Higher
doses of radiation workers as reported by
various researchers
(17-22)are listed in table
3 for comparison. The results of current
analysis are comparable to other researchers
(17-22).
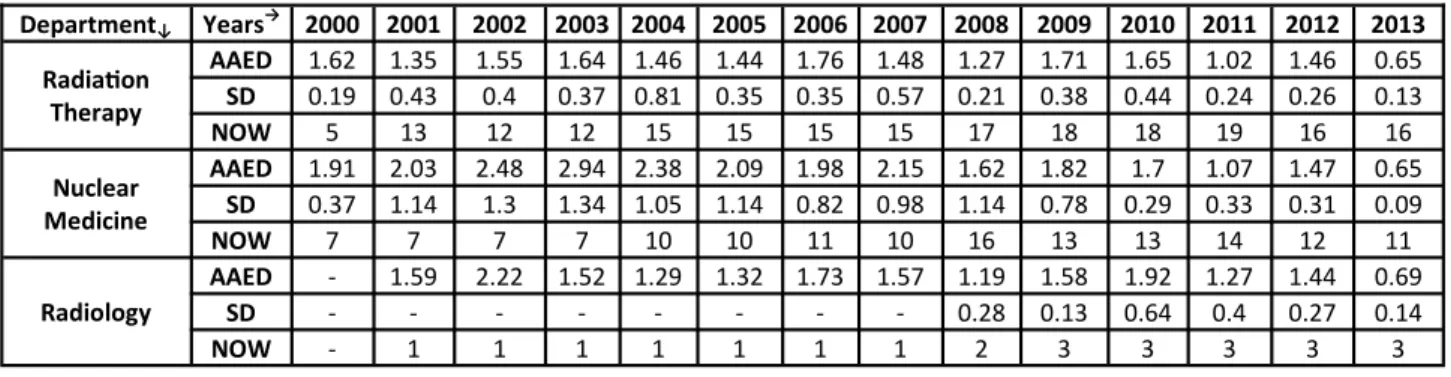
The distribution of radiation workers and
their annual average doses as well as
standard deviation during 2000-13 in
radiation therapy, nuclear medicine and
radiology are depicted in table 4.
These values for radiation therapy,
nuclear medicine and radiology remain in
the range 0.65-1.76, 0.65-2.94, and 0.69-2.22
mSv respectively.
Average dose per occupational worker in all
medical facilities exhibit a decreasing trend in
the reported period. This could be the result of
effective implementation of radiation protection
protocols
(7). Table 5 shows that the average
dose per occupational worker is high in nuclear
medicine as compared with other departments
till 2009 and then comparable for rest of the
years.
In order to observe the dose distribution as
per
different
prede+ined
dose
intervals
according
to
UNSCEAR
work
sheets
of
occupational dose group, i.e. medical uses
(23),
the number of workers in radiation therapy,
nuclear medicine and radiology departments
and their average annual effective doses are
presented in table 6. The result shows that 18%,
14% & 21% and 82%, 86%, & 79% of the total
workers
of
radiation
therapy,
nuclear
medicine and radiology are in the dose range
from MDL (minimum detectable limit) to 0.99
and 1.00 to 4.99 mSv respectively. No radiation
worker’s exposure falls in other dose ranges i.e.
5-9.99, 10-14.99, 15-19.9, 20-29.99, 30-50 and >
50 mSv.
Years Dose range (mSv) Percentage of Radia on workers (%)
2000-2013
0-0.99 16.58
1-2.99 81.55
3-4.99 1.87
2013
0-0.99 96.77
1-1.99 3.22
2-4.99 -
Table 1. Distribu on of the annual individual doses for 2000-2013 and separately for 2013.
Table 2. Distribu ons of annual average effec ve doses in mSv (AAED), Standards devia on (SD) and number of radia on
workers (NOW) of occupa onal groups for inves gated years (2000-13).
Profession↓ Years→ 2000 2001 2002 2003 2004 2005 2006 2007 2008 2009 2010 2011 2012 2013
Oncologists
AAED 1.68 1.86 1.28 1.54 1.29 1.54 1.43 1.02 1.16 1.65 1.35 1.09 1.50 0.64
SD 0.08 0.42 0.21 0.06 0.15 0.12 0.31 0.57 0.36 0.25 0.20 0.40 0.37 0.10
No. 3 3 3 2 4 4 3 2 4 5 5 6 5 5
Nuclear Physicians
AAED 2.23 1.73 1.60 2.27 1.86 1.40 1.34 1.56 1.14 1.57 1.64 0.67 1.37 0.61
SD - - - 0.22 0.31 0.18 0.95 0.41 0.27 0.35 0.20 0.01
No. 1 1 1 1 1 2 3 2 4 3 3 4 3 2
Medical Physicists
AAED - - - 1.10 1.38 1.30 1.74 1.6 1.13 1.67 1.68 1.06 1.29 0.63
SD - - - 0.22 0.04 0.03 0.42 0.07 0.13 0.14 0.05 0.06
No. - - - 1 1 2 2 2 3 3 3 3 3 3
Radia on Technologists
AAED 1.81 2.02 2.52 2.48 2.53 1.96 2.19 2.11 1.91 1.72 1.90 1.15 1.56 0.67
SD 0.39 1.14 1.29 1.27 1.17 1.16 0.71 0.94 1.09 0.76 0.38 0.23 0.37 0.16
No. 7 7 7 7 10 11 11 11 12 10 10 10 9 9
Nurses
AAED - 1.0 1.78 2.31 1.63 1.63 1.77 1.90 1.25 1.73 1.84 1.10 1.39 0.65
SD - 0.19 0.52 1.26 0.61 0.43 0.33 0.66 0.16 0.53 0.57 0.28 0.18 0.10
No. - 5 5 5 5 5 4 5 7 7 7 7 7 7
Suppor ng Staff
AAED 1.53 1.38 1.54 1.62 1.04 1.32 1.74 1.06 1.14 1.79 1.49 1.09 1.36 0.68
SD - 0.27 0.07 0.27 0.48 0.06 0.34 0.40 0.32 0.60 0.28 0.12 0.11 0.15
No. 1 5 4 4 5 2 4 4 5 6 6 6 4 4
Table 3. Higher doses of radia on workers as reported by various researchers (17-22).
Study Highest Dose (mSv)
S. A. Memon et al. (17) 3.6
G. K. Korir et al. (18) 7.4
H. Piwowarska-Bilska et al. (19) 9.5
F. Hasford et al. (20) 9.8
K. Masood (21) 7.42
S. A. Memon et al. (22) 7.78
Current Study 4.95
Table 4. The distribu on of number of radia on workers (NOW) and their annual average effec ve doses (AAED) in mSv as well
as standards devia on (SD) during 2000-13 in radia on therapy, nuclear medicine and radiology.
Department↓ Years→ 2000 2001 2002 2003 2004 2005 2006 2007 2008 2009 2010 2011 2012 2013
Radia on Therapy
AAED 1.62 1.35 1.55 1.64 1.46 1.44 1.76 1.48 1.27 1.71 1.65 1.02 1.46 0.65
SD 0.19 0.43 0.4 0.37 0.81 0.35 0.35 0.57 0.21 0.38 0.44 0.24 0.26 0.13
NOW 5 13 12 12 15 15 15 15 17 18 18 19 16 16
Nuclear Medicine
AAED 1.91 2.03 2.48 2.94 2.38 2.09 1.98 2.15 1.62 1.82 1.7 1.07 1.47 0.65
SD 0.37 1.14 1.3 1.34 1.05 1.14 0.82 0.98 1.14 0.78 0.29 0.33 0.31 0.09
NOW 7 7 7 7 10 10 11 10 16 13 13 14 12 11
Radiology
AAED - 1.59 2.22 1.52 1.29 1.32 1.73 1.57 1.19 1.58 1.92 1.27 1.44 0.69
SD - - - 0.28 0.13 0.64 0.4 0.27 0.14
NOW - 1 1 1 1 1 1 1 2 3 3 3 3 3
Years Average Annual Effec ve Dose (mSv)
Nuclear Medicine Radia on Therapy Radiology
2000 1.91 1.62 -
2001 2.03 1.35 1.59
2002 2.48 1.55 2.22
2003 2.94 1.64 1.52
2004 2.38 1.46 1.29
2005 2.09 1.44 1.32
2006 1.98 1.76 1.73
2007 2.15 1.48 1.57
2008 1.62 1.27 1.19
2009 1.82 1.71 1.58
2010 1.7 1.65 1.92
2011 1.07 1.02 1.27
2012 1.47 1.46 1.44
2013 0.65 0.65 0.69
Table 5. Average annual effec ve dose (mSv) per occupa onal workers for 2000-13 for nuclear medicine, radia on therapy and
radiology.
Table 6. Distribu on of number of Radia on workers (NOW) in different effec ve dose intervals with their annual average
effec ve dose (AAED) in mSv in radia on therapy, nuclear medicine and radiology during 2000-13.
Range Years
Radia on Therapy Nuclear Medicine Radiology
MDL-0.99 4.99-1.0 MDL-0.99 4.99-1.0 MDL-0.99 4.99-1.0
NOW AAED NOW AAED NOW AAED NOW AAED NOW AAED NOW AAED
2000 - - 5 1.62 - - 7 1.91 - - - -
2001 2 0.8 11 1.45 - - 7 2.03 - - 1 1.59
2002 - - 12 1.55 - - 7 2.48 - - 1 2.22
2003 - - 12 1.64 - - 7 2.94 - - 1 1.52
2004 2 0.56 13 1.6 - - 10 2.38 - - 1 1.29
2005 1 0.64 14 1.5 - - 10 2.09 - - 1 1.32
2006 - - 15 1.76 - - 11 1.98 - - 1 1.73
2007 3 0.75 12 1.66 - - 10 2.15 1 1.57
2008 3 0.9 14 1.35 4 0.51 12 1.97 1 0.99 1 1.39
2009 - - 18 1.71 2 0.52 11 2.05 - - 3 1.58
2010 - - 18 1.65 - - 13 1.7 - - 3 1.92
2011 11 0.87 8 1.23 3 0.53 11 1.21 1 0.89 2 1.46
2012 - - 16 1.46 - - 12 1.42 - - 3 1.44
2013 15 0.62 1 1.08 11 0.65 - - 3 0.69 - -
Table 7. Comparison of average annual effec ve doses in Nuclear
Medicine, Radia on Therapy and Radiology in present inves ga on with other researchers (14, 19-21, 24-26).
Department Authors
Nuclear Medicine
(mSv)
Radia on Therapy
(mSv)
Radiology (mSv)
Jabeen A et al. (14) 1.55 1.17 1.47
Piwowarska-Bilska H et al. (19) 2.47 -
-Hasford F et al. (20) 0.63 0.16 0.76
Masood K et al. (21) 1.12 0.88 0.52
Pvaluckas PK et al. (24) 1.67 1.48 1.87
Kamenopoulou V et al. (25) 2.27 2 3.86
Weizhang W et al. (26) 1.4 1.25 1.85
Current Study 1.88 1.43 1.49
Annual average effective dose values for
nuclear medicine, radiation therapy and
radiology when averaged over the investigated
period were 1.88, 1.44 and 1.49 mSv
respectively. These values are comparable with
other investigators
(14, 19-21, 24-26)as shown in
table 7.
DISCUSSION
The analysis of the data indicates a signi+icant
improvement in radiation protection status in
the institute in 2013. Initially the analysis was
done in 2012, but later, a comprehensive
campaign was launched including a series of
lectures, practical demonstrations about the
concept of time, distance and shielding (TDS)
(gold standards in radiation protection) and
instructions on effective use of the +ilm
dosimeters.
Consequently
the
radiation
protection has been signi+icantly improved as
shown in table 1.
The maximum annual dose received by
one radiation technologist working in
nuclear medicine (NM) hot lab was reported
4.95 mSv in 2004 (24.75 % of 20 mSv). It is
expected that in nuclear medicine department,
during the processes of separation, solvent
extraction, puri+ication, patient work and
handling of the open sources in a hot laboratory
will result in raise the overall and average
values of radiation exposures. The effective
dose of one staff nurse (4.50 mSv, 22.50 % of
20 mSv) was noticed as 2
ndhighest effective
dose received; again she was performing her
duties in indoor ward and nuclear medicine
hot lab dealing with high dose Iodine-131
therapy patients. However, the received dose in
both cases is less than 25% of the permissible
limit. Remaining most of the workers (98 %)
receive the annual average effective dose less
than 3 mSv. It is clear from data presented in
this exploration that the average annual dose
for individual workers is well below the
allowed dose limit recommended by ICRP, IAEA
and PNRA
(1, 7, 8). This analysis makes a point for
authorities to become vigilant for the staff of
nuclear medicine department. Although the
doses are well below the allowed limit in this
department, yet it is imperative to further
strengthen the principle of As Low As
Reasonably Achievable as a special case. It is
the backbone of all radiation protection
practices.
The values for radiation therapy, nuclear
medicine and radiology were remained in
the range 0.65-1.76, 0.65-2.94, and 0.69-2.22
mSv respectively. Relatively higher average
annual effective doses trend was seen in nuclear
medicine department as compared with other
departments but within the acceptable limit.
According to the literature, Mosley
et al., the
annual effective dose of a radiation worker
working in a nuclear medicine department
(without PET) was about 2.0 mSv
(27), our value
for nuclear medicine is relatively higher than 2
but within permissible limit. Working with the
open sources during the processes of separation,
solvent extraction, puri+ication and patient work
in hot lab, positioning the patient on camera and
imaging process, are the main cause of more
occupational exposure in comparison with
radiotherapy that was done with sealed
radioactive sources. In radiotherapy and
radiology, the staff has to be present in the
control room (shielded from treatment room)
during irradiation of patient, therefore, lessening
the occupational exposure values
(28).
The data presented in the current study has
revealed that not only the individual radiation
exposures but also the compliance of radiation
protection and safety practices are as per the
IAEA and PNRA guidelines. The tendency over
the last 14 years con+irmed strong consistency
with the guidelines in force. This analysis
encourages the dissemination of information to
occupational workers regarding their dose
received that might result in further reduction in
exposure.
CONCLUSION
In conclusion, the results from this study
revealed that the personnel occupationally
exposed to ionizing radiation have values of
annual
effective
doses
within
the
recommended limits. An action level is set as
20% of permissible limit to ful+ill the PNRA
obligation.
ACKNOWLEDGMENT
The authors gratefully acknowledge the
Pakistan Atomic Energy Commission and
Higher Education Commission Pakistan role
for supporting this study.
Con lict of interest: Declared None.
REFERENCES
1. Interna onal Atomic Energy Agency (1996) Safety Standards. Interna onal basic safety standards for protec on against ionizing radia on and for Safety of Radia on sources. IAEA, Vienna.
2. Interna onal Atomic Energy Agency (2006). Safety Standard for Protec ng Peopele and Environment. Fundamental Safety principles No. SF-1, IAEA, Vienna. 3. Okaro AO, Ohagwu CC, Njoku J (2012). Evalu on of
Personnel Radia on Monitoring in Radiodiagnos c Centers in South Eastern Nigeria. African Journal of Basic & Applied Sciences, 2(1-2):49-53.
4. Grover SB, Kammar J, Gupta A et al. (2002) Protec on against radia on hazards : Regulatory bodies, safety norms, does limits and protec on devices. Indian J Radiol Imaging 12: 157-67.
5. Interna onal Commission on Radiological Protec on (1990) Recommenda ons of the ICRP. ICRP Publica on 60. Pergamon Press, Canada.
6. Interna onal Atomic Energy Agency/ Interna onal Labour Organiza on (1999) RS-G-1.1. Occupa onal Radia on Protec on Series. Vienna.
7. Pakistan Nuclear Regulatory Authority (2004). Regula ons on Radia on Protec on (PAK/904).
8. Interna onal Commission on Radia on Protec on (1998) Individual Monitoring for Internal Exposure of Workers: Replacement of ICRP Publica on 54. ICRP Publica on 78. Ann ICRP, 27:3-4.
9. Colgan PA, Currivan L, Fenton D (2008) An assessment of annual whole-body occupa onal radia on exposure in Ireland (1996-2005). Radiat Prot Dosimetry, 128 (1):12-20.
10. Meghzifene A, Vano E, Heron JL et al. (2010). Roles and responsibili es of medical physicists in radia on protec on. European Journal of Radiology 76: 24-27.
11. Clements J (2015) MO-E-213-03: Newer Radia on Protec on Requirements in Last Decade. Med Phys, 42 (6):3561-3561.
12. Seibert J (2015) MO-E-213-02: Medical Physicist Involvement in Implemen ng Pa ent Protec on Standards. Med Phys, 42 (6):3561-3561.
13. Cember H (2004) Introduc on to health physics, 3rd edn. Health Physics Instrumenta on, McGraw-238 Hill Inc. 365–369, USA.
14. Jabeen A, Munir A, Masood M et al. (2010) Occupa onal exposure from external radia on used in
medical prac ces in Pakistan by film badge dosimetry.
Radiat Prot Dosimetry, 140(4): 396-401.
15. Interna onal Atomic Energy Agency (2000). Safetyeries calibra on of radia on protect ion instruments. Safety Report Series No. 16.
16. Interna onal Atomic Energy Agency (1994) Interna onal basic safety standard for protec on against ionizing radia on and for the safety of radia on sources. IAEA Safety Series No. 115–1.
17. Memon SA, Laghari NA, Cheema AA (2012) Evalua on of Radia on Workers’ Occupa onal Doses Workingat NIMRA Jamshoro. JLUMHS, 11(03): 190-94.
18. Korir GK, Wambani JS, Korir IK (2011) Es ma on of annual occupa onal effec ve doses from external ionising radia on at medical ins tu ons in Kenya. SA
Journal of Radiology, 15(4): 116-119.
19. Piwowarska-Bilska H, Birkenfeld B, Listewnik M et al.
(2010) Long-term monitoring of radia on exposure of employees in the department of nuclear medicine (SZCZECIN, POLAND) in the Years 1991–2007.
Radia2on Protec2on Dosimetry, 140(3): 304-7.
20. Hasford F, Owusu-Banahene J, Amoako JK et al. (2012) Assessment of annual whole-body occupa onal radia on exposure in medical prac ce in Ghana (2000-2009). Radia2on Protec2on Dosimetry, 149(4): 431-437.
21. Masood K, Ahmad M, Zafar J et al. (2012) Assessment of occupa onal exposure among pakistani medical staff during 2007–2011. Australas Phys Eng Sci Med, 35(3):297-300.
22. Memon SA, Qureshi ST, Laghari NA et al. (2013) Radia on workers’ occupa onal doses: are we really careful or overconscious. world academy of science, engineering and technology. Interna2onal Journal of Physical Science and Engineering, 7(8): 1039-41.
23. United na on scien fic commiKee on the effects of atomic radia on (UNSCEAR) (2000) Occupa onal radia on doses. UNSCEAR Report: 20.
24. Valuckas KP, Atkočius V, Samerdokienė V (2007) Occupa onal exposure of medical radia on workers in Lithuania, 1991–2003. ACTA MEDICA LITUANICA, 14 (3): 155-159.
25. Kamenopoulou V, Drikos G, Dimitriou P (2000) Occupa onal exposure to ionising radia on in Greece (1994–1998). Radiat Prot Dosim, 91(4): 385-389.
26. Weizhang W, Wenyil Z, Ronglin C et al. (2005) Occupa onal exposures of Chinese medical radia on workers in 1986-2000. Radiat Prot Dosimetry, 117(4): 440-3.
27. Mosley S and Currie G (2006) Personal dosimeter use in Australian nuclear medicine prac ce. The Internet
Journal of Nuclear Medicine, 4(1): 201-206.
28.Sutlief, SG (2015) Protec on and measurement in radia on therapy. Health Physics 108 (2): 224-241.