Participation in Creating Healthy Cities
By
Maryka Denise Lier
A paper submitted to the faculty of
The University of North Carolina at Chapel Hill
in partial fulfillment of the requirements for the degree
Master of City and Regional Planning
April 10, 2014
This paper represents work done by a UNC-Chapel Hill Master of City and Regional
Planning student. It is not a formal report of the Department of City and Regional
Planning, nor is it the work of the department’s faculty.
Approved by:
About the Author
Maryka Lier is a dual master’s degree student in the Department of City
and Regional Planning and the Gillings School of Global Public Health at
the University of North Carolina at Chapel Hill. She is a Master of Public
Health candidate in the Department of Health Behavior and a Master of
City and Regional Planning, specializing in Economic Development. Prior
to beginning her graduate studies, Ms. Lier worked at the Greater
Lawrence Family Health Center and the Latino Center of Excellence in
Eliminating Disparities. She was an active member of the Mayor’s Health
Task Force and the Youth Network. Ms. Lier was born and raised in
Massachusetts, and though she has worked with diverse communities in
Oakland, CA, Asheville, NC and Mount Vernon, WA—Lawrence, MA will
always feel like home.
Acknowledgements
I would like to thank my colleagues in Lawrence, MA: Vilma Lora and
Elecia Miller for allowing me to explore the inspiring work with the
Lawrence Youth Council and the Mayor’s Health Task Force. I am
humbled by their commitment to social justice and health equity for the
residents of Lawrence. I would also like to thank all of the friends, formers
colleagues and Lawrence youth that sat and spoke with me as I prepared
this project and tried to reacquaint myself with the city after two years in
North Carolina.
I would like to thank my advisor, Dr. Meenu Tewari for her support and
encouragement throughout the research and writing process. Thank you
for helping me wrestle with this project. And thank you also to Dr. Nicola
Lowe and Dr. T. William Lester for your lessons, advice and support
throughout this master’s program.
What defines a hometown? Could it be the place where you were
born, or could it be the place you grew up and gained your life
experiences? I used to believe the negative images portrayed in the
news about my hometown Lawrence, MA. These images shaped the
way I viewed my city. I used to feel ashamed about living in Lawrence,
and I believed that the city’s problems were not mine to fix. I was
young and naïve. It wasn’t until I was accepted to the Mayors’ Health
Task Force Lawrence Youth Council that my beliefs of Lawrence
changed.
When I first applied, I thought the program would be just another
thing to do afterschool. I was set on going to college and moving out
of the city as fast as possible. When I joined the Youth Council, my
beliefs changed considerably. During my time serving on the Council, I
have learned about the incredible history of my city, from the Bread
and Roses strike to the resilient families that risked it all for a better
life in this country. I felt proud to be a part of such a growing and
vibrant city. These experiences allowed me to step outside of my
comfort zone and unlearn many of the stereotypes about Lawrence. I
felt empowered to be a part of the change that is taking place in
Lawrence, and I only hope to continue to give back to my community
as I pursue an engineering degree. I look forward to pursuing my
passions in the engineering field, but I will never forget the city that
raised me.
Introduction ... 3
Project Background ... 4
Purpose of the Report ... 5
Methodology ... 6
Chapter 1: Why Youth Matter ... 7
Barriers to Youth Involvement ... 9
Chapter 2: Examining the Social Determinants of Youth Health ... 13
Addressing the Social Determinants of Health ... 15
Local Economic Development ... 16
Chapter 3: Lawrence Demographics & Socioeconomic Analysis ... 18
Age Structure ... 19
Race, Ethnicity & Nativity ... 20
Educational Attainment ... 22
Employment ... 25
Income ... 26
Poverty ... 28
Geographic Distribution of Demographic & Socioeconomic Factors ... 28
Chapter 4: Participation Approach & Framework for Action ... 31
A Social Ecological Framework for Lawrence Youth Council ... 33
Individual Level ... 33
Interpersonal Level ... 34
Organizational Level ... 36
Community Level ... 36
Policy and Social Norms ... 37
Action-Oriented Inquiry Model ... 38
Chapter 5: ... 40
Evaluating the Lawrence Youth Council ... 40
Youth Recruitment ... 40
Application & Interview Process ... 42
Make-up of the Council ... 43
Council By-Laws ... 44
Parental & Family Involvement ... 45
Adult Leadership ... 46
Project Identification ... 47
Chapter 6: Recommendations ... 49
Recommendations for Improving the Implementation of the LYC ... 49
Conclusion ... 51
Additional Resources for Project Planning ... 52
References ... 53
Introduction
Young people are essential to the social, physical and economic well-being of their
communities. Not simply because—as the saying goes—they are the future, but also
because they are current assets to the communities in which they live. In Lawrence, MA,
youth are already finding ways to get involved in community projects: tending urban
gardens; organizing fashion shows to raise money for local nonprofits; creating alternative
media sources to promote community pride; running poetry, dance and music events and
organizing skateboard competitions. The City of Lawrence developed the Lawrence Youth
Council (LYC) to engage that enthusiasm and to create a space in the local government
where youth can help shape the projects, policies and initiatives that impact them. The
LYC recognizes the power youth have as active citizens in a city fighting the effects of
poverty and striving towards equitable revitalization.
Lawrence faces significant challenges to the health of the city. These health challenges are
not simply caused by individual behaviors or genetic predispositions. Health is a result of
the social and economic conditions in which people live. Governmental agencies, social
support organizations, education institutions, and healthcare organizations are all working
to improve daily life and opportunity for Lawrence’s young residents. The community and
economic revitalization of Lawrence are critical to the health of its residents, especially the
youth, who need safe places to work, live and play. If we are to succeed in developing
healthy, sustainable economic and social infrastructures, it is necessary that youth
leadership and participation be included in the efforts to identify and address those issues.
also develops in youth a sense of civic responsibility and connection that feeds back into
the community. When adult leaders create processes to share power and decision-making,
it gives youth opportunities for individual and group leadership that allows them to see
themselves and to be seen by others as active citizens. Youth can identify local issues,
develop plans, and organize activities and meetings to address those issues. They can
develop self-confidence and a commitment to civic engagement.
!1Youth can also inspire
and teach the adults involved, through sharing their unique skills and point of view on local
issues, improving adults’ ability to partner with youth. Lastly, the general community also
benefits by effectively addressing youth issues and increasing the capacity to address
planning and public health issues that impact everyone. This is the aim of the Lawrence
Youth Council.
Project Background
A group of civic leaders, along with the mayor, started the City of Lawrence Mayor’s Health
Task Force (MHTF) in 2002. The purpose was to build the capacity of a wide range of
organizations and businesses to work together to address public health issues in the city.
There are a number of working groups that deal with different health issues. The MHTF is
housed in the Community Development Department (CDD) in the city’s Office of
Planning and Development. Community-based participatory research and interventions
have been a part of the core values of all of the MHTF’s work
!2. The Youth Network is a
working group of the MHTF dedicated to the spiritual, emotional, mental and physical
health of Lawrence Youth. It accomplishes its objectives through raising awareness,
engaging in advocacy, encouraging action, and strengthening collaboration. The Lawrence
Youth Council (LYC) was started through the Youth Network to engage youth
participation in the decision-making of the MHTF, the Youth Network and the Lawrence
Coalition on Teen Pregnancy. The LYC also gives youth the chance to lead projects and
initiatives that are valuable to them
impact youth, their families and community through a process of civic engagement,
community organizing, education, and advocacy. The intended benefits of the LYC are:
•
Leadership development
•
Team building and group management
•
Issue identification and community assessment
•
Project development, implementation and management
•
Participating in shared decision-making processes with youth and adult leaders
Youth—ages 15 to 21—work closely with professionals from a wide variety of backgrounds;
learn how to organize and mobilize groups; and acquire workplace skills that can be useful
for personal, education and professional development.
Planning for the LYC began in Spring 2014, and the first cohort of Youth Council members
was sworn in October 2014. The members of the LYC and the Youth Network are working
together to create the structure and format of the Council. The Council is also working on
organizing a youth health summit and an alcohol-use prevention video. This first year is a
pilot of the program, and the documentation and evaluation of the implementation thus
far is an important step towards program development and sustainability. By creating a
program plan, the LYC and MHTF can address ways to broaden the reach and impact of
the LYC. They can also strengthen the ties between the public health activities of the
MHTF and the planning and development activities of the CDD at large.
Purpose of the Report
community engagement and the barriers to their involvement. Second, I discuss the social
determinants that impact their health and how community and economic development
can help address them. Next, I analyze demographic and social-economic data of the
Lawrence population to provide a context in which the LYC works and information for use
by the LYC. I then articulate an approach to youth participation, a framework to guide the
work of the LYC, and an Action-Oriented Inquiry model for identifying issues and projects
for the LYC to take on. Finally, I will document and assess the current process of the LYC
and provide recommendations for increasing program effectiveness and development.
Methodology
Chapter 1:
Why Youth Matter
In Lawrence, youth aged 15-24
*years make up over 17 percent of the population and 23
percent are under the age of 14. Young people make up 40 percent of the Lawrence
population and contribute to the social and economic fabric of the city through schools,
events, work and spending money at businesses. The United Nations Convention on the
Rights of the Child (UNCRC) details the civil, political, economic, social, health and
cultural rights of children (under the age of 18) and has been ratified by 194 countries.
!3These rights do not negate the authority of parents and caregivers to provide protection,
instruction and guidance. The UNCRC lays out the rights of young people as citizens and,
therefore, deserving of the right to participate in decision-making processes that are
relevant to them. Youth have inherent worth as current assets to Lawrence. They are not
simply valuable for what they can become, but also for the people they are now, with a
unique point of view and set of skills. Gillespie calls these dual aspects of youth “being and
becoming” and argues that city planners need to address how young people are involved in
the decisions made by planners to support those dual aspects.
! 4Youth are in no way a
monolithic group and within each community groups of youth face different challenges
and require unique approaches.
* The term youth commonly refers to people age 15-24 years, bridging the categories of adolescence and early adulthood. The overlap with the demographic categories of adolescence (some definitions can start as early as 10 years old until 19 years) and childhood (under 18 years old) make data and statistics about the youth difficult to pinpoint. Of course, the legal definition for adulthood is 18 years. However, the term youth is defined within a social, cultural and economic context; it is an ambiguous space between childhood and adulthood that is marked by a lack of full independence. In the United States, there is an ever-widening gap between the onset of puberty and the social-role transition to adulthood. This is becoming more pronounced as a result of the economic recession, impacting youth’s ability to gain employment experience during high school and economic independence after high school.
“[The UNCRC] affirms that children are full-fledged persons who have the right to express
their views in all matters affecting them and requires that those views be heard and given
due weight. It recognizes the potential of children to share perspectives and to participate as
citizens and actors of change”
Barry Checkoway, scholar of youth studies at the University of Michigan 3
Many people argue that youth today are apathetic about the political process and a
disengaged in community life.
! 5The Millennial generation is often characterized as
narcissistic and disengaged, interested more in entertainment than civic engagement.
However, recent large-scale social movements tell a different story. Youth are engaged in
civic action as evidenced by their involvement in the Occupy Movement, United We
Dream, and BlackLivesMatter.
*Scholars of youth social capital argue that assessment of
youth disengagement is usually measured by adult-defined community activities, and
ignores youth-defined community activities.
! 6A Lawrence example would be the youth
longboarders. Lawrence longboarders organize group events, apply for funding for
tournaments and secure corporate sponsorship of their longboarding activities. Youth are
resourceful, creative and willing to participate. Youth may be disengaged from the political
process because they are systemic barriers (i.e. voting age) and their interests and opinions
have traditionally not been solicited or respected. The 2008 Obama Campaign is a
testament to what can happen when youth concerns are valued and they are given a space
to engage. The key for planners and public health practitioners is to provide genuine
opportunities for youth participation and broaden the definition of civic engagement to
include youth-defined community concerns.
Adolescence and young adulthood does represent an important stage of human
development. Youth are in transition to autonomy and are establishing life-long health
*
behaviors, patterns and attitudes.
! 7)9As such, there is a common acceptance of the
importance of human capital development among youth—molding knowledge, behaviors
and skills to maximize their future economic potential and minimize burden (i.e. illness,
anti-social/criminal behavior, etc). Youth are often targets of educational interventions
and workforce development, but rarely are they provided the space to debate, understand
and shape the processes of their engagement. Many city governments, institutions, and
organizations view youth through a paternalistic lens—as passive recipients of services or,
worse, as problems that need to be addressed. They are rarely included as active
participants that shape community development processes. Freire
!10refers to this focus on
information transfer and passive learning to as the “banking concept of education” in
which youth are viewed as “receptacles to be filled” rather than partners in the process of
understanding their world. Genuine youth participation in public health and community
and economic development advances Sen’s notion of human capital in combination with
the human capabilities approach.
!11It prepares youth to be healthy, productive members of
society and the workforce, and it expands their freedom to create communities they value
and want to be members of.
!11“Education either functions as an instrument which is used to facilitate integration of the younger generation into the logic of the present system and bring about conformity or it
becomes the practice of freedom, the means by which men and women deal critically and creatively with reality and discover how to participate in the transformation of their world.”
Paulo Freire, Pedagogy of the Oppressed 10
Barriers to Youth Involvement
emphasizes their deficits and disempowers them as change agents. Victimizing
pathologizes the youth who experience negative social conditions.
!14This view of youth as
victims or problems is particularly damaging for individuals living in economically
disinvested neighborhoods and cities, like Lawrence. Lawrence youth face intersecting
forms of marginalization that limit their socioeconomic mobility (i.e. racism, sexism,
classism etc.).
!13)16As a result of this lack of autonomy and power, youth can experience
social exclusion—systematic disadvantage and discrimination—that can result in
negative health and social outcomes.
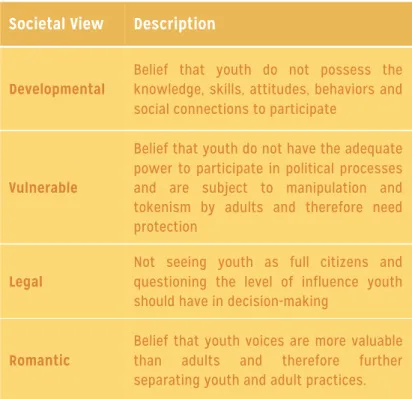
Table 1: Frameworks for viewing youth that influence adult buy-in
Societal View Description
Developmental
Belief that youth do not possess the knowledge, skills, attitudes, behaviors and social connections to participate
Vulnerable
Belief that youth do not have the adequate power to participate in political processes and are subject to manipulation and tokenism by adults and therefore need protection
Legal
Not seeing youth as full citizens and questioning the level of influence youth should have in decision-making
Romantic
Belief that youth voices are more valuable than adults and therefore further separating youth and adult practices.
Source: Frank 2006
LGBTQ
*youth of color
! 22disproportionately, and can lead to early criminalization and
serious mental health issues. This is an example of the ways adultism—a form of age
discrimination—intersects with other forms of discrimination.
It is important that we name this form of discrimination experienced by youth so we can
identify the intersectionality that informs Lawrence youths’ experiences of discrimination
that keep them from achieving their full potential as active community members. For
example, when groups of youth get together to play in the neighborhood, they are treated
with suspicion, and if a problem arises, neighborhood residents are afraid to approach
them, leading to police involvement. Or when non-Lawrence residents say they lock their
car doors when driving through Lawrence—which the youth see as a comment on their
inherent criminality. Camino and Zeldin
! 15argue that segregation of youth from adults
perpetuates negative beliefs about youth, role stratification and low expectations. Youth
should be viewed as competent citizens who have the ability and enthusiasm to contribute
to addressing concerns in their community.
!14,23The Department for International Development’s Civil Society Organizations
(DFID-CSO) Youth Working Group in the United Kingdom identified three structural barriers to
organizations and agencies incorporating youth participation that are echoed throughout
the United States-based literature.
! 13They are 1) skepticism and ambivalence about the
meaning, value and methodologies of youth participation; 2) lack of understanding of and
experience working with youth; and 3) inadequate financial resources devoted to the task.
! 13Camino and Zeldin
! 15add that adult-oriented institutions and powerful competing
interests also act as barriers to dedicating adequate resources and time to engaging youth.
The MHTF and the Lawrence Youth Council seeks to address all of those structural barriers
* Lesbian, Gay, Bisexual, Transgender, Queer and Questioning youth are considered sexual and gender minorities
and demonstrate the value of youth participation, how to successfully partner with youth,
and has dedicated funding for the LYC. They are also committed to addressing the
discrimination experienced by youth in Lawrence and working to change those social
views.
Chapter 2:
Examining the Social Determinants of Youth Health
Health is a result of a mixture of genetics, individual behaviors and social and
environmental factors. The health of youth populations in the United States is dependent
on the promotion of health behaviors to help youth improve their current status and also
establish behaviors for a healthy future. Modifiable behavioral risk factors are the leading
causes of death in the United States.
!24,25Seventy-percent of deaths among youth were due
to preventable injury and violence.
! 26The MHTF Youth Network focuses on health
behaviors that contribute to the leading causes of illness and death among youth and
adults:
•
Sexual behaviors that lead to unintended pregnancies and sexually transmitted
infections (STIs)
•
Behaviors that lead to violence and unintentional injury
•
Tobacco, alcohol, and other drug use
•
Unhealthy dietary behaviors
•
Physical inactivity
Additionally, Youth Network is concerned with environmental health issues (e.g. lead
paint in old homes, pests, air pollution), mental health, and youth living with disabilities.
By supporting health behavior interventions to address these issues, the City can help
lessen the disease burden among young residents and prepare them for healthier
adulthood.
determinants of health (SDH) as, “the circumstances in which people are born, grow up,
live, work and age, and the systems to deal with illness. These circumstances are in turn
shaped by a wider set of forces: economics, social policies, and politics.” The link between
social factors and health has been well established through a large body of evidence.
! 27These factors include neighborhood and work conditions, economic resources, and
educational opportunities and attainment, as well as the social norms and discrimination
discussed in the last chapter. These social factors influence everyone’s health but create
significantly worse outcomes for people living in poverty and people of color.
*There are many pathways through which social determinant impact health. The following
are a few examples. Neighborhood access to healthy, affordable, culturally appropriate food
impacts dietary choices, and the saturation of tobacco retail advertising has been found to
increase tobacco use among youth. Second, the ability of youth to get enough physical
activity each day is influenced by the existence of safe places to play, walk or bike. Third,
the existence of living-wage jobs in an area directly impacts a families ability to afford
healthcare or daily necessities; the quality of the job can directly impact health (e.g.
third-shift work, long hours at multiple jobs, or physically demanding labor). Lastly, the quality
of education directly impacts health through basic knowledge of health promotion and risk
avoidance (e.g. sexual education in school) and educational attainment leads to access to
better job opportunities. By addressing neighborhood conditions, education and economic
resources in a community and addressing negative social norms and discrimination,
communities are improving public health.
The WHO considers SDH to be the main cause of health disparities between populations.
Experiences of racism and discrimination—both everyday experiences and major events—
have been found to increase depression and impact general health outcomes in Black
* It is important to state that, while race and ethnicity are often used as variables in accessing
adults
! 28,29; Asian adults (differing in severity by group origin)
! 30; and Latino adults
regardless of income.
! 31The trend is similar with Afro-Latino adolescents, a group that
makes up a large percent of the Lawrence population.
! 32Experiences of discrimination
among gender and sexual minority youth also have serious health and social outcomes, like
homelessness and violence.
!33,34It is thought that stress plays a major role in the impact of
discrimination on health. By opening up opportunities for participation with youth who
experience marginalization and building collective efficacy and social support, the youth
have the opportunity to address these inequalities head on. Jennings et al.
! 35articulated
Freire’s empowerment educational philosophy stating, “if people are not critically aware of
the visible and invisible structures and processes that make up social institutions and
practices, nor of their own role and actions within these institutions and practices, there is
little room for empowerment.”
Addressing the Social Determinants of Health
Local Economic Development
There are many examples in the literature of how adults can involve youth in different
aspects of planning the physical environment (see the Resources page for specific projects).
However, the literature on youth involvement in local economic development in the United
States is lacking. In many ways the problem of local economic development often gets
reduced to recruitment: looking for ways to attract national, multinational and foreign
businesses to the area. State and local governments are spending millions of taxpayers’
dollars (and conceding tax revenue) on industrial recruitment incentives or in developing
the next innovation cluster. At the same time, they establish training programs to ensure
that their local workforce has the skills necessary to fill the demands of the jobs that
recruitment brings.
!36,37Given all of the powerful political and economic interests involved
in these efforts, where do youth, who will be the future workforce, fit into conventional
economic development planning?
Understanding how youth view and interact with their community has important
implications for how the local economic development process can evolve. Incorporating
youth’s skills, experience and knowledge in development initiatives that impact youth
increases the success of those interventions because youth are better able to “own” the
outcome and understand its value. The City of Lawrence’s
2010-2015 Consolidated Plan
MHTF YOUTH NETWORK
COMMUNITY DEVELOPMENT
Healthy Eating & Active Living Environmental Health
Living with Disabilities Sexual Health
Injury & Violence Substance Use & Abuse Mental Health
Housing
Economic Development Land Use Planning Transportation
Social Determinants of Health: Finding Common Ground
lists expanding job opportunities, job training, commercial corridor improvement, and
small business assistance and lending as the major areas of economic development
concern in the city. They are also more motivated to attend and get more out of it.
!38The
LYC can be an asset in addressing those issues (see examples below). Through
participation in local economic development, young people will gain skills in examining
local economic conditions and discover their place in the economic health of their
community and possibly the larger region. Including this type approach in a portfolio of
workforce development efforts pushes the intervention beyond classroom education and
individual training, preparing youth for the workforce and a productive, healthy adulthood.
The next chapter analyzes those economic and social conditions that impact the health of
Lawrence youth and detail the demographics of Lawrence to help provide program context
and inform action.
Youth Participation in Local Economic Development
Education and workforce training are important for meeting the demands of
changing industries and developing the human capital and innovation for local
business development. Youth can be involved in the process of creating these
workforce programs and improving the local economy.
Investigate local job opportunities for youth; Interview local business owners about job opportunities for youth and skills required; develop line of communica-tion between businesses and youth to help meet mutual needs of both young people and employers
Explore industries and occupations in the area and develop an educational tool for youth to explore career options and understand qualifications needed as well as possible salary ranges
Promote entrepreneurship training, small business development and financial literacy for youth
Evaluate retail environment in key business corridors for dimensions of youth significance (e.g. safety, welcoming to young people, space for social interaction, employment opportunities, health promotion)
Chapter 3:
Lawrence Demographics & Socioeconomic Analysis
Massachusetts is thriving state with a strong economy. The Boston Metropolitan Area is
home to some of the best institutions of higher learning in the country, which feed into the
well-established healthcare, technology, and financial industries. However, Lawrence is an
example of the drastic disparities that some communities face in this wealthy state. With a
population of about 77,000 in just seven square miles, Lawrence is small and has a dense
concentration of poverty in an affluent county in a well-off state. LYC interventions and
initiatives should target the specific needs, enhance the various strengths of the city, and
include connections to the regional resources surrounding it.
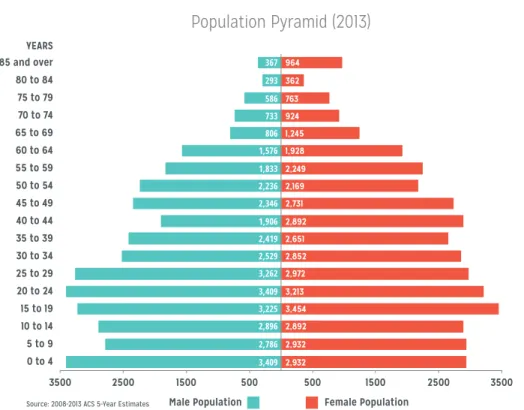
Age Structure
Lawrence has a young population with over 40 percent of the population under the age of
25 years and over 17 percent falling in a target population (15-24 years). The population
pyramid illustrates the age structure in 5-year increments and highlights the larger youth
base. The pyramid also shows there are more males under 25 years, and there are more
females over 45 years, specifically over 85 years. The table below shows detailed
percentages. The sex ratio is 91 males per 100 females, and the median age is 31 years, six
years below the state’s median. Immigration may be a factor in the age difference since
individuals tend to immigrant at a younger age. Additionally, the Massachusetts Alliance
on Teen Pregnancy reports a teen birth rate of 56.8 per 1,000 for Lawrence, making it the
second highest in the state.
! 40As such a large percent of
the population, it is
imperative that adults
create avenues for youth
participation in civic life
3500 2500 1500 500 500 1500 2500 3500
0 to 4 5 to 9 10 to 14 15 to 19 20 to 24 25 to 29 30 to 34 35 to 39 40 to 44 45 to 49 50 to 54 55 to 59 60 to 64 65 to 69 70 to 74 75 to 79 80 to 84 85 and over YEARS
Female Population Male Population
Population Pyramid (2013)
3,409 2,786 2,896 3,225 3,409 3,262 2,529 2,419 1,906 2,346 2,236 1,833 1,576 806 733 586 367 2,932 2,932 2,892 3,454 3,213 2,972 2,852 2,651 2,892 2,731 2,169 2,249 1,928 1,245 924 763 362 964 293
Source: 2008-2013 ACS 5-Year Estimates
Table 2: Lawrence population distribution by age and sex. Source: US Census, 2009-2013 5-Year ACS
Total Male Female
0 to 14 years 23.2 percent 24.8 percent 21.8 percent
15 to 24 years 17.3 percent 18.1 percent 16.6 percent
25 to 44 years 28.0 percent 27.6 percent 28.3 percent
45 to 64 years 22.2 percent 21.8 percent 22.6 percent
Race, Ethnicity & Nativity
Lawrence has always been home to a large number of newly arriving immigrants drawn to
work in the textile manufacturing industry. As the manufacturing companies left the city
by the middle of the 20th Century, the population of Lawrence began to decline. The
Nativity Population Trend graph shows the native-born population has been in decline
since 1960 as the earlier Lawrence residents (primarily of European descent) moved out of
the city. However, from 1980 onward, the total population has grown as a result of a large
increase in foreign-born immigrants coming to the city. As of 2013, 38 percent of the city’s
population was foreign-born (20 percent are not citizens; 2009-2013 ACS).
Also in the middle of the 20th Century, the major immigrant groups coming to Lawrence
began to change with the arrival of first Puerto Rican and then Cuban and Dominican
populations. In 30 years, the Latino population grew from less than 20 percent in 1980 to
over 74 percent in 2010 (considered possibly larger due to under-reporting of
undocumented residents). The Latino population is significantly more concentrated in
Lawrence than in the surrounding Essex County (17 percent) and Massachusetts as a whole
(10 percent). Seventy-six percent of the population speaks a language other than English at
Nativity Population Trends
1980 1990 2000 2010
1960 1970 0
10,000 20,000 30,000 40,000 50,000 60,000 70,000 80,000
Native Born Foreign Born
home; 38 percent speak English less than “very well” (2009-2013 ACS). The majority of the
Latino population in Lawrence is Dominican (54 percent) and Puerto Rican (30 percent)
in origin. While the Asian population in Lawrence is small (3 percent), there is a high
concentration of Vietnamese (34 percent) and Cambodian (33 percent) residents
(2009-2013 ACS). The rich historical and cultural heritage of this immigrant city makes Lawrence
a unique place in the region. Lawrence is culturally and linguistically very different from
the surrounding region, which provides a unique asset for the city to celebrate. It is also an
important feature to consider when designing programs and interventions in the city.
Language has been cited as a major barrier to employment and educational success.
However, ethnic identification and cultural engagement among youth act as protective
factors for negative health and social outcomes.
!41Racial identification in the Census is not often a reliable measure. The Latino population is not monolithic, and the culture, immigrant experience, and experience of racial discrimination of
Latino White (alone) Black (alone)
Racial & Ethnic Demographic Trends
Asian / Some Other Race
1980 1990 2000 2010
10,296
29,339
43,019
56,363
51,371
38,397
24,569
15,637
Caribbean Latinos differs from South and Central Americans. Latin Americans conceptualize racial categorization differently from the US. While most research on Latinos has been with Mexican populations, there are a few studies that show the experience of discrimination of Puerto Ricans, Cubans and Dominicans intersects with the way other people perceive their racial category.! 32,42 There are many Afro-Latinos living in Lawrence, but they may not identify as both Latino and Black on the Census. Therefore, in this report, I have chosen to use “Latino” as a multi-racial ethnic grouping and compare that population to groups that identify as only White or only Black. The “Asian/Some Other Race” category in the graph includes American Indian and Alaska Native alone; Asian alone; Native Hawaiian and Other Pacific Islander alone; and "Some Other Race" alone since those categories were not separate in the 1980 and 1990 Census. The 2009-2013 5-Year American Community Survey allows for more specificity regarding national origins, but this should be considered a crude measure.
Educational Attainment
Educational attainment helps to understand the socioeconomic status of the population in
Lawrence and the capacity of the workforce. These conditions do have impacts on access to
bridging social capital for youth living in Lawrence and their ability to find work through
networks or find social support to attend college. Among adults (defined by the ACS the
0% 5% 10% 15% 20% 25% 30% 35%
Graduate or Professional Degree Bachelor’s Degree Associate’s Degree Some College (no degree) High School Graduate (or equivalency) 9th to 12th grade (no diploma) Less than 9th Grade
Adult Educational Attainment
for population 25 years & over4.0% 3.6% 4.4% 7.1% 6.8% 7.4% 5.4% 6.1% 4.5% 18.7% 19.5% 17.9% 31.4% 29.5% 33.6% 12.9% 13.3% 12.5% 20.5% 21.2% 19.7% Female Total Male
population 25 years and over), only 11 percent have bachelor’s degree or higher
*(2009-2013
ACS). Sixty-five percent have a high school degree or less; one-third of the adult population
has less than a high school degree. Differences in educational attainment by sex among
adults are slight. More women (35 percent) have less than a high school degree than men
(32 percent). More men have a high school degree (34 percent) or a Bachelor’s, Graduate or
Professional degree (12 percent) than women (30 percent and 10 percent respectively). More
women (26 percent) have an Associate’s degree or some college than men (22 percent).
Given gender differences in earnings discussed in the section below, gender is an important
variable to keep in mind.
About 60 percent of college-aged youth (population 18-24 years) have only a high school
diploma or less (2009-2013 ACS). The gender differences are starker than the adults. More
young women (49 percent) have pursued post-secondary education than young men (33
percent). Over a third of young men have less than a high school degree. It is important to
target young men in LYC initiatives because of this reason; they are also more likely to
report negative effects of discrimination.
!43*#It#is#unclear#whether#this#measure#captures#foreign#degrees#since#many#immigrants#with#higher8 level#degrees#from#their#country#of#origin#are#able#to#use#them.#Therefore,#they#may#not#record# include#them#in#their#Census#response.#
0% 5% 10% 15% 20% 25% 30% 35% 40%
Bachelor’s Degree or Higher Some College or Associate’s Degree High School Graduate (or equivalency) Less than High School
Youth Educational Attainment
for population 18-24 years6.1% 8.3% 3.9% Female Total Male 34.6% 40.3% 28.9% 30.4% 29.6% 31.2% 28.9% 21.8% 36.0%
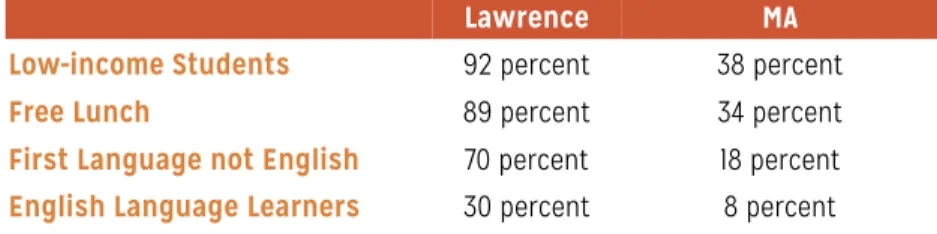
Table 3: High needs indicators for the Lawrence School District and statewide. Source: 2013-2014 Selected Populations Report, MA DESE
Lawrence MA
Low-income Students 92 percent 38 percent
Free Lunch 89 percent 34 percent
First Language not English 70 percent 18 percent English Language Learners 30 percent 8 percent
According to the MA Department of Elementary and Secondary Education (MA DESE),
over 95 percent of Lawrence public school students are in the “high needs” category
*compared to 49 percent statewide in the 2013-2014 school year. The table on the left shows
selected indicators. Enrollment in the district is 91 percent Latino compared to 18 percent
statewide. The cohort 4-year dropout rate has declined dramatically from almost 40
percent in 2006 to less than 13 percent in 2014. The Lawrence School District has been
under receivership by the state since 2012. There have been a number of efforts made to
bridge services between the schools and social service organizations. However, the public
school remains a difficult institution to partner with given the multiple high school
campuses and different principles. The outreach to their students is limited, even though
there is a great need.
* High needs students are either low income, English Language Learners (ELL), former ELL or have a disability
Employment
In Lawrence, 62 percent of the population 16 years and over is in the civilian labor force,
meaning they have a job, or they are looking for work (2009-2013 ACS). That is almost six
percentage points below Essex County and the state. By looking at data from the Bureau of
Labor Statistics Local Area Unemployment Statistics, we can see trends in unemployment
in Lawrence labor force compared to Essex County and the state. The unemployment rate
in Lawrence has been above both the state and county average since 1990. In 2000, the rate
had dropped statewide, and Lawrence was only about three percentage points greater than
both Essex County and Massachusetts. However, the gap has widened dramatically.
Lawrence was hit hard by the 2008 recession and has taken longer to recover, with the
average annual unemployment rate of 15 percent compared to 7.5 percent and 7.1 percent
for the county and state.
Nationally, employment among youth has been steadily dropping since 2000. According to
the 2009-2013 ACS, 38 percent of 16-19-year-olds are in the labor force, and the
unemployment rate for that age group is 36 percent. Labor force participation increases for
20-24-year-olds to 73 percent, and the unemployment rate decreases to 16 percent. That is
still higher than any other age category between 25-64 years. In addition to missed income,
0 2.0 4.0 6.0 8.0 10.0 12.0 14.0 16.0
1990 1991 1992 1993 1994 1995 1996 1997 1998 1999 2000 2001 2002 2003 2004 2005 2006 2007 2008 2009 2010 2011 2012 2013 Lawrence Essex County Massachusetts
Unemployment Rate
Annual Average, 1990-2013this impacts Lawrence youth because having high school work experience is a predictor of
future employment. A Recent Brookings report states, “teens and young adults not enrolled
in school who are also not working (especially those with no more than a high school
education) are likely to face more severe consequences... [They] are missing key education
and employment experiences and are at increased risk for a host of negative outcomes: long
spells of unemployment, poverty, criminal behavior, substance abuse, and incarceration”
!44Income
In order to examine economic recourses and opportunity, we need to look at income.
Median household income for Lawrence is $32,851 (in 2013 inflation-adjusted dollars),
meaning that half of the households in the city earn less than that amount (2009-2013
ACS). Comparatively, the median income in Essex County is $67,311. The MIT Living
Wage Calculator
! 45—which assesses geographically specific costs for food, childcare,
healthcare, housing, transportation, and other basic necessities—sets the living wage for
Lawrence at $51,230 for a household of one adult and one child ($24.63/hour full-time
individual sole provider)
*. A common measure of low-wage income is 200 percent of the
2015 Federal Poverty Level, which is $31,860 ($15.32/hour full-time individual sole provider)
for a two-person household. Median earnings for the population 25 years and over are
estimated at $26,453 (2009-2013 ACS).
There were only slight differences in educational attainment by sex in Lawrence, but there
are large disparities between median earning by educational attainment by sex. The graph
here also compares Lawrence to the surrounding Essex County. As one might assume, the
median earning increase with higher levels of educational attainment and there are
disparities in earnings between Lawrence and Essex County. Median earnings are
significantly higher in Essex County than in Lawrence, specifically for Essex County men.
Men in each geographic location make more than the women in the same location.
However, Essex County women have a higher median income than Lawrence men except
among bachelor’s, graduate or professional degree earners. In Lawrence, more young
women are pursuing post-secondary education, but inequality in pay at every level of
education. The table below provides the detailed earnings.
Graduate or Professional Degree
Bachelor’s Degree
Some College or Associate’s Degreee
High School Graduate (or equivalency)
Less than 9th Grade
Median Earnings by Educational Attainment by Sex for population 25 years & over in Essex County & Lawrence
Lawrence Female Lawrence Total Lawrence Male
Essex Female Essex Total Essex Male
$-Thousands (2013 USD) $10 $20 $30 $40 $50 $60 $70 $80 $90 $100
Low Wage
Table 4: Median Earnings by Educational Attainment by Sex for Lawrence and Essex County, MA. Source: US Census, 2009-2013 5-Year ACS
Total
Lawrence Essex Total Lawrence Female Female Essex Lawrence Male Essex Male Less than high school graduate $18,143 $22,136 $16,246 $18,095 $23,107 $27,237 High school graduate (or equivalency) $24,984 $32,600 $20,156 $25,821 $30,892 $39,998 Some college or associate's degree $30,698 $39,449 $27,442 $32,431 $35,176 $49,076 Bachelor's degree $41,655 $56,731 $36,952 $45,803 $44,440 $74,402 Graduate or professional degree $60,368 $73,342 $57,308 $62,416 $61,544 $95,135
Poverty
A common measure of high poverty concentration is over 20 percent and over 40 percent is
considered extreme. In Lawrence, 27 percent of the population is living below the Federal
Poverty Level; 39 percent of children (under 18 years) are living in poverty. Ten out of the 18
census tracts are considered extreme poverty, one as high as 52 percent below the FPL. The
ratio of income to poverty level provides as slightly more detailed gradation of economic
status. Seventy-four percent of Lawrence residents are under 200 percent of the poverty
level, which the Census determines
to be “doing poorly or struggling”.
The table details the ratio of income
to the poverty level.
Geographic Distribution of Demographic & Socioeconomic Factors
By mapping some of the previously discussed variables onto the census tracts in Lawrence,
we can begin to analyze spatial patterns and the concentration of burden in certain
neighborhoods. The map details the 18 census tracts and shows median household income
for each. The following charts are stacked bar charts for each census tract, showing the
percentage breakdown of race and ethnicity, nativity, educational attainment, income as
percent of poverty level, housing occupancy and tenure, and housing affordability. The
census tracts are numbered 2501 to 2518, and each stacked bar is labeled to correspond to
the last two digits the census tract.
Table 5: Income in the last 12 months divided by the federal poverty level. Source: US Census, 2009-2013 5-Year ACS
These can be used to explore the social-economic geography of the city. For specific
frequencies and percentages for each variable see Appendix A. In Appendix A, you can also
see maps with detailed measures for each census tract.
In the next chapter I articulate an approach to youth participation, a framework to guide
the work of the LYC, and an Action-Oriented Inquiry model for identifying issues and
projects for the LYC to take on. The LYC members can think of the issues raised in this
chapter as they read through the framework.
LAWRENCE CENSUS TRACTS Paying more
than 30% of your income for housing is considered cost burdened
For half of Lawrence households, rent is 34.5%of their income or more
Chapter 4:
Participation Approach & Framework for Action
This report has been discussing the various elements of genuine youth participation
through the LYC. It is important to clearly define what is meant by “genuine
participation”. Participation has become a buzzword used by many planners, public health
practitioners and social workers to different ends. The benefits of engaging youth in
genuine participation and shared decision-making are becoming more widely recognized.
! 38However, many programs, organizations, and agencies only engage in low forms of
power sharing because of the barriers discussed in Chapter One.
! 38,46Hart’s
Ladder of
Children’s Participatio
n
! 47is an adaptation of the landmark work of Arstein
! 46and has
been used by many youth development advocates describing the typology of participation.
However, the linear, hierarchical construct of the ladder simplifies the multidimensional
nature of youth participation. Driskell
! 48expanded on the model by articulating two
important dimensions of youth participation: 1) the level of interaction/collaboration with
adults and 2) the level of power to make decisions and affect change. Driskell illustrates a
threshold of power and collaboration above which are the forms of participation and under
which are the forms of non-participation originally included on Hart’s Ladder.
!48Shared
A Social Ecological Framework for Lawrence Youth Council
Public health research has been calling for the use of the social ecological framework (SEF)
to guide public health practice, because of the wide acceptance of the impact of the social
determinants of health (Golden and Earp 2012). Interventions that address multiple levels
of the SEF have the greatest impact because they address individual, interpersonal,
organizational, community and policy factors that contribute to health. I created the
following model to help guide the development of the LYC, as well as the development of
any projects through the LYC. I have adapted the five-level model outlined by Golden and
Earp (2012) to fit with the goals of the LYC and included elements of social network
development. I will briefly describe each level and provide an example of how local
economic and community development can be incorporated.
Individual Level
The LYC impacts individual members by increasing skills and knowledge of leadership
development, public-speaking, organizing and mobilizing others, project development,
policy advocacy, peer teaching, and data collection. The LYC also seeks to improve
Create, modify or improve enforcement of public policy Increase capacity for policy advocacy
Improve perceptions, attitudes & beliefs about
the City of Lawrence & its youth Improve the delivery of community services that impact youth
Educate broader youth & adult community Change physical environment of Lawrence Increase community capacity for positive growth & development
Improve perception & attitudes of adult leaders Change physical environment of organiztion Change organizational culture, policy & capacity to serve, partner with & support youth leadership
Build collective self-efficacy for organizational & community change Improve perceptions & attitudes of youth-youth & youth-adult networks Increase youth-youth & youth-adult social support
Increase skills & knowledge
attitudes and perceived norms around youth capability to make a difference in their
community by providing the space and resources for youth to succeed and setting high
expectations for the youth. Finally, the LYC intervenes on an individual level by increasing
members’ personal agency to make change through shared decision-making and building
self-efficacy to make a difference. Self-efficacy is the confidence that a person feels about
performing a particular behavior in a specific context (e.g. speaking in from of the city
council). Increasing self-efficacy leads to higher goals and expectations for oneself and
lower perceived barriers.
!49Bandura identifies four main ways to develop self-efficacy: 1) by
breaking a difficult action into attainable parts that promote performance mastery; 2)
modeling of the action, particular by peers; 3) providing safe physical and emotional spaces
where people can try new skills and behaviors; and 4) providing verbal encouragement.
!50These impacts will improve LYC members intentions to remain civically engaged and to
take action to improve the health if their community. These improvements may also be
true for other youth that participate in LYC workshops or projects.
*Individual Intervention Example.
The LYC can provide training on how to
incorporate the members’ new experience into building their resume, job
interviews, and scholarship or school applications. The LYC can also provide
training to other youth on policy advocacy to improve youth capacity to make
community-level change.
Interpersonal Level
At the interpersonal level, the LYC develops youth-youth and adult-youth social
connections and improves the collective efficacy of the group as a whole to make positive
change. The youth learn to work with other youth from different parts of the city and with
different backgrounds. This exchange holds particular benefits for youth who experience
* It is important for the LYC to be cautious of the over reliance on individual level interventions. They
marginalization because having youth work together to address disparities build resilience.
Wexler, DiFluvio and Burke argue that, “Emphasizing the collective nature of
discrimination can galvanize minority groups and can provide individuals with a purpose:
to affect the structures of inequality”.
!51Social support
*functions as a protective measure
against many negative health risks by strengthening social networks.
As mentioned earlier in the report, adults and youth working as partners in shared-decision
making processes builds trust and reciprocity. The LYC works to strengthen social networks
and increase bonding social capital between youth and adults as well as bridging social
capital. Bridging social capital expands an individual’s access to social and economic
resources.
! 52,53The adults provide access to resources and networks that increase the
group’s power to affect change; these networks would otherwise be difficult or impossible for
youth to access.
! 16The LYC needs to facilitate connections to youth constituents in the
community so that they can ensure representation of a variety of youth voices and resist
becoming too insular. The networks of social capital are illustrated in the model by the
white lines and circles. The white circles within the interpersonal level represent the
youth-youth relationships; the circles that straddle the line between interpersonal and
organizational represent the youth-adult relationships within the LYC and the connection
to the organizational level resources and power. The disconnected white circles are
community members that may be impacted by the LYC and are potential network ties.
Interpersonal Intervention Example.
Developing bonding and bridging social
capital can improve LYC member’s ability to access employment, scholarships or
other resources that improve chances for social mobility. By building social
networks, the LYC can develop collective efficacy to advocate for youth workforce
needs to business owners and policy members.
* There are four main types of social support: emotional, instrumental (tangible aid or services),
Organizational Level
The very existence of the LYC is an example of organizational level change. The MHTF
and the Youth Network, with strong support from the mayor, have created an avenue for
youth leadership within the local government. The LYC speaks to an organizational
culture that values youth as active, competent citizen. The information generated by LYC
projects also can influence structural change within the organizations that are a part of the
Youth Network and the MHTF. LYC members can advocate for organizational policy
change to improve capacity to support youth leadership, including changing the physical
environment (e.g. providing protected storage space for skateboards). Organization in this
context broadly means nonprofits, for-profit businesses, schools, churches, government
agencies, etc. Changes at this level communicate the importance of youth to youth,
organization staff members, and the public that interacts with that organization.
Organizational Intervention Example.
The LYC can advocate for a summer work
program at a local business to provide hands-on learning in a particular
occupation. A project like this could involve the creation of positions and training
of staff to supervise and mentor youth workers.
Community Level
Community Intervention Example.
Improving public transportation or active
transit routes to job opportunity hubs in Lawrence and the region so that youth
(and adults) can more easily access employment.
Policy and Social Norms
Policy change and advocacy can happen at the local, state or federal level. Policy change
can include the creation of new ordinances or legislation, modification of current policy or
advocacy for the enforcement of current law considered weak. At this level, the potential
intervention could have far-reaching benefits for the targeted population. The LYC can
advocate for policy level change through community organizing, talking with decision
makers and officials, or media campaigns. In order to actually make community and
policy level change, the Council needs authentic access to policy makers and visible public
presence.
! 54Adults should train youth in approaches to policy change. Changing social
norms can happen as a result of policy change (e.g. seatbelt laws and smoking bans), but it
is also a long-term impact of the work of the LYC. As the LYC develops and more cohorts of
youth become involved, the impact of multiple projects can lead to changing the way
people view the City of Lawrence and its youth. Youth become an engine of positive change
in city government and people take notice.
Policy Intervention Example.
Lowering the voting age to 16 years old so that more
youth have an opportunity to have a voice in local elections and decision.
*A
decrease in the voting age would certainly change the way politicians viewed
youth!
Action-Oriented Inquiry Model
The Three-Lens Approach at the beginning of this chapter illustrated how youth are
beneficiaries, partners and leaders in genuine youth participation. In order to shift the
negative frameworks for viewing youth addressed earlier in the report, the LYC should view
learning as a mutual exchange between adults and youth with the shared goal of
addressing a problem. Youth are not passive recipients or solely beneficiaries (or the sole
beneficiaries). Freire’s antidote for the passive learner approach and “banking education”
(mentioned in Chapter One) is “problem-posing education.”
!10Adults and youth engage in
a dialogue about their world to support youth efforts toward social action and change.
!35Jennings et al. state, “The premise of [Freire’s] work is that liberating and empowering
education is a process that involves listening, dialogue, critical reflection, and reflective
action.”
!35By using a problem-posing approach that is action-oriented, the LYC members
can be involved in:
1.
Issue identification:
Discussions within the LYC and with constituents; using an
image elicitation method (i.e. maps or photos) helps with dialogue and critical
reflection.
ACTION-ORIENTED
INQUIRY
Develop
& Implement
Project
Evaluate
Project
Identify
Issue
2.
Data collection/information gathering:
Once the issue is identified, it is important
to understand the underlying issues and contributing factors to the current state of
the issue; youth can conduct interviews, surveys and research on secondary source
material.
3.
Project development and implementation:
The data will then inform the best
method for intervention (i.e. reflective action); youth should create a project plan,
set goals and deadlines and seek necessary training for successful implementation.
4.
Evaluation of results:
It is important to critically reflect on all stages of the process
and evaluate for improvements; youth should also learn to evaluate their
intervention as assess whether they met their goals (see Resourses).
This approach is a cyclical process, and the results from one project can and should be used
to inform the next round of issue identification. In the next section, I will evaluate the
current LYC implementation to-date and provide recommendations for incorporating the
SEF and the Action-Oriented Inquiry Model.
“The teacher is no longer merely the-one-who-teaches, but one who [is taught] in dialogue
with the students, who in turn while being taught, also teach… The students—no longer docile
listeners—are now critical co-investigators in dialogue with the teacher”