By
Xiangming Mu
A Master's paper submitted to the faculty
of the School of Information and Library Science
of the University of North Carolina at Chapel Hill
in partial fulfillment of the requirements
for the degree of Master of Science in
Information Science.
Chapel Hill, North Carolina
May, 2000
Approved by:
Xiangming Mu. Java Table Browser: Transportation and presentation of large statistical tables over Network. A Master's paper for the M.S. in I.S degree. May, 2000. 58 pages. Advisor: Gary Marchionini
This study describes a novel design of Java table browser using XML(jTBX). A standard table-browsing environment is provided in the form of Java applet which can be opened in any web browser such as Netscape, or Internet Explore with Java 1.2 plug-in installed. Some manipulation functions to tables are supported for various level of objects in table( table, sub-table, column, row, cell). A hierarchical Java tree provides the table of content (TOC) of available tables.
Three tier architecture is used in the jTBX system design. Remote database tier provides raw data from distributed sites. Web server tier generates the response in the standard XML format to the requests from the client side tier (table browser). Metadata for tables are integrated into the XML files (or streams) before being used by client Java applet. Multiple threads are generated for a large table transporting .
Headings:
Technical Tools and Concept – Java table browser using XML System Structure – Three tier web structure
Table of Content
Session Page
Chapter 1: Introduction 1
1) Introduction 1
2).Background and Related Work 4
Chapter 2: Problem Definition 9
Chapter 3: System Analysis and Design 12
1). System Analysis 12
2). Design Strategy 13
3). Architecture Design 17
• Java • XML
• Three Tier Architecture
a) Remote Database Management System Tier b) Server Side Information Process Tiers c) Client Side User Interface Tier
17 18 21 22 23 25
4). Interface Design a). Overview b). Table Book
c) Manipulation Functions
Chapter 4: Experiment and Analysis 1) System Description 2) Experiment One 3) Experiment Two
32 32 32 37
Chapter 5: Conclusion and Summary 41
1). Conclusion 41
2). Future Work 41
Chapter 6: Bibliography 43
Appendix A:
• Drag and Drop
• SubTable
• Modify and Percentage
• Multiple Tables
48 48 49 50 51 Appendix B:
• DTD for Table 12 • DTD for Table 13
• DTD for Table 14
• DTD for Table 26 • DTD for Table 43
Chapter 1 :Introduction
1. Introduction:
Tables are a convenient way to represent complex relationships across statistical data by using an organized and compact tabular form. To present tables through web pages, HTML is currently considered the most popular technique. The HTML provides language components such as table tags <TABLE> <TD> <TR> to facilitate table presentation in the context of a web browser. However, this schema only works very well with small tables where one or several screens/pages are enough for the representation. For some large statistical tables, the amounts of rows and columns require that hundreds of pages/screens be utilized in representing a single table. In such a case, users will find it difficult in quickly accessing the needed tabular data over the Network, especially over a slow connection through a modem, which will not be improved soon due to the technical limitation on transmitting a large amounts of data over Internet.
of the user’s control. In other words, the user can not decide how many tables or which part of a table should be transferred. However, it is often unnecessary to send a whole large table from the server side, especially when users are only interested in the metadata of the table or try to glance over the table context
.
Another problem is associated with the display and manipulation of the table using HTML tags. Often, to browse a large table and find out the particular tabular data, horizontal and vertical scrolling operations will be used. With the HTML scrolling operation, it is impossible to keep the headings of columns or rows visible while focusing on cells at the far end of the table. Without these headings, however, users will run into difficulties in identifying what they are searching for and what is the exact meaning of a particular cell.
different perspectives. Filtering or partitioning of a big table is provided to make the important information more visible. The maximum, minimum or mean of a set of selected data can be gotten. Up to now, however, all these programs are restricted to local applications. The current HTML technique has no manipulation functions over table representation. Although it is possible to prepare the result for a particular manipulation operation in terms of HTML pages and set up a connection to them by hyper links, the solution is limited in the varieties of manipulations and the amount of data that can be handled. When the scale and complexity of the table increase, it is difficult to apply the hyper link solution to each manipulation of a particular table.
Large tables with statistical data are usually complicated both in structures and data relationships. It is one big challenge for untrained users to understand the meaning of data accurately in such tables. Currently, no technique has tried to address the issue by
providing online help when browsing over tabular data built with HTML tags.
Instead of using HTML, XML tags are added to the table data to convert various database tabular data into an uniform XML format which can easily be compressed and transported over the Internet. On the client side, a Java applet is provided as the table-browsing platform for the user to do the data manipulations. The XML data stream with a
particular Data Type Definitions (DTD) acts as the standard input for the table browser. Java threads are used to separate the underlying data transportation from the applet program itself. At the initial stage of the data transportation of a large table, only the metadata, headings of the table and first two pages/screens are represented. Then the tabular data is transported through a stand-alone Java thread. The advantages and disadvantages of the architecture will be discussed in this paper.
2. Background and Related Work
The volume of tables on the Network is becoming larger and larger, especially of those tables containing multimedia data or tables recording scientific observation results
(Plaisant et al, 1999). Current Network connection speed, however, is still far slower than expectation. The fastest speed using a modem is 56Kpbs (bit per second) according to the V.90 standard. Under such a condition, a nearly two million byte table “Health, United
will take around 5 minutes to be downloaded through a standard telephone line ( in practice, the time may be much longer depending on the ISP).
Not all users are interested in the whole content of a table, yet HTML or PDF transfer the entire table. Different people may search for different information. One who newly moved into a city may want to know the rental rates of that city rather than the cities around the country. So a straightforward solution to reduce the Network traffic is to divide a large table into some small sub-tables based on various catalogues. However, when the number of catalogues become large, say, several thousands for the Center of Disease Control and Prevention (CDC), users will feel frustrated after taking half an hour to navigate and try to find the right catalogue of information. To make things worse, users can get lost during the process of browsing and find no link to go back to the initial entrant web site. A corresponding solution is to provide a previewed visualized web structure during navigation, as in the software WebTOC (Nation, Plaisant, Marchonini, and Komliodi,1996). This will help users to position themselves during web browsing. A similar approach uses the concept of WebBook--- a book metaphor to group a collection of related Web pages for exploring and interaction. The corresponding interface is called WebForage that allows users to analyze and manage Multi-WebBook (Card, Robertson, York, 1996). Other efforts around this concept include Navigational View Builder
and WebCutter (Maarek, Jacovi, Shtalhaim, Zernik & Ben Shaul, 1997). Although the classification strategy for each method may be different (Hunter 1988) from each other, all these methods focus on building a visualized hierarchical structure to a cluster of related web collections.
Usually there are two strategies to obtain data from large information systems. The browsing strategy is based on user recognition of relevant information. The analytical strategy focuses on careful planning, recall of query terms, iterative query formulation, and examination of results (Marchionini, 1995). Based on these strategies the concept of "interactive" table was proposed which provide a dynamic analogue to structured
document (Stotts, Furuta & Cabarrus, 1998). They focused on using an automated
program verification technique called model checking to exhibit certain desired properties of the document. Each link from the document is treated as a node and is constructed automatically when browsed. This links-automation can let the user jump directly to the Table of Contents node from anywhere. Furthermore, Wang and Rada (1998) illustrated a structured hypertext model based on the combination of graph representations,
composition schemes, a set of rules and a set of operators. This model is a formal
graph in which concepts are represented as nodes and relations between concepts are represented as links" (Wang & Rada, 1998).
The reduction of Network traffic can partly be achieved by the concept of formalization. One approach is to formalize the data stream between server and client. Chomskey (1996) described such a process as " putting information in a symbolic form that can be processed by computer, or a kind of "formal language". Users first propose the informal information and the system, which is called Hyper-Object Substrate (HOS), helps the users to formalize the data dynamically. The HOS integrates the formal and informal information and supports the progressive formalization of the information through a dialogue between the user and the system.
In addition, some software such as the Table Lens (Rao and Card,1994), FOCUS
(Spenke, Beilken, and Berlage, 1996), and MetricView (Small, Wong, and Canetti,1998) are developed to explore effective ways to visualize table browsing or manipulation. The Table Lens focuses on the visualized representation of large tables using a focus+context (fisheye) technique. Symbolic and graphical representations provided more flexibility for users to explore the data. FOCUS also describes a table browser that using the
“Living Tables” provides some prototypes on XML table tags which includes Table title, table author, metatag, metadata, multiple versions, member of a cluster, location of raw data, other displays, and print versions. Brand Niemann (2000) suggested the
Chapter 2: Problem Definition
The data used over Internet are in various formats: PDF; spreadsheet( like Microsfort Excel, Lotus-1-2-3), Text file, database raw data , and table data wrapped in the HTML table tags.
Spreadsheet data formats can not be displayed directly in any web browser. A special program is needed to load and open the data format. The traditional way to access this kind of data is by either providing a hyper link for user to download and read them with local program or transforming them into HTML format tables and browsing them in a web browser.
PDF and Netscape or Internet Explorer (IE) for HTML tables ), there is no control functions over table rows and table columns such as deleting; moving; drag and drop; calculating (maximum, minimum, mean), sorting, or online editing. Even though a general zooming (in/out) function is provided by the PDF browser, it is on the page level and there is no way to execute it on particular rows and columns.
Another problem associated with current HTML table browsing techniques is that scrolling a large table will always increase the difficulty of understanding the table context by losing track of table headings. Meanwhile, on the table cell level, it is difficult to provide metadata information over each cell content. With the HTML technique, the mouse-over functions that are used to give further explanation of a particular cell data could only be realized by built-in routines written in a script language such as Javascript or VBscript. Corresponding to each cell that needs to be explained, a special routine has to be written. As a result, the implementation of the mouse over function is made dependant on particular data displayed. At the same time, a large language overhead is introduced with many table cells establishing script routines to realize mouse over function for themselves.
content. A Java applet has the advantage of direct control over table objects such as rows, columns and cells, thus making it possible to do various manipulations on interesting table content at the statistical object level. The drawback of this approach is that a Java applet is time consuming, especially in the initialization process. The loading process often takes tens of seconds with nothing appearing on the screen. The time interval is acceptable when tables are relatively small. However, tables with thousands of rows will not fit into the design where table loading becomes intolerable.
Databases provide structured raw data that are also widely used over Internet. In Dynamic HTML applications. there are wide varieties of database management system (DBMS) running on operating systems such as Unix, Solaris, Linux, Windows95/98/NT, or Macintosh. Even for a particular operating system such as windows, there are database systems in large diversity supported by drivers from different vendors including
Microsoft Access, Foxpro, Microsoft SQL server, Dbase, Oracle, MySQL, mSQL,Sybase, Informix, etc. For information providers such as the U.S. Bureau of the Census, the data come from databases distributed across the country. One of the challenges is to find an effective way to integrate the data to a uniform data format.
Chapter 3: System Analysis and Design
1. System Analysis
Our system is designed to serves for two customer groups: one is the final user of the table browser, the other is the service provider (government agency, public services, or any entity that provides table information through the Internet). The final users are often novice users rather than high-end users. The goal of the project is to promote citizen understanding and use of tabular data. To this end, our design centers on the following aspects:
• Fast transfers:
Usually the casual users are more concerned with the speed of information that can be transferred over the Network.
• Quick responses
After the table request is made, a quick response is expected for initial GUI. After all the necessary information has been received and stored in the users’ local memory, quick response is expected by users for any operations.
• Manipulation
Users can do most of the operations without formal training and without loading or learning special software.
The concerns of information providers include: • Reusability
Little extra effort is needed for using the table browser on different table sets except providing parameters of relevant data and running the program on the server side. • Uniformity
Tools should be provided to facilitate the generation of uniform XML data in terms of DTD from various Database Manage Systems (DBMS). This DTD makes sure that the XML table data will be acceptable anywhere as a standard of data import format. Our design aims to meet these criteria by these two particular user groups.
2. Design Strategy
The detailed explanation of the architecture will be given in the architecture design section.
On the client side, the aim of the design is to provide a friendly, self-contained
environment dedicated to table browsing. The fast response to user requests is another consideration. To this end, a new approach is proposed based on Java applet technique. The approach exploits the strength of Java techniques for object manipulations,
furthermore, it circumvents the drawback of slow initialization of Java applets by employing a novel initialization technique.
The traditional way of Java applet application is to load the graphical user interface (GUI) and underlying data simultaneously in the initialization process. The initialization time may become unacceptable when a large table makes the data loading unexpectedly long. However, the overhead is tolerable for users if they know they can do some
The time taken to open Netscape, though it is not as fast as we like, is also within
expectation. Keeping with this idea, at the first stage of the initialization, our design is to set up and load a table-browsing environment. The environment is loaded only once in the initialization process, and is separated from the data loading, just as opening a word processor first before opening a document. Technically, the separation is made possible by using multiple threads in the Java applet. The loading and actions of the GUI are managed by a different thread from data loading thread. With GUI and data loading separate, from the users’ perspective, the initial response time of the table request will decrease significantly. From the programmer’s point of view, decoupling GUI
environment from data enhances the reusability of the client side design. Furthermore, when the GUI is designed as a standard environment, users will find it easy to familiarize themselves with the interface and operation tools that are applicable to all table browsing and manipulation. In fact, after the Java applet (table browser) is initialized, it behaves more like a local application. Users can do manipulations as well as browsing of related tables without leaving the environment and opening another Java applet. It is similar to the Netscape application where the Netscape window opens just once so the user can surf from one web site to another with no overhead on initialization.
efficiently present the table data and guide the user to a desired topic. To address these problems, we include two features in our client side design. One is that a hierarchical structure of table contents (TOC) will be given in the GUI environment to facilitate the users’ browsing and shifting from one table to another. With the TOC, It will be easier for users to identify the related tables by knowing the tree structure of table organizations. Since the general related tables are classified in the same tree branch, to locate relevant tables is simple and straightforward. In terms of data loading, the TOC requires that the metadata of the table be loaded with the GUI. These information serve as a basis for further table exploration while avoiding the unnecessary loading of data. Specifically, as metadata give a brief explanation of the tables such as the main subject, the size and the time, etc, the users can make a more judicious selection of information to be further loaded into the table browser. In interface design, TOC metadata is to be shown in mouse over actions for TOC branches.
Another feature in the client side design is concerned with the loading of tables with large amounts of data. As mentioned earlier, long data loading is acceptable when users have the freedom to do some explanations and manipulations over part of the data. Under this principle, the design divides the data loading into two stages. After the first part of the data have been loaded, the GUI will display them and allow users to browse and
in background. This is different from traditional Java table browsing techniques where data can only be displayed after it is fully loaded. Rather, after a short delay of initial pages loading, users can access the data manipulation without awareness of the further loading process. From the users’ point of view, a moment after a table request is sent, there will be substantial information there and corresponding manipulation freedom to explore. From the technical point of view, the fast loading and manipulation are made possible by running data loading threads simultaneously and separately from the GUI thread. The factor that the two threads share the same data space makes it easy to refresh the GUI data section with loaded data in data loading thread.
3. Architecture Design
Two fundamental techniques that are used in this architecture design are Java and XML.
Java
Java is the primary programming language chose to implement our system design. With the built-in packages supporting network (java.net package) , graphic (java.awt,
In addition to the well know advantages for Java such as robustness, international language support, cross platform compatibility, security, tools library (Java Beans), Java has a close coupling with XML ( java.xml package is available). Most of the XML parsers are written in Java or provide support to Java.
Java also provides the support for Java threads which are defined as a light weight process of execution in a Java program. This technology make it possible to transfer a large table in a separate thread while allow users to do manipulations on the interface.
XML
Extensible Markup Language, or XML, is not really a language but rather a meta-language for defining markup meta-languages. It was invented for content-specific markup of documents. As an excellent tool for data description, XML provides us a standard medium to carry table data between the server and the client Java applet GUI.
for further processing such as graphic utilization without introducing redundancy on network transportation.
Structured XML data has also a good potential to be compressed. The compressed JAR files generated from the XML source file are much smaller than that of the original file size. Thus, when transporting a large table over the Network, XML demonstrates a distinct advantage over other data formats.
The flexibility of the XML tags allows us to integrate the raw data of the tables with their metadata coherently. In this project, a special XML generator is developed ( a Java Bean), to generate standard XML files given the database tables and the associated metadata information. These XML files are independent of the original database formats. An example of XML representation of a table object with metadata is presented as follows.
Where
• “object” can be any object of the table such as table, column, row, or cell. The
object named and valued are extracted from the database table directly. < object name=”object” exp=” the content of explanation”>
object content
• “exp” is an attribute of an object. It is the metadata of an object which can be
stored in a separate database or table. By using “exp”, the XML integrates object and metadata together effectively.
XML can also reconstruct the raw data and make it more “intelligen
manipulation functions and control commands can also be integrated into the XML file. For example, for a particular column object in the XML file, we can define it to be protected by password like this
In such a manner, before accessing this sensitive data, a password will be requested by our jTBX interface.
Finally, XML can let us establish the hierarchical structure across tables. The following two tables are siblings to each other because they have the same parent node. In the same manner, a hierarchical tree for tables is built in this project and displayed through our
< column name=”SSN” passwordProtected=”true” exp=” the content of explanation” >
column content
Table Book windows ( Table of Content for all available tables in the form of a Java Tree).
Three Tier Architecture
A three tier architecture is employed in our system design. The three tiers include a client side user interface tier; a server side information process tier (middle tier) and a remote database management system tier. Each tier can be developed independently to any degree of sophistication. Therefore, any upgrade made to the each tier will not
automatically affect others. Since the architecture is based on Java and XML techniques, it is also operating system independent (Unix or Windows or Machitosh),
< table name=”table 12” parentNode=”population”
exp=” Resident Population--Selected Characteristics and Projections” >
table content
</table>
< table name=”table 14” parentNode=”population” exp=” Resident Population by Age and Sex” >
table content
a) Remote Database Management System Tier
Statistical tables are often stored in remote database servers rather than servers at the same location as web servers. With the installation of an appropriate ODBC driver on the middle tier (web server), client side applet can communicate with these databases through a JDBC-ODBC bridge which is provided in the standard Java packages.
For frequently used tables, this architecture is designed to generate XML files from remote tables and store them directly in the middle tier for quick reference. All these files are compressed into the Java JAR format to facilitate fast Network transportation.
To generate the XML file, a XML Java bean is developed for data integration from various database resources. The Java bean can be used to translate any kinds of database
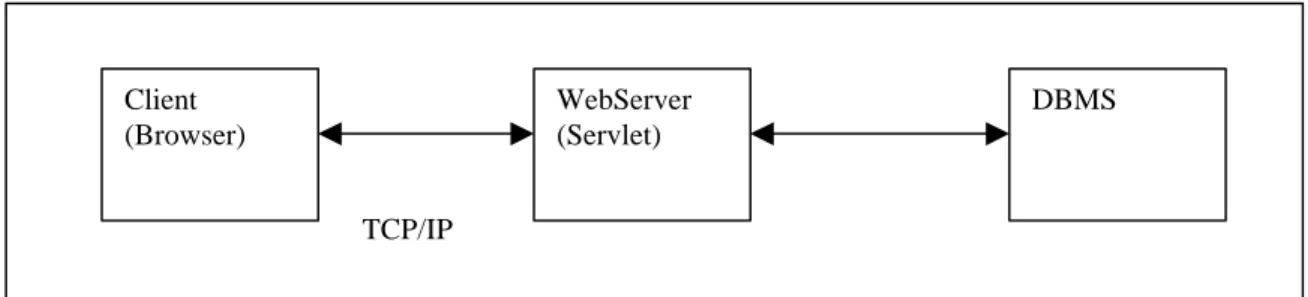
Client tier Middle Web server tier Database tier
Figure 1: Three tier architectural design Client
(Browser)
WebServer (Servlet)
DBMS
tables into an uniform XML file that the client side interface (Java applets) can recognize and load. The client side programming then becomes much easier with the standard data input and no knowledge of the interactive database.
Also, with the assistance of the Java bean program, different information agencies can exchange information in terms of XML files without installing extra database drivers of particular data types.
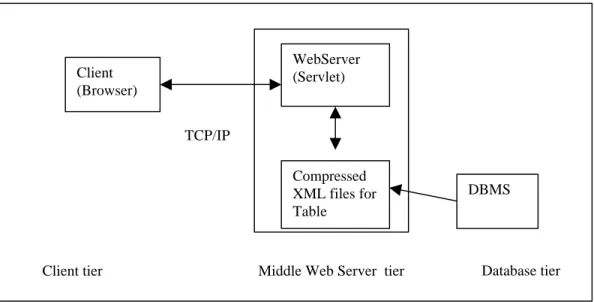
b) Server Side Information Process Tier (middle tier)
Client (Browser)
WebServer (Servlet)
DBMS TCP/IP
Client tier Middle Web Server tier Database tier Compressed
XML files for Table
This tier runs the Java web server and servlet. Servlets are programs that run within the context of a server, which is analogous to applets that run within the context of a browser. They are used to implement the service that receives requests from client applets and pass the requests to appropriate DBMS. After getting the response from the DBMS,
corresponding XML tags are added based on the DTD and the XML stream are sent back to the client. If the requested table is already stored in XML format in advance, that XML file will be sent back directly.
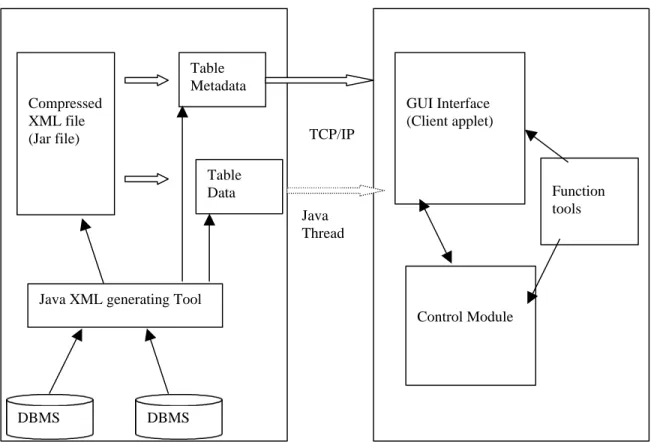
TCP/IP Table Metadata Table Data GUI Interface (Client applet) Compressed XML file (Jar file)
Java XML generating Tool
DBMS
Control Module
Function tools
DBMS
Figure 3: System design modules and multiple Java threads on data transporting Java
c). Client Side User Interface Tier
A Java Swing GUI interface is designed for table data manipulations. Several modules are included in this part (Figure 3):
View Module: provides the layout for the Table Browser.
Control Module: provides underlying functions and control for the interface and keeps track of all the tables and their metadata.
I/O Module: uses the XML package provided by SUN to parse the input XML stream/file and generate the corresponding Java objects.
Transport Module:manages the data transportation between the server and client.
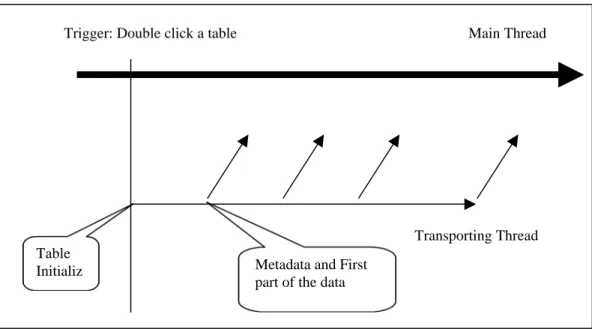
content in the first two pages/screens, or dragging and dropping a particular column. The following steps list the process of loading a large table through multiple thread
technology.
• In the initial phase, only the interface of the program(environment), the metadata of
the tables and a hierarchical structure of tables are loaded.
• If a table is double-clicked by users, new thread is generated for data transporting
• If the table is a large table (more than two hundred rows), the first two hundred rows
will be transported and presented to the interface for the user to do manipulations • The other table data will continue to be loaded and the interface will be refreshed
whenever the next five hundreds rows arrive from server.
Main Thread
Table Initializ e
Trigger: Double click a table
Transporting Thread Metadata and First
part of the data
4. Interface Design
a) Overview:
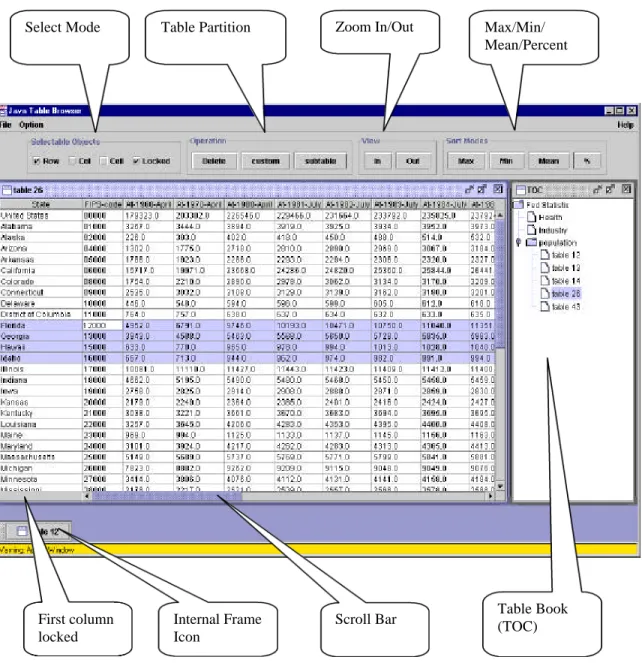
After providing the URL of the jTBX in any web browser such as Netscape or Internet Explorer which has the Java 1.2 plug-in support ( The plug-in can be easily downloaded from the web site of SUN at http://www.java.sun.com/products/plugin ), Java Frame will appear to the screen and automatically adjust itself to take about eighty percent of the current application screen (fig 5). The interface of jTBX includes a control panel, menu bar, and a desktop panel. Traditional operations such as file( open/close/save/save as/ print/exit), edit(cut/paste/copy/delete/search/replace/redo/undo…), configuration, and help are implemented in the menu bar panel. The control panel includes selection control (row/column/cell) which decides which object to is subject to manipulation, view
control(zoom in/out, locked first column), partition control (sub-table/customized table), and other controls ( maximum/minimum/mean/percentage of a particular column) . There are two work spaces for the desktop panel. One is for table context which takes 80% of the space. Another 20% is for the hierarchical table structure (TOC) which is
b). Table Book :
The jTBX has a built-in “Table Book”- A hierarchical structure for all the tables in a specific web site such as Bureau of Labor Statistics (BLS). This “book” can guide users while browsing, and users can always identify where they are and what kind of table they are now navigating. The hierarchical structure is developed from the concept proposed by Terveen, Hill & Amento (1999) who suggested to build the structure based on the content of each web pages and the coherence between them. The web site is used instead of web page as the unit of analysis and interaction. A site contains a coherent collection of pages on a given topic and usually had a "front door" page in which all other web pages in this site are linked from. A collection of closely connected sites formed a clan graph which contains site profiles about the amount and type of the content and the links among these sites. An example for this concept, which is called auditorium visualization design, was proposed by Teryeen (1999).
The jTBX adopted a spreadsheet style interface which is familiar to most computer users. From the viewpoint of version control, the interface design should consider the
granularity and the immutability of versions (Hicks, Leggett, Nurnberg & Schnase,1998). Our interface design inherits some functions and the layout of spreadsheets such as the menu, the online help, and so on. The value of a cell in spreadsheet paradigms is defined solely by the formula explicitly given by the user (Kay,1984), and one important
advantage of spreadsheets is the direct manipulation (Shneiderman,1983). Green and Petre gave further description of this (1996). Another advantage of spreadsheets is the direct engagement, "a feeling that one is directly manipulating the objects of interest" (Nardi,1993). According to recent research by Burnett & Gottfried (1998), graphical objects can be directly manipulated in a manner that completely fit the spreadsheet paradigm.
c). Manipulation Functions
Some manipulation operations are also provided by the jTBX.
Zoom In/Out : users scan freely, zoom in/out of the representation of the table in terms of row or column or both.
Delete : any selected rows/ columns can be deleted on the fly.
Calculation: for a particular column, the maximum/minimum/mean can be calculated if this column consists of numbers. Sometimes a percentage of one column can be calculated also based on the total number of several other columns. For example: the column of males in a population table can calculate the percentage based on the total of two columns: male and female.
Edit: Users can modify the context of the table directly just by double-clicking the particular cell that they want to modify.
Tooltips and layers: metadata and help information for table/column/row/cell will appear after several seconds staying of the mouse as a tooltip.
Table Partition: A subtable based on the columns and rows chosen by the users will be generated automatically and stores itself in the Table book
Table Partition Zoom In/Out Max/Min/ Mean/Percent Select Mode
Table Book (TOC) Scroll Bar
First column locked
Internal Frame Icon
Chapter 4: Experiment and Analysis
1. System Description
The following table give a brief description about the system we used for running this experiment.
Component description
Hardware a PentiumII workstation with 64M memory Web Server Java WebServer 2.0 from SUN™
Operating System Windows 98 Java Version Java 1.2.2
Extended Library Java XML package and Servlet package from SUN™
Database System:
Two types of database manage systems are used in our experiment as the third tier of the three tier structure: Microsoft™ Access for windows system and MySQL for Linux. In the middle tier( web server tier), an extra MyODBC driver is installed in a window 98 system and a reference to the remote Linux MySQL database system is established.
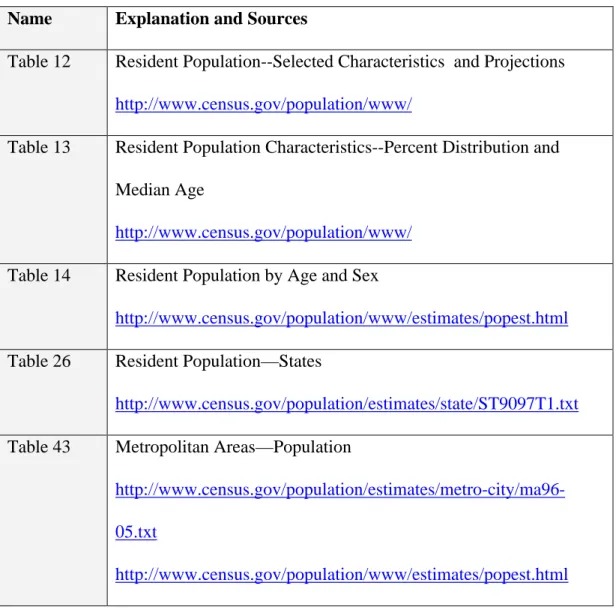
Five tables are used in our experiment. All of them come from the U.S. Bureau of the Census, U.S. Census of Population (http://www.census.gov/population/www/).
Name Explanation and Sources
Table 12 Resident Population--Selected Characteristics and Projections
http://www.census.gov/population/www/
Table 13 Resident Population Characteristics--Percent Distribution and Median Age
http://www.census.gov/population/www/
Table 14 Resident Population by Age and Sex
http://www.census.gov/population/www/estimates/popest.html
Table 26 Resident Population—States
http://www.census.gov/population/estimates/state/ST9097T1.txt Table 43 Metropolitan Areas—Population
http://www.census.gov/population/estimates/metro-city/ma96-05.txt
http://www.census.gov/population/www/estimates/popest.html
Table 43 covers metropolitan statistical area (MSAs), consolidated metropolitan
Using an XML generating tool we designed, five XML files are generated based on these tables and their DTD (see Appendix B) for testing.
The experiment examines the benefits of our new table browser system, jTBX, when the accessed table data is remote, that is, through the Internet rather than the local file system. The user referred to here is an abstract user not a actual user. The objective for this user is to select specific tables from a remote web site, open them and then do some
manipulations on them. To complete this objective, the user will perform the following tasks using jTBX.
Task one: Table browsing and selecting.
various kinds of tables. If the user opens more than one table such as in this case, there will be no overhead for the browser to be reloaded. That means the table browser is “open once, use forever”.
Task two: In this task the user will browse the context of the table.
The user can see the columns and rows that are out of the screen using horizontal and vertical scrolling bar.
With the “lock” check box selected in the control panel, the headings of column and rows will be kept while scrolling.
By clicking the Zoom In/Out buttons in the control panel, the user can shrink/amplify the whole table( with cell check box selected), the columns( with column check box selected), or the rows( with the row check box selected) to one half/(two times) of the original representation.
When the user moves the mouse over different parts of the table and stays for a little while( the default is 3 seconds), an explanation for that particular object (table/column/row/heading/cell) will be displayed in terms of tooltips. That is a separate layer over the current table and can be also cascaded for further exploration ( third layer or fourth layer). These explanations in metadata are carried with the particular object in the XML files .
With the mouse pressed on the heading of a particular column, the user can drag that column to other positions and drop it by releasing the mouse. For example, in table 14, the user can drag the column which represents the population under 5 years old to the side of another column which represents the population between 20-24 year old (Appendix A –Drag and Drop)
After selecting interesting rows, the user can customize a sub-table by clicking the subtable button. This sub-table will automatically be stored in the
hierarchical structure of the TOC under a node selected by user. Appendix A-SubTable shows that the user choose three states of population from table 26: Missouri, North Carolina, and South Carolina and formed a new sub-table. Task four: Table data processing and further analysis
After a specific column is selected, the maximum, minimum or mean can be calculated if that make sense. In table 43, for the column “percentage change of population from 1980 to 1990”, the maximum is 89.8% at “Punta Gorda, FL
14.8% at “Gasper,WY MSA”. The mean for all 346 rows for percentage change is 12.1%. These calculations take little time because all the information is stored in the user’s local memory.
Task five: Modification and Security protection
User can modify the statistical data directly within jTBX. For example, the state name can be changed to their abbreviation based on the user’s perference( Appendix A-Modify and Percentage)
For some sensitive data which the information provider hopes to restrict to some particular users, a password prompt window will protect them from general users.
Task six: Multiple table comparison
Each of the opened tables can be minimized or reshaped to any size. The user can compare the content across different tables. (see Appendix A-Multiple Tables)
3. Experiment Two:
This experiment is to compare our multiple thread design to the traditional single thread design. For a large table which has thousands of rows, jTBX has the advantage of fast interface response. After the first two hundred rows and metadata are received, jTBX will display that part of table while the Java thread will continue the transferring in the
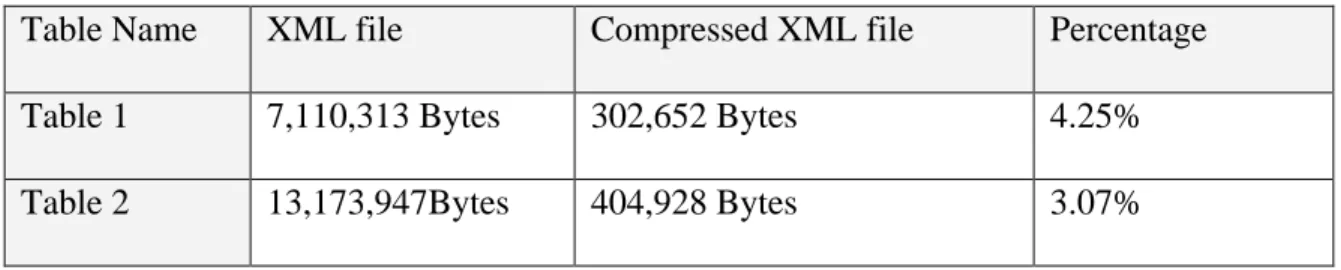
In this experiment, two tables are used, the purpose is to
• test the ratio of compression for the generated XML files
• measure and compare the initial response time of table request.
Table 1: E9200A1:Economy-Wide Key Statistics (1997 NAICS Basis): 1992 17,264 rows, 22 columns.
Table 2: E9751A1.MDB: Information: Geographic Area Series for the United States, States, Metropolitan Areas, Counties, and Places: 1997
25,006 rows, 24 columns.
The network connection is through fast Ethernet (100Mb/s) in the School of Information and Library Science, University of North Carolina at Chapel Hill.
For each table, six tests are conducted at different time of a day and different day of a week The averages of the six runs are used so that the effect of network traffic variation can be reduced. The results are reported in the following table
Where
• XML file refers to the original XML files generated from tables
• Compressed XML file refers to the compressed XML JAR files • Percentage refers to the ratio of compressed file to the original file
.
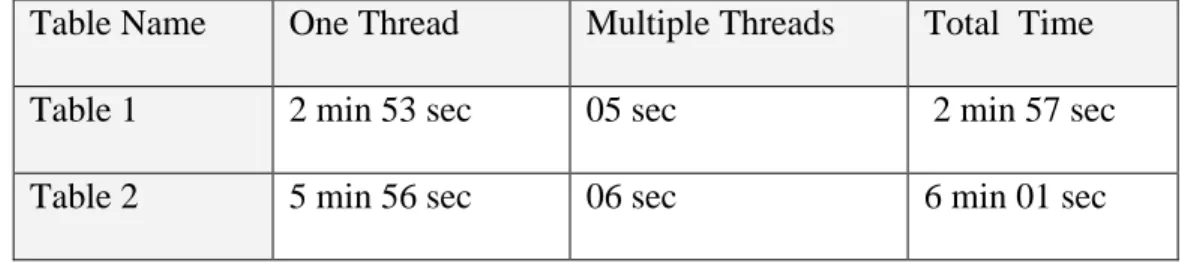
Table Name One Thread Multiple Threads Total Time Table 1 2 min 53 sec 05 sec 2 min 57 sec Table 2 5 min 56 sec 06 sec 6 min 01 sec
Where
• One Thread refers to the table browser design without multiple thread support for
data transporting( only one main thread).
• Multiple Threads refers to the multiple thread design of jTBX
• Total time refers to the time needed to complete all the data transporting in the
multiple thread design
With the multiple thread design, it is much faster for jTBX to show the table(partly) than other single thread Java applications. When the user browses the first one or two
Chapter 5: Conclusion and Summary
1. Conclusion and Summary
Research has shown that, compared to text description, tables provide more concise and useable numeric data representation. One limitation of traditional table browser is that they prohibit us from doing any manipulations on the table. The interface design is also not appropriate for browsing some large tables. For example, tables often contain many more columns of data or rows than can be displayed on a single screen. The headers of the table will disappear when users scroll down to find the rows of interest. Another problem is the heavy Network traffic caused by browsing multiple aspects of a large table, which is stored in the server, and the user has to go back and forth repeatedly. Using XML instead of HTML, jTBX provides a spreadsheet diagram interface, which provides users a standard environment for browsing remote tables. Instead of using a single thread, multiple threads are used in the data transportation from server to client for some large tables. The initialization time has been greatly reduced.
2. Future Work.
user while doing manipulations or editing. Not only drag/drop with columns, but also with selected row(s) is also under consideration.
Adding more data analysis functions such as statistical functions to the data manipulations will be one of our next considerations.
2D graphics will be provided based on the statistical data.
Bibliography
Burnett,M. & Gottfried,H.(1998). Graphical Definitions:Expanding spreadsheet languages through direct manipulation and gestures. ACM Transactions on Computer-Human Interaction,5,1-33.
Card,S.,Robertson,G. & York,W.(1996). The WebBook and the Web Forager: an information workspace for the World-Wide Web. Conference proceedings on Human factors in computing systems(CHI'96,Vancouver,B.C.,Canada,
Apr.13-18,1996),New York, NY: ACM Press.
Chang,C. & Garcia-molina,H.(1999). Predicate rewriting for translating boolean queries in a heterogeneous information system. ACM Transactions on Information Systems, 17,1-39.
Chimera,R. & Shneiderman,B (1994). An exploratory evaluation of three interfaces for browsing large hierarchical tables of contents. ACM Transactions on Information Systems,12,383-406.
Chomsky, N.(1956).Three models for the description of language. IEEE Transaction of Information Theory,2,113-124
Green,T. & Petre,M.(1996). Usability analysis of visual programming environments: a "cognitive dimensions" framework. Journal of Visual Language Computer,7,131-174.
Hunter, E. (1988). Classification Made Simple. Brookfield, VT: Gower, p. 3-49. Hicks,D., Leggett,J., Nurnberg,P. & Schnase,J.(1998). A hypermedia version control
framework. ACM Transactions on Information Systems,16,127-160.
Kandogan,E., & Shneiderman,B.(1997). Elastic windows: a hierarchical multi-window World-Wild Web Browser. Proceedings of the ACM Conference on User Interface Software and Technology (UIST'97,Banff, Alberta, Canada, October
).New York, NY: ACM Press.
Kay,A.(1984). Computer software. Science of America. 250.53-59.
Maarek,Y., Jacovi,M., Shtalhaim,M., Zernik,D, & Ben Shaul,I.(1997). WebCutter: a system for dynamic and tailorable site mapping. Proceedings of the 6th International World Wide Web Conference (Santa Clara CA,Apr.)
Marchionini,G.(1995).Information seeking in electronic environments. Cambridge Series on Human-Computer Interaction. New York,NY: Cambridge University Press. Marchionini,G.(1999). Supporting citizen access to statistical data: WWW interfaces for
tables. Retrieved from the Homepage of Dr. Marchionini,
Marden,P. & Munson,E.(1999).Today's Style Sheet Standards: The Great Vision Blinded. IEEE Computer,32,123-125.
Mostafa,J., Mukhopadhyay,S., Lam,W. & Palakal,M.(1997). A multilevel approach to intelligent information filtering: model, system, and evaluation. ACM
Transactions on Information Systems, 15,368-399.
Mukherjea,S. & foley,J.,(1995). Visualiziong the World-Wide Web with the navigational view builder. Computer Networks ISDN Systems.27,1075-1087.
Nardi,B.(1993). A small matter of programming: perspectives on end user computing. Cambridge,Mass.:MIT Press.
Nation,D., Plaisant,C.,Marchionini,G., and Komlodi,A., (1996)Visualizing websites using a hierarchical table of contents browser: WebTOC,
http://www.uswest.com/web-conference/proceedings/nation.html
Niemann,B. (2000) “Living Tables” for FedStats. Presentation to the FedStats Products Concepts Working Group. March 9,2000
Plaisant,C.,Shneiderman,B.,Doan,K. & Bruns,T.(1999). Interface and data architecture for query preview in networked information systems. ACM Transactions on Information Systems, 17,320-341.
information. Proceeding of CHI’94, ACM conference on human factors in computing systems, New York, NY: ACM press p.318-322,481-482. Shipman,F. & Mccall,R.(1999). Incremental formalization with the hyper-object
substrate. ACM Transactions on Information Systems,17,199-227.
Shneiderman,B.(1983). Direct manipulaiton: a step beyond programming language. Computer. 16. 57- 69.
Small,D., Wong,Y., and Canetti,S. (1998). MetricViews: design of multiple spreadsheets into a single dynamic view. Proceedings of CHI’98, ACM conference on human factors in computiong systems, LateBreaking Results, LA,CA: ACM press, p.303-304.
Spenke,M. , Beiken,C., and Berlage,T. (1996). FOCUS: the interactive table for product comparison and selection. Proceedings of UIST’96, ACM Symposium on User Interface Software and Technology, Seattle,WA: ACM press, p.41-50.
Stotts,D.,Furuta,R. & Cabarrus,C.(1998). Hyperdocuments as automata: verification of trace-based browsing properties by model checking. ACM Transactions on Information Systems, 16,1-30.
Wang,W. & Rada,R.(1998), Structured hypertext with domain semantics. ACM Transactions on Information Systems, 16,372-412.
Wilbur,J.(1998). The knowledge in multiple human relevance judgments. ACM Transactions on Information Systems, 16, 101-126
Temporary table name
Subtable Button
Percent Button Column
Mode
Modification
Appendix B ---DTD for Table 12
<!ELEMENT American-Indian-Eskimo-Aleut ( #PCDATA ) > <!ELEMENT Asian-Pacific-Islanders ( #PCDATA ) >
<!ELEMENT Black ( #PCDATA ) > <!ELEMENT Date ( #PCDATA ) > <!ELEMENT Female ( #PCDATA ) >
<!ELEMENT Hispanic-origin ( #PCDATA ) > <!ELEMENT Male ( #PCDATA ) >
<!ELEMENT row ( Date, Male, Female, White, Black, ToTal-Other,
American-Indian-Eskimo-Aleut, Asian-Pacific-Islanders, Hispanic-origin ) > <!ELEMENT table ( row+ ) >
Appendix B ---DTD for Table 13
<!ELEMENT American-Indian-Eskimo-Aleut ( #PCDATA ) > <!ELEMENT Asian-Pacific-Inlanders ( #PCDATA ) >
<!ELEMENT Black ( #PCDATA ) > <!ELEMENT Date ( #PCDATA ) > <!ELEMENT Female ( #PCDATA ) >
<!ELEMENT Hispanic-origin ( #PCDATA ) > <!ELEMENT Male ( #PCDATA ) >
<!ELEMENT Median-age ( #PCDATA ) >
<!ELEMENT row ( Date, Male, Female, White, Black, Total-Other, American-Indian-Eskimo-Aleut, Asian-Pacific-Inlanders, Hispanic-origin, Median-age ) >
<!ELEMENT table ( row+ ) >
Appendix B –DTD for Table 14
<!ELEMENT between-10-14-years ( #PCDATA ) > <!ELEMENT between-14-17-years ( #PCDATA ) > <!ELEMENT between-15-19-years ( #PCDATA ) > <!ELEMENT between-18-24-years ( #PCDATA ) > <!ELEMENT between-20-24-years ( #PCDATA ) > <!ELEMENT between-25-29-years ( #PCDATA ) > <!ELEMENT between-30-34-years ( #PCDATA ) > <!ELEMENT between-35-40-years ( #PCDATA ) > <!ELEMENT between-40-44-years ( #PCDATA ) > <!ELEMENT between-45-49-years ( #PCDATA ) > <!ELEMENT between-50-54-years ( #PCDATA ) > <!ELEMENT between-5-13-years ( #PCDATA ) > <!ELEMENT between-55-59-years ( #PCDATA ) > <!ELEMENT between-5-9-years ( #PCDATA ) > <!ELEMENT between-60-64-years ( #PCDATA ) > <!ELEMENT between-65-74-years ( #PCDATA ) > <!ELEMENT between-75-84-years ( #PCDATA ) > <!ELEMENT median-age ( #PCDATA ) >
<!ELEMENT row ( year-sex, total-for-al-years, under-5-years, between-5-9-years, between-10-14-years, between-15-19-years, between-20-24-years, between-25-29-years, between-30-34-years, between-35-40-years, between-40-44-years, between-45-49-years, between-50-54-years, between-55-59-years, between-60-64-years, between-65-74-years, between-75-84-years, over-85-years,
between-5-13-years, between-14-17-years, between-18-24-years, median-age ) >
<!ELEMENT table ( row+ ) >
Appendix B – DTD for Table 26
<!ELEMENT At-1996-July ( #PCDATA ) > <!ELEMENT At-1997-July ( #PCDATA ) > <!ELEMENT FIPS-code ( #PCDATA ) >
<!ELEMENT row ( State, FIPS-code, At-1960-April, At-1970-April, At-1980-April, At-1981-July, At-1982-July, At-1983-July, At-1984-July, At-1985-July, At-1986-July, At-1987-July, At-1988-July, At-1989-July, At-1990-April, At-1990-July, At-1991-July, At-1992-July, At-1993-July, At-1994-July, At-1995-July, At-1996-July, At-1997-July ) >
Appendix B --- DTD for Table 43
<!ELEMENT At-1980 ( #PCDATA ) > <!ELEMENT At-1990 ( #PCDATA ) > <!ELEMENT At-1991-July ( #PCDATA ) > <!ELEMENT At-1992-July ( #PCDATA ) > <!ELEMENT At-1993-July ( #PCDATA ) > <!ELEMENT At-1994-July ( #PCDATA ) > <!ELEMENT At-1995-July ( #PCDATA ) > <!ELEMENT At-1996-July ( #PCDATA ) >
<!ELEMENT FIPS-Code-MSA-CMSA ( #PCDATA ) > <!ELEMENT FIPS-Code-PMSA ( #PCDATA ) > <!ELEMENT Metropolitan-Area ( #PCDATA ) >
<!ELEMENT Percent-change-1980-to-1990 ( #PCDATA ) > <!ELEMENT Percent-change-1990-to-1996 ( #PCDATA ) > <!ELEMENT Rank-1996 ( #PCDATA ) >
<!ELEMENT row ( Metropolitan-Area, FIPS-Code-MSA-CMSA, FIPS-Code-PMSA, At-1980, At-1990, At-1991-July, At-1992-July, At-1993-July, At-1994-July,
At-1995-July, At-1996-July, Rank-1996, Percent-change-1980-to-1990, Percent-change-1990-to-1996 ) >