Table of Contents
Acknowledgements...2
Abstract...3
Chapter One: Introduction...4
Chapter Two: Opportunities and Challenges for Small Towns...17
Chapter Three: Waterfront Communities, Resiliency, and Climate Change...33
Chapter Four: Current State of Infrastructure in Beaufort...46
Chapter Five: Conclusion...63
Appendix...70
Acknowledgements
First off, I’d like to thank my advisor, Professor Rachel Willis in American Studies. Without her academic support and guidance, none of this would be possible. She encouraged my research from the very beginning. As a young undergraduate who was interested in bikes but knew nothing of academic research I was nervous about the idea of an honors thesis, but her guidance has given me the support I needed to complete this project. She challenged me to think critically about every step of the process, making this research immensely more focused. Thank you. I also could not have completed this without the assistance of Professor Allie Thomas in City and Regional Planning and Professor Livis Freeman in Media and Journalism. Your expertise in transportation and writing have guided this to being a much more informative and complete piece. Your suggestions proved invaluable for my research and writing. I am extremely grateful for the hours you put into reading my drafts.
A very heartfelt thank you to Molly and Henry Froelich, Shandol Hoover, and everyone else in the Froelich Fellowship. The funds you provided were able to support my several trips into the field to gather the data necessary for my case study. As the backbone of my thesis, the field data was integral and your support made it all possible. Thank you for always supporting my
Abstract
Bicycles and Boardwalks:
Resilient Bicycle Infrastructure for Waterfront Communities Christopher Michael Garcia
Faculty Advisor: Rachel Willis
With increasing effects of climate change, cities and towns are becoming more interested in developing resilient infrastructure. Bicycle infrastructure, one popular form of resilient
infrastructure is becoming more present in towns and cities. Town qualities, such as close-knit communities, smaller sized blocks, and density make them especially suitable for bicycle infrastructure. My focus on Beaufort, North Carolina, highlights different challenges and opportunities small coastal towns can provide. The progress and potential of bicycle
infrastructure in Beaufort highlight how it can guide a community into becoming more prepared for climate change. This research will expand the relatively new area of bicycle infrastructure in small communities and bolster research on resilient solutions for coastal communities facing climate change.
Chapter One: Introduction
For many Americans, when the word bicycle is mentioned, childhood memories of learning how to ride for the first time flood their minds. The feeling of the wind in your hair and the newly found freedom granted by those two wheels is unlike anything else experienced in childhood. Children from the city to the suburbs and more rural areas all are able to experience learning how to ride a bicycle. However, when these children become adults, often that
appreciation for the bicycle is lost. Many adults often either do not realize the role bicycles can play in benefitting their lives, or acknowledge these benefits, but do not bicycle because of the danger that would incur. Numerous studies have shown the benefits of bicycles on health, the economy, and the environment, improving the lives of not only individuals, but whole
communities as well.
As climate change continues to cause more frequent and intense extreme weather events1, namely hurricanes and floods, it is becoming ever the more necessary to ensure resilient
infrastructure plans. These plans, which would allow infrastructure to bounce back after an extreme weather event, are being implemented to protect areas most at risk for these increases. Coastal communities are one of the most at risk areas for these extreme weather events. Largely ignored, bicycle infrastructure is a type of transportation infrastructure that provide numerous benefits for communities, while also withstanding the effects of worsening climate change. Influences on congestion per passenger are much lower with bicycles than they are with cars.2 Shifting toward more bicycle infrastructure will help boost bicycle ridership, leading to
decreased congestion. This decreased congestion will then contribute to lesser amounts of noise
and air pollution for the community.3 Bicycle infrastructure can also help communities become resilient by reducing its energy consumption and placing less wear and tear on the roads, leading to less frequent need to replace and repair them.4 If new infrastructure is not planned to be resilient in the face of climate change, coastal communities will be devastated by stronger and more frequent hurricanes and floods, as is already becoming the case for many communities.
By conducting a case study on one coastal community, the town of Beaufort, NC, I will show how this area is planning and developing bicycle infrastructure. This will allow me to gauge the efficacy of these plans in their increase of resiliency for the community. The strategies that combat climate change from this study will serve as a model in which other waterfront communities can replicate or avoid and ultimately benefit their citizens.
Methods
For this project, my research methods were threefold. First, I conducted a literature review of transportation scholarship including bicycles. This review included research within the fields of public health, economics, environmental science, psychology, public policy,
government, and of course, city and regional planning. It also included publications focusing on the impacts bicycles have had on communities, the environment, health and the economy. And furthermore, how these impacts were helped or hurt by the policies and cultures of the cities and regions housing the infrastructure.
Second, I searched through town bulletins and minutes from town council meetings to find mentions of bicycles, infrastructure, and anything transportation related. On top of these bulletins and meeting minutes, I examined the town archives, where I found the 2009 and 2015
3 Ibid.
reports. If there was an official conversation about bicycle infrastructure in the town of Beaufort, I had found it and read it from start to finish.
Finally, I took several trips to Beaufort in person and collected data on its bicycle infrastructure. On these trips, I collected geographic data of instances of bicycle infrastructure throughout the town. I also took note of several hotspots of activity around the town to determine if the bicycle infrastructure that is in place was properly serving its community. I used the data collected from these trips to create maps in QGIS, a geographic software, that better visualize Beaufort’s situation.
Literature Review
Several studies provide arguments in favor of investment in bicycle infrastructure. Some point to economic benefits, while others provide environmental or health benefits. For example, in “The Great Outdoors? Exploring the Mental Health Benefits of Natural Environments”, Tony Craig and David Pearson describe the reduction in stress and anxiety caused by proximity to greenspaces, a common location for bicycle infrastructure.5 Meletiou et al. highlight an example of economic investment in bicycle infrastructure in North Carolina that provided large economic benefits for the community in “Economic Impact of Investments in Bicycle Facilities: Case Study of North Carolina’s Northern Outer Banks.”6 Lester Brown’s Plan B 4.0: Mobilizing to
Save Civilization explains how the much smaller size of bicycles lends itself to a more compact
built environment, allowing more greenway and reduced reliance on cars and their emissions.7
5 Pearson and Craig, “The Great Outdoors? Exploring the Mental Health Benefits of Natural
Environments.” (2014).
6 Meletiou et al., “Economic Impact of Investments in Bicycle Facilities: Case Study of North Carolina’s
Northern Outer Banks.” (2005).
Other studies focus on how bicycle infrastructure is implemented. They also describe the successes and failures these cities have experienced when implementing these plans. Cycling and
Recycling brings us the case of Stockholm, Sweden and how its developmental exclusion of
bicycles is now costing the city much headache and funding.8 Stefan Bendik’s
Fietsinfrastructuur = Cycle Infrastructure showcases many different cities across the world,
including Vienna, Austria, which is one of the first cities to offer an apartment complex centered around bikes. The apartment complex does not have parking spots for every unit and the costs saved on reduced parking has allowed it to develop parking for 330 bikes and amenities like a sauna and multiple common rooms.9 These different examples of bicycle infrastructure will serve as guides and cautionary tales for implementing bicycle plans in towns like Beaufort.
Throughout my research, one trend kept appearing: the sparsity of research on small towns in the context of bicycle infrastructure. Most current scholarship focuses on larger cities and other densely populated areas, with little work done focusing on the less dense towns and rural areas. This is not to say no research is being done, as there are individuals who are looking at how bicycle infrastructure can translate to small towns. However, given the relative youth of this particular field, it is understandable that there is not a wide breadth of research on the matter. My thesis will contribute to this relatively new field of research and provide a case study for Beaufort, North Carolina that future researchers can look to for comparisons with other small towns, especially coastal ones.
Unfortunately, one of the biggest limitations to research on bicycles and bicycle infrastructure is a lack of data. The US Census does not specifically research ridership and ownership levels on bicycling in-depth. The US Census does include a measure of bicycle
ridership, but this measure is limited to bicycles as a method of transportation to work. Navigating the research and data from the North Carolina Department of Transportation (NCDOT) yielded similarly fruitless results. NCDOT boasts a Division of Bicycle and
Pedestrian Transportation that conducts related research, but the focuses of which are narrow. Past research includes collecting bicycle and pedestrian crash data and cataloging bicycle and pedestrian facilities located throughout the state.10
In 2013, the NCDOT began a new research project in collaboration with the Institute for Transportation Research and Education from North Carolina State University. This new project aims at determining the success of a systematic approach toward collecting bicyclist and
pedestrian counts.11 This study is only being conducted in the Triad, a location with a much larger area and population than Beaufort, and is incomplete at this time, but results from it should be helpful for the future of bicycle research. Helping expand widespread data on bicycle
ridership and ownership is outside the scope of my research but is a field ripe and waiting for more research to be done.
What does bicycle infrastructure look like?
For many, bicycle infrastructure consists almost entirely of bicycle lanes painted on roads. While those painted lanes are in fact a type of bicycle infrastructure, there are many different ways this infrastructure is present. Bicycle infrastructure is made up of any change in the built environment that encourages the use of bicycles as a mode of transportation. While, most commonly associated with lanes, bicycle infrastructure can vary in its forms.
10 North Carolina Department of Transportation. “Division of Bicycle and Pedestrian Transportation
Figure 1. Clockwise from top-left: on-road bicycle lane, cycletracks, contra-flow lanes, and off-street paths
The most common type of bicycle infrastructure is the on-road bicycle lane. It does not take an expert to identify it and for many without planning knowledge or experience, it is one of the more recognizable types bicycle infrastructure mentioned. On-road bicycle lanes, pictured in Figure 1, consist of painted stripes along the side of the road that designate the area between the curb and painted line as a lane for the use of bicycles.12
Cycletracks are similar to on-road bicycle lanes in that they are lanes that are also on the street and shared by cars and other automobile traffic. The key that sets apart the cycletracks from bicycle is that cycletracks have a layer of parked cars or curbs separating the bicycle lane with the automobile lanes.13 These parked cars and curbs act as buffers that help bicyclists feel
safer. This increase in perception of safety has been found to contribute to bicycle ridership growth.14 An example of Cycletracks can be seen in the top right of Figure 1.
Contra-flow lanes are a third type of bicycle lane, but unlike on-road bicycle lanes and cycletracks, these lanes run against the flow of traffic.15 These lanes, pictured in the bottom right of Figure 1, are often used on one-way car lanes to allow bicyclists the flexibility of using the road in the opposite direction. These lanes are protected to allow bicyclists a safe travel to their destination without being struck by a vehicle driven by someone unfamiliar with contra-flow lanes.
Off-street paths are another type of bicycle lane, but these are located off the street. These lanes often include bicycle trails and are paved in many cases. Off-street paths typically consist of two-way bicycle lanes that allow bicyclists to ride in either direction. In some cases, such as the one in Figure 1, off-street paths will be accessible to pedestrians.
Figure 2. From left to right: sharrows, signed bicycle routes, and bicycle specific traffic signals
Sharrows are another well recognized type of bicycle infrastructure. Sharrows are symbols, such as the one in Figure 2, painted on streets in automobile lanes with the image of a bicycle and typically two arrows. These symbols remind drivers that the lane they are in is
14 Pucher et al., “Infrastructure, Programs, and Policies to Increase Bicycling: An International Review.”
(2010).
shared with bicyclists. These sharrows are a relatively popular method of bicycle infrastructure as they do not incur the large costs that may come with building lanes or drastically changing the structure of the road.
Signed bicycle routes are streets that contain signage letting drivers know that the route they are on is a preferred route for bicyclists. Figure 2 shows an example of a signed bicycle route in Cary, North Carolina. The signage also explains that the roadway is shared between cars and bicycles, similar to the way that sharrows do. These signed bicycle routes allow another avenue to inform cars of the rights of bicycles on the streets. They are often used in conjunction with sharrows, as sometimes a driver may not notice a sharrow on the ground but will notice a sign on the side of the street.
Bicycle specific traffic signals are a type of bicycle infrastructure rarely used in the United States, but commonly seen in countries like the Netherlands.16 These signals, pictured in Figure 2, work much the same way that car traffic signals work in that they contain red, yellow, and green lights instructing bicyclists to stop, slow down, and go, accordingly. These special traffic signals are located along bicycle lanes and allow for more controlled traffic. The bicycle signals are integrated with car and pedestrian traffic signals so traffic is well organized and no bicyclist should run into or be hit by a driver or pedestrian. The signals will sometimes allow bicycles a head start in traffic at intersections, encouraging and rewarding bicyclists for their choice to bike.
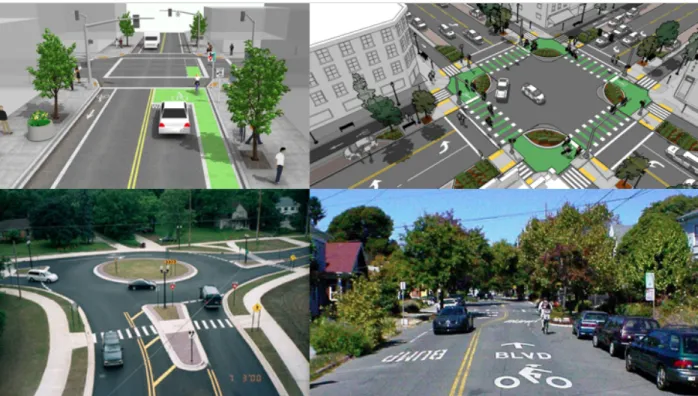
Figure 3. Clockwise from top-left: bike boxes, protected intersections, traffic calming techniques, and bicycle boulevards
Bike boxes are another rarity in the US, while much more popular abroad. Bike boxes are painted boxes at intersections that are placed in front of car traffic.17 These boxes allow bicyclists to have right of way when making left turns at intersections and avoids forcing bicyclists to be wedged between cars when waiting in left turn lanes. The rendering in the top left of Figure 3 provides an example of how a bike box should appear. Bike boxes are growing in popularity with a few of them appearing in cities such as Portland, Oregon.
Protected intersections are intersections that combine many different types of bicycle infrastructure. A protected intersection will have on-road bicycle lanes, bicycle dedicated traffic signals, and the occasional bike box. On top of these, the intersections will implement a small concrete island that forces cars making turns to make broader turns without cutting corners and driving over the on-road bicycle lane. In the case of the rendering in the top right of Figure 3,
these concrete islands are doubled as a home for plants, both protecting the bicyclist and beautifying the city. The bicycle traffic signals will also have priority at intersections to allow bicyclists to safely navigate the intersection without the fear of being clipped by a car.18
Traffic calming techniques are physical changes implemented in a street in order to slow down the speed of cars. These techniques can include speed bumps, elevated crosswalks, and traffic circles, like the one in Figure 3, among others.19 By slowing down car traffic, these techniques make the street a safer place for bicycles and other modes of transportation.
Bicycle boulevards combine traffic calming techniques with signed bicycle routes. These areas are similar to signed bicycle routes in that they contain the same type of signage to show drivers that the bicycle boulevard is a common bicycles route. They also make use of traffic calming techniques to ensure that these routes are safer for the bicyclists who commonly use them. In Figure 3, the bicycle boulevard pictured includes speed bumps to slow down traffic and make bicycling safer. These boulevards are also typically located on streets with relatively low levels of traffic.20
Figure 4. From left to right: integration with public transportation systems, end-of-trip facilities, and care-free zones
Integration of bicycles with public transportation systems is a crucial form of bicycle infrastructure that is often not thought of as specifically bicycle infrastructure. Sheltered parking
18 Wagenbuur, Mark. “Junction Design the Dutch – Cycle Friendly – Way.” (2017). 19 Vivanco, Reconsidering the Bicycle. (2013).
for bicycles at train stations or racks on the front of city busses are some of the most common instances of this integration. These links between bicycles and other forms of public transit, such as bus and rail systems allow bicyclists to have increased accessibility. Figure 4 shows a Dutch train car that allows people to transport their bicycle with them. It helps encourage people to bicycle by letting them know that if there is a distance that may be too far for them to bike on, they can still get there without the use of a car. All they need to do is ride their bicycle to the nearest public transit of their choice and use that form of transportation the rest of the way.
End-of-trip facilities, like the one pictured in Figure 4, are a type of bicycle infrastructure that can help mitigate the externalities of bicycling. Unlike driving in a car, riding a bike is an outdoor activity and bicyclists are therefore subject to the conditions of the weather. If it rains, bicyclists get wet, if it’s hot, they sweat. End-of-trip facilities can help make bicycling more viable by providing locations where the bicyclists can shower or change clothes, use the
restroom, and wash themselves off.21 These facilities counter the argument that a person cannot bicycle because they will get too dirty or sweaty to be presentable at their job. They also show the bicyclists that they are valued and have the right to be clean.
Car-free zones are a rather self-explanatory strategy for bicycle infrastructure. These are zones where cars are either excluded entirely or are excluded during specified hours of the day or days of the week. By excluding cars, even temporarily, these zones give the street over to
bicyclists and pedestrians, allowing those on bicycles to feel more comfortable with riding on the street. Figure 4 shows a car-free zone with pedestrians enjoying the shops and not worrying about cars running them over.
It is important to note that these different types of bicycle infrastructure are not mutually exclusive. In fact, in many cases, more than one type are used in conjunction with each other. An example of this may be bicycle lanes leading to a bus station, where the busses have bicycle racks. This allows bicyclists to ride their bikes to the station then bring it with them wherever they decide to ride the bus. These combinations of bicycle infrastructure methods allow them to support each other and encourage the use of bicycles as a legitimate mode of transportation.
By being able to visualize and understand these different methods the reader will have a foundational knowledge of bicycle infrastructure. This will allow the reader to be able to better understand examples and suggestions given to improve the community of Beaufort, North Carolina. It will also permit the reader to better understand how bicycle infrastructure can be utilized to increase the resilience of coastal communities when these links are further explored in later chapters.
Overview of Chapters
Chapter Two: Opportunities and Challenges for Small Towns will focus on the
differences seen when comparing bicycle infrastructure plans and policies of small towns and their larger city cousins. This chapter will highlight successes and failures that bicycle
Chapter Three: Waterfront Communities, Resiliency, and Climate Change will provide background information on the main concerns for waterfront communities. It will highlight what typical infrastructure looks like in waterfront communities. This chapter will also provide
background information on sustainability and resiliency, while explaining how bicycle infrastructure can improve these qualities in waterfront communities. It will also explore how climate change effects the vulnerability of the built environment in waterfront areas.
Chapter Four: Current State of Infrastructure in Beaufort will be a case study on the small town of Beaufort, NC which rests along the North Carolina coast. This chapter will feature reports from the town to gauge public perception of the state of both bicycle infrastructure and bicycle culture in Beaufort. Along with the reports, this chapter will include data from trips to Beaufort depicting the state of bicycle infrastructure in the town. This data will be assisted by maps created using geographic data collected from the trips. The chapter will also include information on the effects climate change has already started to have on Beaufort.
Chapter Two: Opportunities and Challenges for Small Towns
A Glimpse into Beaufort, NC
Beaufort, North Carolina is the quintessential small coastal town along the Eastern Coast of North Carolina. It has a population of around 4,000 and has a quaint downtown area along Front Street lined with seafood restaurants and coastal weather retail stores.22 The people are extremely polite and greet you with a wave as you pass them on the street, regardless of whether they know who are or have never seen you before. If you need directions, not only will someone help you, but they will likely guide you along the way to your destination.
The town is heavily dependent on two major industries: fishing and tourism. Like most towns along North Carolina’s Crystal Coast, Beaufort sees a large number of tourists during the summer months. At these times, you can see hundreds of people walking down Front Street stopping to grab a bite to eat at Clawson’s, grabbing a cup of coffee at Cru, or trying to spot wild horses at the Rachel Carson Reserve. You can also spot the occasional bike tour given by
Hungry Town Tours, a localbicycle, food, and history tour service. At other times of the year, you will sometimes spot a local resident riding their bicycle downtown with fresh produce from the local farmer’s market. Unfortunately, these sightings can be few and far between. Beaufort’s bicycle infrastructure is mostly aspirational and the regular bicyclists ride at their own risk. The next two figures demonstrate the infrastructure needs that were identified thirty years ago.
22 "Geographic Identifiers: 2010 Demographic Profile Data (G001): Beaufort town, North Carolina"
Figure 5. 1988 Map of advertised bicycle infrastructure created by the Town of Beaufort, funded by the North Carolina Department of Transportation Bicycle Program
This limited infrastructure actually in place runs contrary to what Beaufort’s tourism industry markets for bicycle tours, hotels, restaurants, and other tourist destinations. Figure 5 is a 1988 map created by the town and is frequently distributed by Hungry Town Tours and other tourism businesses in Beaufort. It depicts a town that has a series of well-connected routes that allow for ease of navigation by bicycle. Incoming visitors expect signs, racks, and other
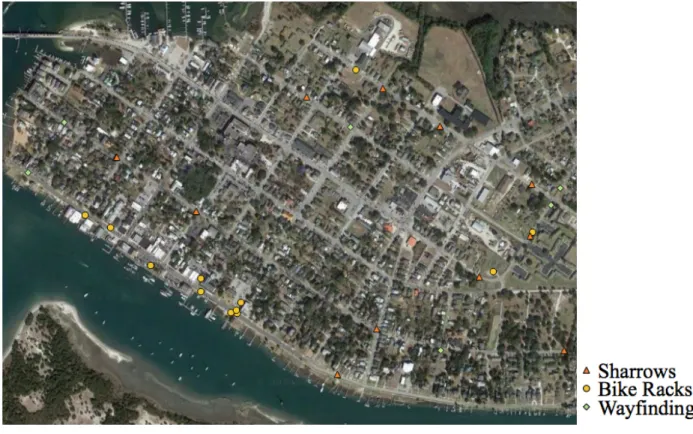
Figure 6. Map of popular tourist locations in Beaufort
not accurately depict the reality of infrastructure in place. It does, however point out areas where tourists are most likely to visit and where bicycle infrastructure improvements are needed.
Although this may seem to show that there is a lack of interest in developing bicycle infrastructure, this is not the case. The town has recently showed some interest in developing its bicycle infrastructure with two major reports, one of which was supported by the NCDOT. These reports were developed and presented in 2009 and 2015 and aimed at researching ways in which Beaufort’s bicycle infrastructure can be measured and expanded. These reports will be discussed in greater detail in the case study of Beaufort located in Chapter Four: Current State of Bicycle Infrastructure in Beaufort, NC.
The question of how to resolve this issue and make Beaufort more bicycle friendly can be partially answered by examining how Beaufort compares to other towns and cities. These
comparisons can show the opportunities and challenges Beaufort has in relation to other locations. They will also show some best practices taken by places to make their area more supportive of bicycling and can serve as a guide for methods Beaufort may want to implement or avoid.
How does Beaufort compare to other coastal towns?
North of Beaufort along the coast of North Carolina lie the Outer Banks. This string of islands is an incredibly famous tourist destination, boasting notable lighthouses and thousands of tourists every year. The Outer Banks contains 150 miles of coastline that attract people from all across the United States.23 Although the Outer Banks is made up of several small towns, the
comparison between them and Beaufort is not simple. Nonetheless, both areas are popular small coastal regions along the North Carolina coast and have many similarities.
Both contain a large number of second homes, that is, homes that are primarily owned as vacation homes and do not serve as the primary residence for their owners. This makes it more difficult to get public support for local policy changes and plans because many people who will be affected will potentially not be living in the area when the decisions are made. The Outer Banks, like Beaufort, is heavily dependent on its tourism industry, meaning many of the decisions that directly affect the built environment must take into account how they will attract or dissuade future tourists from visiting. Without a stable tourism industry, both Beaufort and the Outer Banks would likely see economic decline.
The two begin to differ when comparingtheir bicycle infrastructure. Unlike Beaufort, the Outer Banks has recognized the potential for bicycle infrastructure and has transformed
accordingly. Presently, the Outer Banks contains over 60 miles of bicycle paths and also heavily incorporates sharrows on the streets.24 Beaufort does not boast nearly as much incorporation of bicycles within the community, as will be further detailed in Chapter Four: Current State of Infrastructure in Beaufort. One key reason for the discrepancy between the two can be traced to the year 1993 and the NCDOT. In 2003, the NCDOT commissioned a study to determine the effects of a 1993 investment of $6.7 million in bicycle infrastructure over a ten-year period.25 This investment was given to the Outer Banks and allowed it to develop the network of paths seen today. Unlike the Outer Banks, Beaufort has not received as much funding to develop their bicycle infrastructure and their network is lacking, in part, because of this.
24 Ibid.
25 Meletiou et al., “Economic Impact of Investments in Bicycle Facilities: Case Study of North Carolina’s
How does Beaufort compare to typical big cities?
Although Beaufort cannot be compared to these larger cities in terms of size, funds, or historical development, these comparisons are designed to serve as conceptual models for what can happen to communities that are auto-centric and do not focus on multi-modal transportation. It is no secret that the typical big city has not historically prioritized bicycles as a mode of
transportation. Sprawl and the historical expansion of the auto industry has caused many cities to develop with a car-first mentality. Any trip to Virginia Beach, Charleston, Savannah, Miami, and many other big waterfront communities would show this lack of priority bicyclists receive. To bike in the typical big city is considered a dangerous act and those who do so risk their lives. Like Beaufort, these communities are all waterfront and financially dependent on their tourism industries. Unfortunately for many of these communities, cars are the default and most important mode of transportation and bicycles are mostly considered a mode of transportation for pleasure.
The League of American Bicyclists is one of the country’s biggest bicycle advocacy groups. Originally founded in 1880 as The League of American Wheelmen, the league currently boasts over 100,000 members and is highly regarded within the bicycle community.26 Every year, the League ranks every U.S. state based on its friendliness toward bicyclists. Each state is given a report card that examines how it ranks against other states based on the five criteria of: Infrastructure & Funding, Education & Encouragement, Legislation & Enforcement, Policies & Programs, and Evaluation & Planning. Public data, such as the National Highway Traffic Safety Administration’s Fatality Reporting System, and data from Department of Transportation and state bicycle advocacy group surveys makeup the backbone for these report cards and rankings.27
On top of these state rankings, the League also provides communities with the opportunity to be rated based on their bicycle friendliness. Similar to LEED certification, these ratings are
voluntary and initiated by the community, but carry weight with the bicycling community. Each community is given a designation (in ascending order) of bronze, silver, gold, platinum, or diamond rated based on a combination of the five categories used for states as well as what the League refers to as “Key Outcomes.” These key outcomes are made up of ridership, measured as percentage of daily bicyclists, crashes, measured in crashes per 10,000 daily bicyclists, and fatalities, measured in fatalities per 10,000 daily bicyclists.28
Another metric used to measure the bicyclist and pedestrian friendliness of a community is the service Walk Score. Walk Score serves to measure the friendliness of communities for pedestrians, public transit, and bicyclists. Each community is given three ratings, a Walk Score, a Transit Score, and a Bike Score. The Bike Score “measures whether an area is good for biking based on bike lanes and trails, hills, road connectivity, and destinations.”29 Unfortunately, like the League of American Bicyclists, Walk Score provides little to no data for smaller
communities comparable in size to Beaufort. This again highlights the issues when researching bicycle infrastructure for smaller communities.
A majority of the large waterfront communities mentioned above were rated by the League and given a bronze rating. Only Charleston was not rated by the League. For all three communities rated, the League took note that less than 10% of the communities’ total road network mileage consisted of bicycle infrastructure. None of these four cities ranked above a 4 out of 10 for bicycle enforcement.30 For these cities, bicycle infrastructure is simply not a
28 League of American Bicyclists, “Bicycle Friendly Communities.” (2016). 29 Walk Score. “How Walk Score Works.” (2018).
priority and bicyclists pay the price. The low metric for enforcement, defined by the League as “promoting safety and protecting bicyclists’ rights” is important to note as Pucher et al. found that the perception of safety is one of the most important factors in promoting bicycle ridership.31 With this low level of enforcement, it is no wonder the highest level of ridership for any of these communities is Savannah’s 2%.32 If Beaufort is to become a community where bicyclists thrive, it must ensure that those riding throughout its streets and neighborhoods have a high perception of safety.
All four of these waterfront communities were also rated by Walk Score. According to Walk Score, a community with a Bike Score between 0-49 is considered “Somewhat Bikeable” with “minimal bike infrastructure.” The next ranks are between 50-69, deemed “Bikeable” with “some bike infrastructure”, 70-89, deemed “Very Bikeable” where “biking is convenient for most trips”, and the “Biker’s Paradise” of 90-100 where “daily errands can be accomplished on a bike.”33 None of the four communities ranked above 60, Miami’s score. The other three all fell short with Savannah scoring a 48, Virginia Beach with 46, and Charleston not even receiving a Bike Score, despite receiving a 40 Walk Score.34 For the majority of these communities, Walk Score found that they “[do] not have many bike lanes.”35 Despite being some of the largest tourist communities on the East Coast of the United States, these communities did not invest in making their communities more bikeable. Beaufort should avoid these mistakes and aim to promote bicycling as it is a popular desired activity for tourists to coastal communities.
31 Pucher et al. “Infrastructure, Programs, and Policies to Increase Bicycling: An International Review.”
(2010).
32 League of American Bicyclists. “Award Database.” (2016). 33 Walk Score. “How Walk Score Works.” (2018).
Stockholm, a city popular and well known among tourists to Scandinavia, is guilty of a similar lack of consideration for bicycle infrastructure. In 1967, the construction of the
Centralbron Bridge, a bridge that would provide a crucial corridor between the separated north and south sections of the city, was completed.36 When plans were originally drawn up, there was no inclusion of bicycle lanes or any other infrastructure to encourage bicycling on the bridge. In a room of planning and developmental experts and policymakers, only one person attempted to advocate against the developmental exclusion of bicycles. His opinion was ignored and the bridge was constructed sans bicycle infrastructure.37 In recent years, Stockholm has received increasing pressure to provide links between the two major hubs of the city for bicyclists, a feat that could have been avoided had developers listened to the lone bicycle advocate. Recent solutions to this issue have proven to be costly and time-consuming, causing the city much more financial and social woe than necessary. Had Stockholm prioritized connectivity through bicycle infrastructure, the costs would have been much lower.
Although all of these cities are much larger, Beaufort falls into many of the same patterns as these larger cities. Beaufort, like the previously mentioned cities, is guilty of developmental exclusion of bicycles. While the issues that may arise from its lack of bicycle infrastructure will not be on the same scaleasthat of Charleston or Stockholm, they still play a role into the safety and quality of life for Beaufort residents. Beaufort must use these cities as warnings to the issues that can arise from not prioritizing the needs of its bicycling community. If these needs are properly addressed, the town will be able to boast a much more safe and enjoyable environment for bicycling for tourists and residents alike.
How does Beaufort compare to bicycle friendly cities?
Although it may seem that big cities and bicycle infrastructure are incompatible, many cities across the United States and internationally have made great strides in producing and promoting bicycle infrastructure. In the United States, cities like Portland, Oregon, Davis, California, and Boulder, Colorado are seen as meccas for American bicycling.And titans like Copenhagen, Denmark and Amsterdam, Netherlands frequently battle for the ranking of the world’s best city for bicycling.
For the American cities, all of them are ranked platinum according to the League of American Bicyclists.38 Although they may not meet the requirements to be considered diamond, they are some of the top-rated cities in the country. All of these cities boast incredibly high amounts of bicycle infrastructure as a percentage of their total road network with Boulder at over 76% and Davis at 100%.39 When looking at their Walk Score ratings, they boast similarly
impressive results. Portland has a Bike Score has a Bike Score of 72, Davis ranks at 89 one of the best in the nation, and Boulder has an 86 Bike Score.40 For bicyclists in these cities, bicycling can be seen as merely another mode of transportation rather than a deliberate act to throw one’s life into a lane of adrenaline and possible death. One of the keys to the success of these cities are its grassroots movement. These movements show officials that there is key public support behind the measures. On top of the extensive network of bicycle infrastructure along their roads, these cities do a great job of promoting bicycle education throughout their community. This is a key step in promoting bicycling, as furthering the community’s knowledge of their rights and capabilities on a bicycle can lead to an increase in both ridership and feelings of confidence
38 League of American Bicyclists. “Award Database.” (2016). 39 Ibid.
while riding. Smaller communities like Beaufort are able to communicate efforts more quickly and effectively because of their smaller populations. Grassroots movements can utilize this quick pace and show officials that measures to improve bicycle infrastructure will be well received by the communities they serve.
If Boulder, Davis, and Portland are seen as great cities, Amsterdam and Copenhagen are different planets entirely. Both cities have some of the highest ridership numbers in the world and are globally regarded as the leaders in bicycle friendliness. Children are taught how to ride bicycles at a young age and continue to do so for the rest of their lives. One thing these cities have in common is the high position with which the bicycle is regarded in their culture. For the Netherlands, the bicycle is a symbol of resistance dating back most recently to its occupation by the Nazi forces in World War II. The Nazis demanded that the Dutch hand over their bicycles to help support the Nazi forces and banned bicycling at several times throughout the occupation.41 The Dutch resisted on their trusty iron steeds, even bicycling in the dead of night with no light if need be. They would not give up their bicycles to assist the Nazi regime in its quest to conquer all of Europe. After many failed attempts to commandeer the bicycles from the Amsterdammers, the Nazis eventually gave up and the bicycle had led the citizens to a successful resistance.42
Although these foreign cities have different planning systems than those in the United States, their expansion of bicycle friendliness are recent phenomena. This shows that Beaufort and other communities are not drastically setback because they have not had a long history of bicycle infrastructure and culture.
Beaufort does not have the sizeable public coffers that cities like Amsterdam and Portland boast, but a similarity between the town and these cities is its public support. The
people generally see bicycling as a benefit to their community and encourage its growth throughout. Even with public support behind it, bicycle education will still be a hurdle for Beaufort. If Beaufort can reproduce techniques used in these successful cities to promote bicycle education across age groups, it would be one step closer to transforming into a place that could rival other successful bicycle communities.
Making a greener community blossom
After examining how Beaufort compares to other cities and towns, some may still ask: so what? Why should anyone care about making a town or city more bicycle friendly? For starters, bicycle infrastructure has been proven to benefit the environment in a number of ways. Unlike automobiles, both gasoline and electric, bicycles do not require oil or batteries to operate,
decreasing the need for these resources. A decrease in these resources creates less of a market for them and will lead to a decrease in obtaining them through environmentally damaging methods such as offshore drilling and fracking. Because bicycles do not use oil or batteries, they also do not produce harmful emissions into the atmosphere, one of the most prominent anthropogenic factors contributing to global climate change.43 Bicycles are also much smaller and lighter than automobiles and require a much less taxing production system to make them. This lighter production will require the burning of much fewer fossil fuels, further reducing emissions into the atmosphere.44 These benefits alone could sway some to bicycle more often to commute to work or to run errands around town.
If more community members travel by bicycle, car congestion will decrease. These lower levels of congestion will not only reduce pollution from cars at a standstill in traffic but will also
reduce frustration and noise pollution often associated with traffic jams.45 These reductions can transform a community into a much friendlier place to get around instead of one riddled with traffic and blaring car horns.
Although some may argue that the environmental benefits of bicycling and bicycle infrastructure are minimal in comparison to other larger policy changes, the fact that bicycling can benefit the environment should not be discarded. Encouraging communities to bicycle more can also change mindsets about the role people play with their environments. It is impossible for someone to bicycle entirely indoors and therefore is impossible for a bicyclist to ride without acknowledging their relationship with the environment. This increase in awareness can cause a community to change their perception on how they interact with their environment, which may lead to policy changes on recycling or plastic bag use throughout the town. The emission decreases and awareness increase provide strong arguments for the environmental benefits and necessity for more bicycle infrastructure investment.
Bicycling toward a healthier tomorrow
While many people may be familiar with the environmental benefits of bicycle
infrastructure, fewer people are aware of the vast health benefits this infrastructure can provide. By increasing levels of bicycling, bicycle infrastructure encourages community members to exercise more, leading to decreases in cardiovascular disease, osteoporosis, and arthritis.46 These are conditions that make up some of the most common causes of death or decreases in quality of life for Americans annually. By bicycling more, communities will enjoy longer and higher quality lives.
Not only can bicycle infrastructure benefit a community’s physical health, but studies have shown that bicycle infrastructure can also benefit mental health. Bicycling forces community members to spend more time outside and within nature. One study found that “proximity to greenspace has been associated with lower levels of stress and reduced
symptomology for depression and anxiety, while interacting with nature can improve cognition for children with attention deficits and individuals with depression.”47 Bicycles are not often associated with mental health, but their benefits to the mind coupled with their physical health benefits provide another justification for the importance in investing in bicycle infrastructure that will encourage the community to become a much healthier one.
But what about the costs?
For many communities like Beaufort, finances are not abundant and budgets must be tightly balanced. Because of this, plans that are not economically viable have little chance at being implemented in these communities. In the case of bicycle infrastructure, a small investment can have largely rippling effects.
One economic benefit from increased bicycle infrastructure can be tied back to the health benefits mentioned previously. With a healthier community, businesses in the town will have their employees taking fewer sick days and the community’s healthcare systems will see a reduction in patients, and subsequently, costs.48 On top of these reduced costs from healthier communities, it is shown that bicyclists often spend as much, or more, than their driving
neighbors.49 With reduced costs from driving less, bicyclists have more flexible income and are
47 Pearson and Craig, “The Great Outdoors? Exploring the Mental Health Benefits of Natural
Environments.” (2014).
more likely to indulge in a purchase they would have otherwise forgone. Local businesses can thrive from this increase in traffic and spending from community bicyclists, causing a boost for the local economy. An investment in improving bicycle infrastructure, in particular bicycle racks outside businesses, creates more customers in local stores and restaurants without the need for additional parking. This is a very cost-effective tool to boost the local economy and its
foundational shop owners.
In 2003 the NCDOT commissioned a study on an investment in bicycle infrastructure in the Outer Banks. The $6.7 million investment took place over a ten-year period beginning in 1993. The study determined that over the course of the investment period, over 1,400 jobs had been supported or created and the most conservative annual estimates showed an economic impact of $60 million to the community.50 This study counters the common misconception that spending money on bicycle infrastructure will provide little return to a community.
A 2018 study conducted by the Victoria Transport Policy Institute found that economic benefits from more active transportation, namely bicycle and pedestrian infrastructure, are numerous. It found that benefits resulted from reductions in motor vehicle travel and land use impacts. Reductions in motor vehicle travel produced benefits of $0.060 per passenger-mile for congestions reductions, $0.042 for roadway cost savings, $0.360 for parking cost savings, $0.030 for energy conservation, and $0.044 for pollution reductions.51 These numbers show the
economic benefits that can result from investments in bicycle infrastructure. Providing a choice in transportation for communities allows them the option to choose non-automotive
transportation, resulting in the benefits listed above. Land use impacts found benefits of $0.002
50 Meletiou et al., “Economic Impact of Investments in Bicycle Facilities: Case Study of North Carolina’s
Northern Outer Banks.” (2005).
per passenger-mile for pavement reduction and $0.051 for increased accessibility.52 While these numbers are not as high as the benefits from reduced motor vehicle travel, they still highlight other areas of economic benefit for a community choosing more active methods of
transportation.
Taking all of the environmental, health, and economic benefits into account, it can be hard to argue against an investment in bicycle infrastructure. Should Beaufort consider these benefits for its community and implement further development in bicycle infrastructure, it will be well on its way to becoming a community that is greener, healthier, and wealthier.
Chapter Three: Waterfront Communities, Resiliency, and Climate Change
Overview of main concerns for waterfront communities
For many waterfront communities, the fact that they are along a waterway is both a boon and curse. This proximity to water draws in numerous tourists from widely varying locations. It also allows for goods to be transported to the communities via water, one of the cheapest methods of global trade. The water can also provide a unique set of challenges that would not concern the community if it were located inland. Because these communities are along the water, they must plan for the issues bound to arise with natural hazards such as flooding and extreme storms.
According to Bedsworth and Hanak, traditional methods of hazard mitigation for flood control have included structural tools, planning and regulatory tools, response tools, and market-based tools.53 Structural tools “add infrastructure or technologies that provide protection from risks or reduce vulnerability” while planning and regulatory tools “alter codes and standards to minimize risk by keeping development out of dangerous locations or increasing its resilience.”54 Response tools “minimize the effects of hazards once the emerge” and market-based tools “[include] offering financial incentives to encourage households and business to make risk-reducing decisions.”55 Bedsworth and Hanak further break down these groups, providing
examples of measures that these tools use. Levee and reservoir upgrades, for example, are a type of structural tool. Other notable examples are restrictions on floodplain development, which fall under planning and regulatory tools, and flood evacuation plans, which are categorized as a
53 Bedsworth and Hanak. “Adaptation to Climate Change.” (2010). 54 Ibid.
response tool.56 Through the use of these tools, waterfront communities can place themselves in a position to defend against natural hazards.
With the addition of climate change to the picture, these tools require modification. Escape routes need to be altered to account for issues that may arise from climate change induced flooding or extreme weather. Along with policy upgrades, infrastructure must also be changed to withstand the likely events of more frequent and intense extreme weather along with gradual effects such as rising sea levels.
What does infrastructure look like in a waterfront community?
When thinking about waterfront communities, the mind floods with images of sandy beaches, blue skies, waves breaking just offshore, boats and ships off in the distance, sand castles, and children at play. It imagines beach houses on stilts, boardwalks attached to
oceanfront restaurants and skinny streets with slow speed limits for passers-by to calmly enjoy the sea breeze and salty smell of the ocean. These scenes are easily spotted in most waterfront communities and are often taken at face value for the casual tourist.
What the tourist may not realize, however, is that there is often a rhyme and reason for some of the design of these waterfront communities and without that intentional design, climate change may force the tourist to find a new vacation spot. For example, instead of many single-family homes across the country, which have their garages and bedrooms on the same floor, waterfront communities often build properties on stilts or have many floors with the bedroom being of a much higher elevation than the garage. This is to protect the buildings and their
occupants against storm surges and flooding that are common byproducts of being in close proximity to bodies of water.
With waterfront community building development keeping in mind the byproducts of water proximity, one would expect the streets to be designed in a largely similar fashion. In fact, the opposite is true. Many streets in waterfront communities are built using asphalt as opposed to concrete. This preference is a result of auto-oriented thought. Cars are assumed to be the main priority for roads and the asphalt standard is then upheld. Asphalt is cheaper to maintain, but is less durable, especially in the face of water, resulting in constant potholes, grooves, and cracks filling with water and leading to a less safe waterfront street.57 Concrete also does not require oil in its production, as asphalt does, allowing concrete to boast itself as a less environmentally damaging product. With all these reasons to choose concrete over asphalt, it can be confusing to see many of these communities choosing asphalt for their new roads. Unfortunately, both asphalt and concrete are impervious surfaces, which make flooding issues worse by blocking water from being absorbed by the material. One reason asphalt often wins over concrete in these areas is the cost. Concrete roads take longer to install and are initially more expensive than asphalt roads. Given that lawmakers are using public money to fund these projects, it is easy for them to come to their constituents with a seemingly cheaper option that will gain them easy political points. Often times, the lawmakers who support this are no longer in office when the time comes for repairs to be made to the asphalt that has become riddled with dangerous cracks and potholes. In some cases, local politicians have little say on the roads because the majority of the roads in their constituency are owned by the state or national government. In the case of Beaufort, roughly half of the roads in the town are local roads and controlled by the town government. The other half
57 Reliable Contracting Co. Inc. “Concrete vs. Asphalt: Perpetual Pavement and the Lifespan of Asphalt.”
are arterial roads controlled by the state. Beaufort has little control over what can be implemented on these roads.58
Coinciding with the idea of politicians cutting costs on roads by choosing a cheaper initial material, they often do not build streets large enough to possibly fit in more than a car, such as a bicycle lane. These streets are often designed to reflect the current needs of a
population and its cars, without taking the time to research the likely new demand for the town. By leaving only enough room for the current automobile demand, these policymakers keep costs down on the front end, ignoring the eventual road widening or lane building projects the
constituents will demand in the future.
An alternative to these narrow, auto-centric roads are complete streets. Complete streets are a type of transportation policy that refocus streets for more multi-modal transportation. The NCDOT adopted complete street policy in 2009 and hopes to use this to “[promote] more sustainable communities, [increase] connectivity between neighborhoods, streets, and transit systems, and [improve] safety for pedestrians, cyclists, and motorists.”59 Unfortunately, this policy currently remains more focused at the state level and less so at the local level. If complete street designs continue to be ignored, waterfront communities, especially those of smaller communities with fewer funds at their disposal, will stray further away from becoming more sustainable places for residents to live knowing that they are prepared for the future.
Sustainability and why to aim for it
One of the principle methods for improving a community’s ability to adapt to changing conditions is to increase its sustainability. Sustainability, according to a study conducted by
Ahmed, El Seraph and Lutz (1989) refers to “the ability to maintain an activity without that activity using up crippling levels of resources and creating a future debt that is not offset by equal levels of future benefit.”60 Sustainability is a concept that spans many fields, including, but not limited to, economics, environmental science, and energy.61 Because there is a finite amount of resources available, it is crucial that those consumed are eventually renewable.
Often when communities measure the sustainability of their infrastructure, the main factors examined are the rates of consumption for both funds and materials.62 Measuring infrastructure sustainability in this way, however, presents issues as the two main types of infrastructure are not measureable in the same manners. Hard infrastructure, or changes in the built environment such as airports and roads, are easier to measure for financial and
environmental sustainability because there are specified costs, resources, and locations for projects. They can then be compared by examining their states before and after the infrastructure was implemented. Soft infrastructure, or services and institutions that “increase the quality of labor that [are] key to a knowledge economy,” such as education and policies, are much more difficult to measure for sustainability because of their lack of measureable numbers.63 This leads sustainability measurements to exclude soft infrastructure, a crucial error given how crucial soft infrastructure can be for creating lasting change in a community.
Infrastructure sustainability, in the case of waterfront communities, is vital because it“is key to economic development: public capital investment stimulates private capital investment.”64 In fact, according to Haynes, “besides the production and market access savings, infrastructure
60 Haynes, Kingsley E. Infrastructure: The Glue of Megacities. (2006).
61 Caldwell, Wayne J., ed. Planning for Rural Resilience: Coping with Climate Change and Energy
Futures. (2015).
62 Haynes, Kingsley E. Infrastructure: The Glue of Megacities. (2006). 63 Ibid.
generates a direct consumer benefit by reducing consumption costs in housing, transportation and the retail sector.”65 These reduced consumption costs translate into lower costs of living and increases in affordability of a community. With increased affordability, residents are likely to purchase more, stimulating the economy, and subsequently boosting quality of life. More sustainable infrastructure can ultimately help communities improve their economy, their health, and benefit the longevity of the planet’s resources and inhabitants.
Resiliency and its importance for waterfront communities
The term resiliency is one that is seen in a number of different fields, including, but not limited to, ecology, planning, public health, and mental health. Because of this, it comes as no surprise that there is an equally abundant amount of definitions for the term dependent on the field. For the purposes of this research, resiliency will be defined as the ability of a community to bounce back and recover from the occurrence of extreme weather events, namely floods and hurricanes. According to Caldwell, the process of planning with the ability to bounce back shifts a community from being reactive to taking more of a proactive role in its future prospects.66 Resilience should therefore be a key goal for waterfront communities, given the recent and upcoming changes to the natural environment through climate change. Should these communities continue to increase the resiliency of their area, they will be best equipped to deal with the next Hurricane Matthew or Hurricane Floyd, two hurricanes that wreaked havoc upon North Carolina.
Resilient communities are made most efficient by making use of the following characteristics: redundancy, diversity, efficiency, autonomy, strength, interdependence,
65 Ibid.
66 Caldwell, Wayne J., ed. Planning for Rural Resilience: Coping with Climate Change and Energy
adaptability, and collaboration.67 When all of these elements come into play, a community will have the best chance of surviving and recovering from climate change, boosted storms and other extreme weather events. If all elements are not incorporated, a community will be less prepared, but still better positioned than if they had made no efforts to improve their resiliency.
Redundancy, while often thought of in a negative connotation, is a useful element of resilient systems. In other systems, having redundancy, sometimes in the form of multiple processes that do mostly similar tasks, can reduce efficiency and hurt the systems’ ability to operate quickly. In the case of resiliency, redundancy helps to prepare for the worst. Hurricane Katrina, and the devastation she brought in 2005, is a clear example of a system not taking redundancy measures into account and paying the price for it. When Hurricane Katrina’s storm surge pressed against the floodwalls and levees in New Orleans, there were no redundant systems in place as a fallback plan should the floodwalls and levees fail, as they did.68 Had the City of New Orleans ensured it had redundant measures in place to ensure protection if their initial defenses failed, the storm would have not devastated the area as much.
Diversity, in the case of resiliency, is defined by Caldwell as “multiple components or nodes versus a central node to protect against a site-specific threat.”69 What this means is that a system needs to have diverse elements in it in order to protect it, should an issue arise with one of the elements. This concept is similar to the idea of diversifying one’s investments in order to avoid ‘putting all of one’s eggs in one basket’. This technique allows a community to avoid disaster should one element fail and it being the only element in place to protect the community.
67 Ibid.
68 Schwartz, John. “Army Corps Admits Flaws in New Orleans Levees.” (2006).
69 Caldwell, Wayne J., ed. Planning for Rural Resilience: Coping with Climate Change and Energy
This is different from redundancy in the fact that a redundant system may have multiple variations of the same element as opposed to a number of different elements.
Efficiency is the ability for a community to make the most use out of the fewest amount of resources available.70 This element is crucial as a less efficient system can have disastrous effects on a community. Take transportation for example. If a dense community has an
inefficient transportation systemthat relies solely on automobiles and little to no public transit, it is bound to have massive congestion issues. This congestion would then contribute to reduced air quality in the area and increased heat island effects because of the increased emissions. These reductions in environmental quality not only further contribute to climate change, but also reduce the quality of life in the community. This causes a negative downward spiral as health will decrease, causing insurance and healthcare costs to rise, further reducing quality of life for the citizens of the community.
A more efficient system allows for the ability to use less energy while allowing
productivity to be unchanged, or even improved. This will allow improved quality of life in the community as well as increased resiliency in the form of more efficient use of limited resources when struck by an extreme weather event. On-road bicycle lanes are an excellent example of how bicycle infrastructure can further increase a community’s efficiency, and therefore resilience. If a road is already being constructed, the dedication of a fraction of the road to bicycles will provide another method of transportation for a community without having to construct an entirely new road. This will make the most efficient use of the newly constructed road.
Autonomy is the element of resilient community systems that seeks to manage the politics of resiliency. It is the ability of the community to act independent of other governmental oversight.71 In many situations, a community is unable to develop resilient infrastructure because of its reliance on other governing bodies, be they neighboring communities, the state
government, or the national government. This inability to act independently can cause the community to develop plans that are not as effective at increasing its resiliency. In
Massachusetts, after a long period of fighting, Barnstable County finally gained autonomy over decisions involving land use, community design, and environmental protections.72 The law that enabled this, the Cape Cod Commission Act was significant in that it provided an example for other communities interested in gaining the autonomy to make these decisions for itself, rather than having to rely on outside forces.73 In some cases, reliance on other governmental systems is a benefit, especially when the issue becomes one of funding. Many times, however, the inability for a community to take charge of its own issues results in ineffective infrastructure that does not increase the resiliency of the community.
Strength is one of the more straightforward elements of resiliency. It is the ability of the system to withstand an extreme weather event. A metric used in gauging strength of
infrastructure is whether or not in can withstand a 100-year storm.74 This metric measures how well the infrastructure will hold up compared to a storm that is so strong it would have a chance of occurring only once in a 100-year period. This, however, is a metric used primarily by insurance companies, such as the National Flood Insurance Program and fails to account for the
71 Ibid.
72 Montgomery, Carleton K. Regional Planning for a Sustainable America. 73 Ibid.
74 Schleifstein, Mark. “New Orleans area's upgraded levees not enough for next 'Katrina,' engineers say.”
likelihood that 100-year storms are becoming increasingly frequent. Storms that would have otherwise occurred once in 100 years are becoming more common, devastating infrastructure. In some cases, like that of Hurricane Katrina, this measure of resiliency is not good enough at building infrastructure that will last and improve the resiliency of a community. Data shows that surges from Hurricane Katrina reached levels of that of a 200-year storm.75 This highlights the increasing need for stronger infrastructure built to withstand increasingly extreme events. Along with the increasing strength, metrics need to be updated to reflect the higher standards necessary for resiliency.
Interdependence requires that different components of a resilient community are integrated. This integration will benefit the community by having components that do not compete with each other for resources and support each other in their success. This support allows the interdependent community to work more efficiently, further boosting its resiliency.
Adaptability is one of the most crucial elements of resiliency. This is the ability for a community to acknowledge its past failures, learn from them, and improve itself in order to withstand the next challenge.76 Without adaptability, there is little forward progress after an extreme weather event. Events that damage communities, while hurting it economically, emotionally, etc. also provide the community to grow from their experiences. A storm like Hurricane Katrina showed the City of New Orleans and the State of Louisiana where its infrastructure was not as resilient as it should have been. This has caused the area to adapt and improve its defenses to ensure that a situation like what resulted from Hurricane Katrina never occurs again.
75 Ibid.
76 Caldwell, Wayne J., ed. Planning for Rural Resilience: Coping with Climate Change and Energy
Collaboration, the final element of a resilient community, is defined by Caldwell as “multiple opportunities and incentives for broad stakeholder participation.”77 When communities have high levels of collaboration, they have stakeholders from all parts of the community
working together. This allows the community to become more tight-knit and invested in
improvement for all of its members. This increased closeness among a community can allow for more united decisions on issues such as energy efficiency and transportation infrastructure, both key elements in improving community resilience. The pitting of neighbor against neighbor that can slow down government processes would be reduced in this more cohesive environment. More cooperative decision-making contributes to quicker and more efficient decisions, which ultimately leads to a more resilient community.
Like elements of bicycle infrastructure, these elements of resiliency are not designed to work alone. They are most efficient when used in tandem with each other. By doing so, a community is able to provide itself with the best possible outlook toward a more resilient future that can withstand the impending effects of climate change.
Climate Change causes and effects
It should not serve as news to anyone that the world’s climate is changing, is changing rapidly, and is changing because of anthropogenic factors. In 2017, the United States Global Change Research Program released its Climate Science Special Report. The report was a collaboration with over 100 scientists and industry experts across the country ranging from members of NASA, NOAA, the United States Army Corps of Engineers, and well-respected universities like Columbia University and the University of North Carolina at Chapel Hill.78 This
77 Ibid.